Actual behaviour from a Schedule
- 13 Dec 2025
- 4 Minutes to read
- Print
- DarkLight
- Download PDF
Actual behaviour from a Schedule
- Updated on 13 Dec 2025
- 4 Minutes to read
- Print
- DarkLight
- Download PDF
Article summary
Did you find this summary helpful?
Thank you for your feedback!
In the real world, things are often different from the theoretical world. There are many other factors at plan which can influence the outcome you achieve from a schedule.
Remember the aim of the schedule is explained by the below example:
I have a set of resources costing me 1000 per month
I will turn them off 50% of the time when they are unused
I will see a base line reduction in my costs after I turn my schedule on
For subsequent months I will look to maintain the new reduced baseline cost
The bill will not show “new” savings each month for these resources
Other Factors affecting my Scheduled Resources
The below table describes other factors which may affect the outcome of my schedule.
Factor | Explain |
|---|---|
No. days in the month | Theoretical savings are calculated based on an average month with 30 days. Some months have 28 and 31 days in them so the actual costs and benefit in these months will be different |
When was the resource added to the schedule | If the resource was added to the schedule part way through the month then you would see a partial base line drop in month 1 and then in month 2 you would see the remainder of that drop. |
The exact time the resource shuts down | Many resources use per second billing and the exact time the resource is shut down may vary day to day |
Did any of the resources fail to shut down | A schedule will often retry in the case of a failure but their may be cases where an error causes a resource not to be shut down. This will affect the costs |
Where does month end and month start fit into the schedule | If you have a 9 to 5 and 5 days per week schedule then resources are off at the weekend. If the month end or month start fall on weekends then this may affect the number of hours that resources are on when comparing 1 month to the next month |
What level are you looking at the costs | If you are looking at the cost for the specific resources covered in the schedule then you are probably fine. If you are looking at the costs at resource group level then there are other costs not covered by the schedule which are coming into play which will skew the perceived impact of your schedule. As an example another resource may be used with a consumption billing model which has an increased cost which matches the reduced cost of your scheduled resources which may make things appear not to have changed |
Commitments applying to the resources | If other savings approaches are also impacting the same resources which are on a schedule then this may make a big difference to the perceived benefit of the schedule. If you have a month where reservations or savings plans act on the resources for a large number of hours and then you schedule the resources it may be that the resources do not get impacted by those savings plans and reservations as much as they did the previous month. As an example:
When you have reservations and savings plans also acting on the resources it will be challenging to workout the exact impact of your schedule. You can not pin reservations and savings plans to specific resources and they may pick up different resources on an hourly basis. As a general rule:
|
Resource is shut down outside of the schedule or turned on outside of the schedule | If the resource is turned on or shut down outside of the schedule then you will see this impact your costs and perceived savings / benefits from the schedule |
Expected Pattern of Actual Behaviour
When we see the baseline drop from a scheduler as shown in the below diagram, we are looking to maintain that drop in future months as shown below.
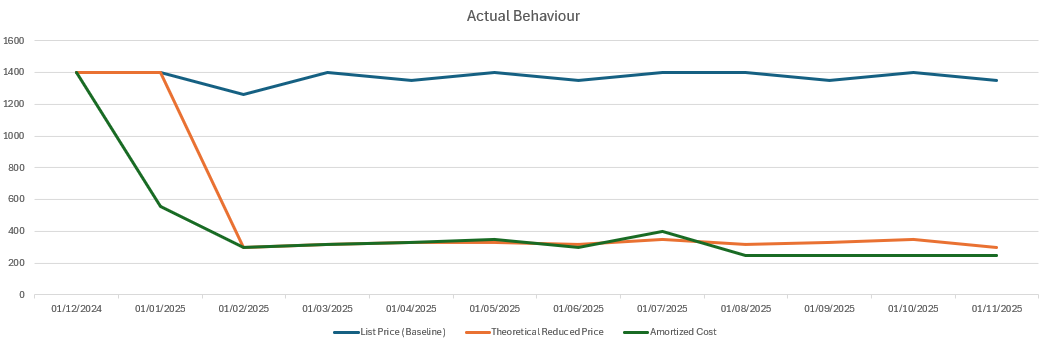
In the above diagram you will notice a few things:
Observation | Explanation |
|---|---|
The amortized cost dropped quicker than | In this case the resources had reservations or savings plans that acted on them a lot and the cost dropped quicker to the base line Over time this levelled out because the reservations and savings plans werent always acting on these resources and were usually reallocating to other resources. |
The amortized cost is sometimes higher than the theoretical cost | In these cases it could be things like the resource is a VM and there are additional costs for things like bandwidth. The bandwidth is not consistent and is an unknown when calculating the savings. When the VM is off the bandwidth is zero but when the VM is on the bandwidth may vary and this is part of the resource level cost. There will be other meters for different resources which will be affected like this when comparing actual vs theoretical. The savings calculation is really based on the estimated costs based on the number of on and off hours and some costs such as bandwidth may vary a lot during the day. |
The amortized cost is sometimes lower than the theoretical cost | You may have some of the following scenarios:
|
Was this article helpful?