- 19 Nov 2024
- 7 Minutes to read
- Print
- DarkLight
- PDF
API Management
- Updated on 19 Nov 2024
- 7 Minutes to read
- Print
- DarkLight
- PDF
APIM API
APIs are the foundation of an APIM Service instance. Each API represents a set of operations available to developers. Each API includes a reference to the back-end service that implements the API, and its operations correspond to the back-end service's operations.
When APIs are used to include critical business logic in a solution, it is necessary to evaluate the API Management APIs' dependability, efficiency, and performance.
Resource Dashboard
A default resource dashboard is available for APIM API resources in the Overview section, allowing for enhanced data visualization and tracking of real-time data.
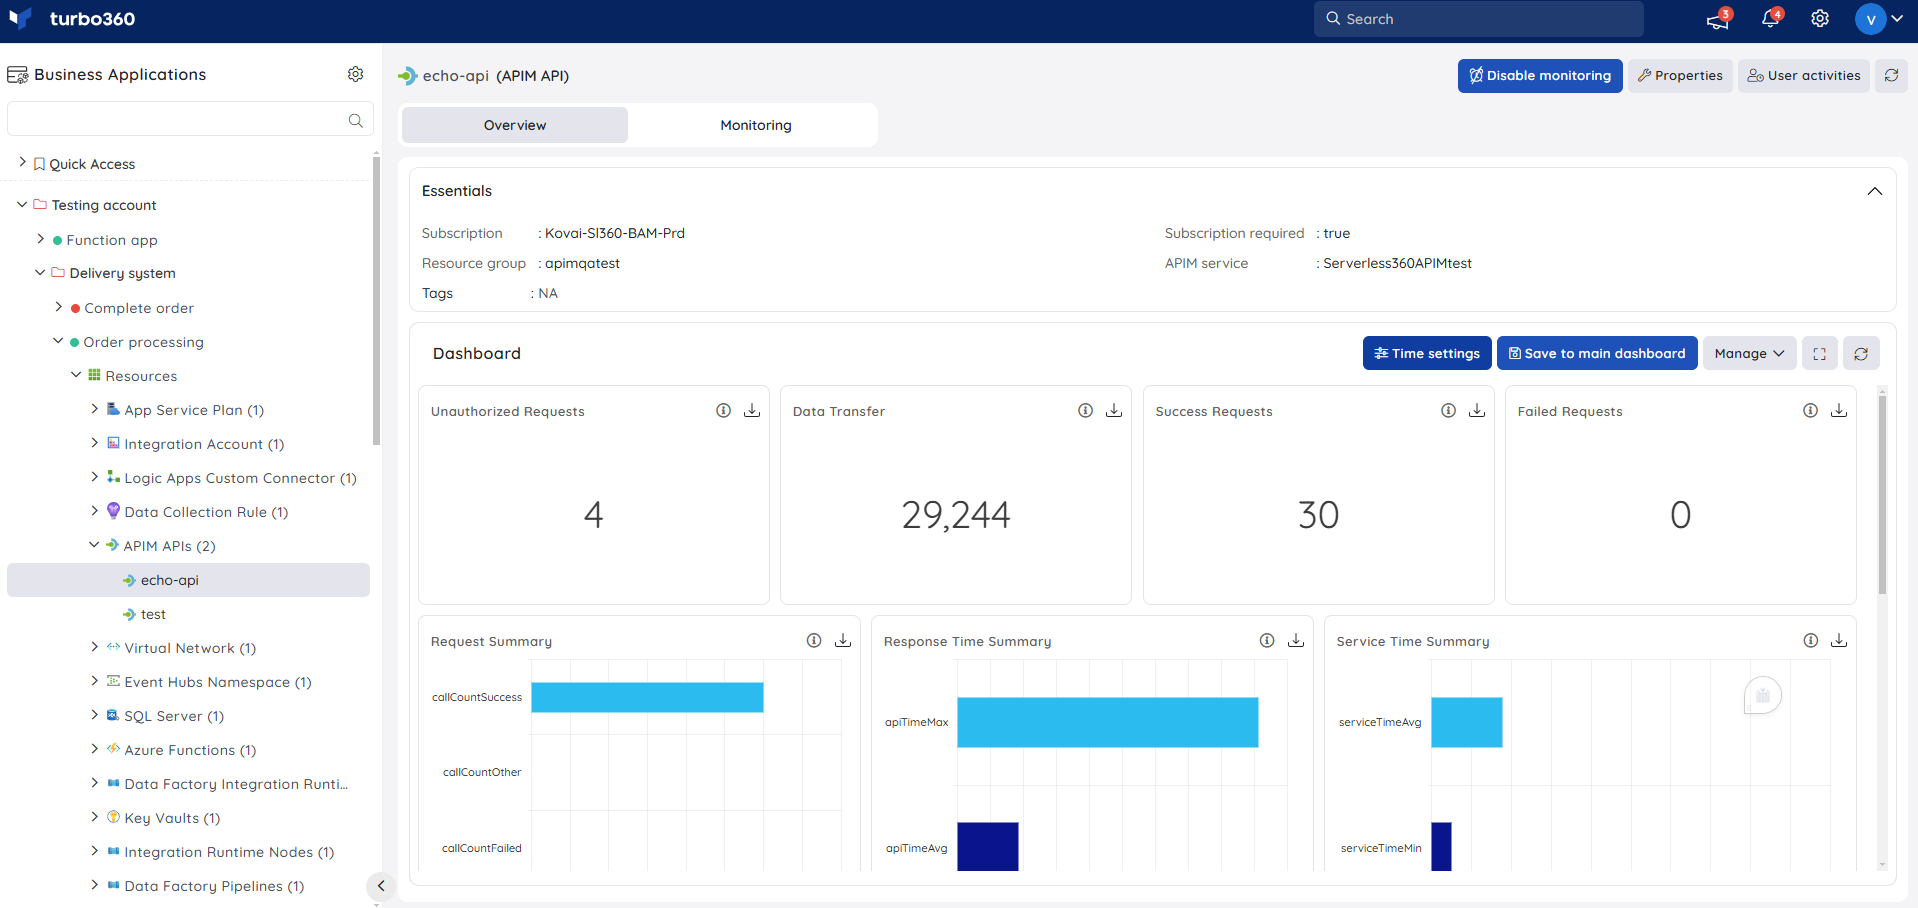
Users are provided with the following pre-defined Dashboard widgets, which can be customised to meet their specific needs.
1. Unauthorized Requests
2. Data Transfer
3. Success Requests
4. Failed Requests
5. Request Summary
6. Response Time Summary
7. Service Time Summary
8. Response Time Maximum vs Minimum
9. Cache Hit Vs Miss
10. Request Success Vs Failure
The data source for the dashboard widgets can be a query or metric data for chart types other than the Count chart.
A set of default queries is available to create dashboard widgets for query data using the associated application insight.
Any application insight resource can be used to generate query data that can be used for data visualization in the APIM API resource dashboard.
Monitoring
- Navigate to APIM API -> Monitoring to configure monitoring rules
- You can configure the monitoring metrics under the Rules tab and query rules under the Queries tab
Metric monitoring
- Switch to the Rules tab to configure rules for metric monitoring
- Select the necessary monitoring metrics and configure the threshold values
- Click Save
The threshold values can also be provided with any metric name, defining the monitoring rule to be violated when the metric value configured at threshold field is met.
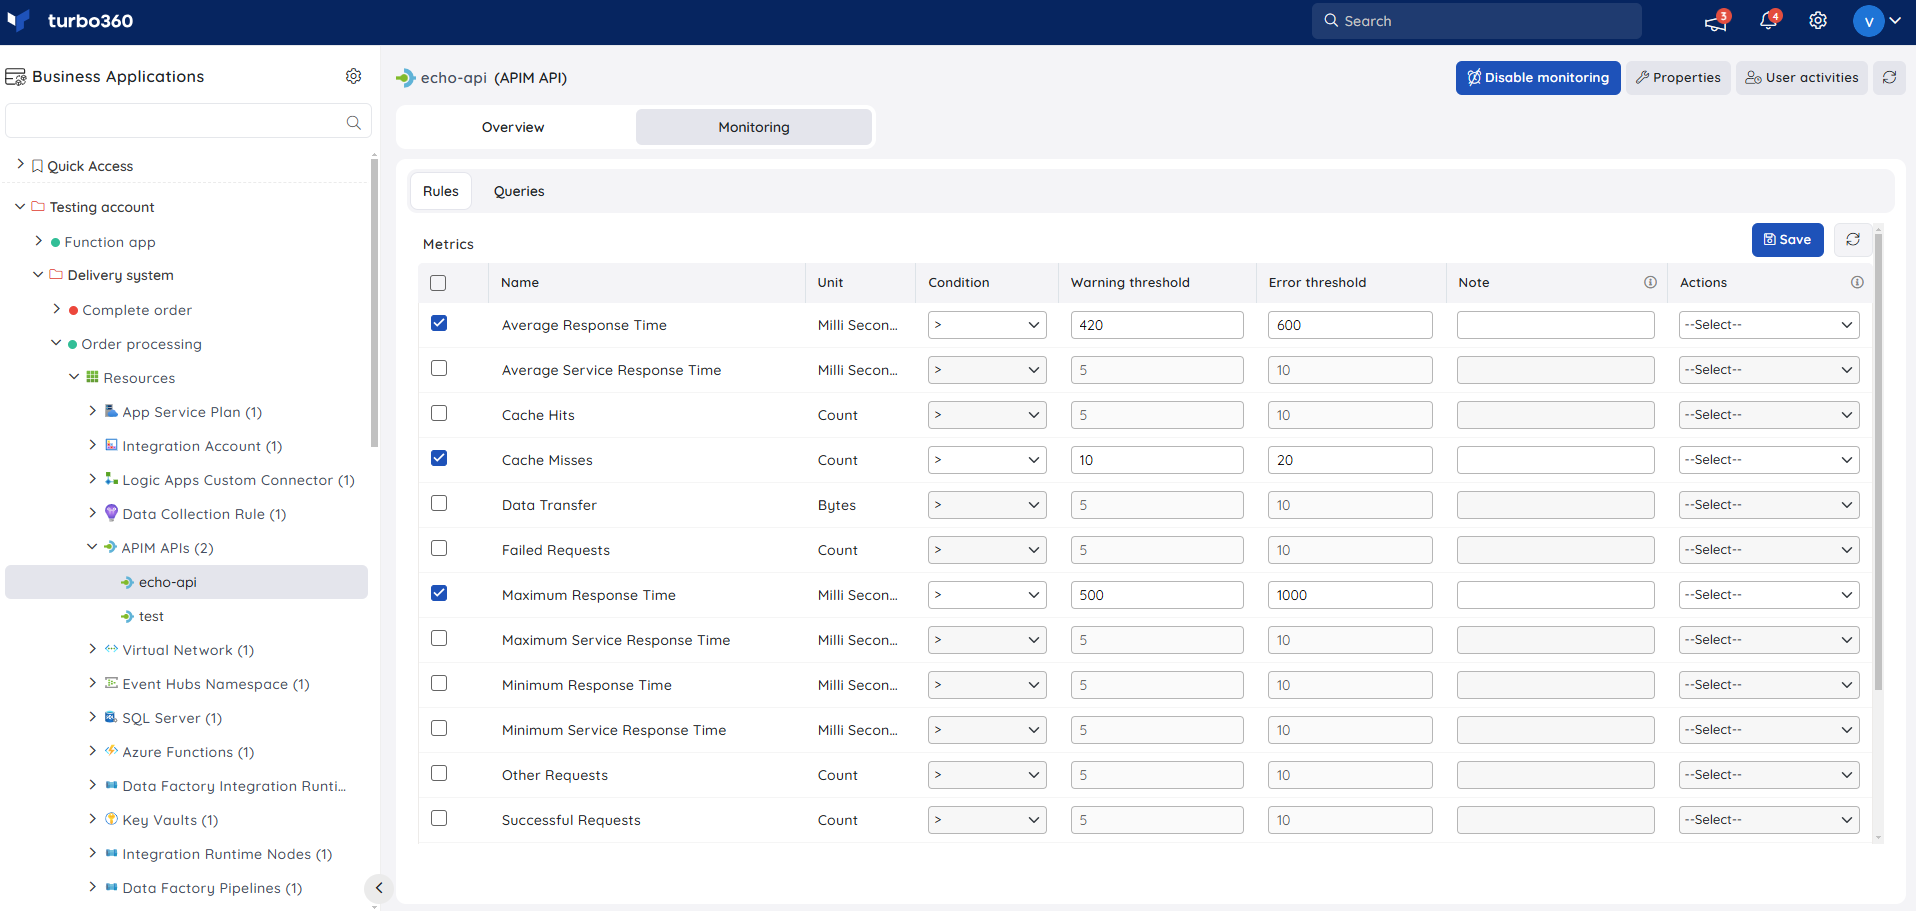
Monitoring rules will be saved for APIM API, and the monitoring state for the metrics will be reflected after every monitoring cycle.
Query monitoring
- Switch to the Queries tab to configure rules for query monitoring
- Click Add
- Enter a name to the query rule
- Choose any application insight resource to fetch query data
- You can enter the desired query by choosing Enter query (or) select one from the list of saved queries by choosing Open from saved queries
- Select the preferred time range
- Click Execute to run the query
- Select the required query columns and configure the threshold values
- Click Save
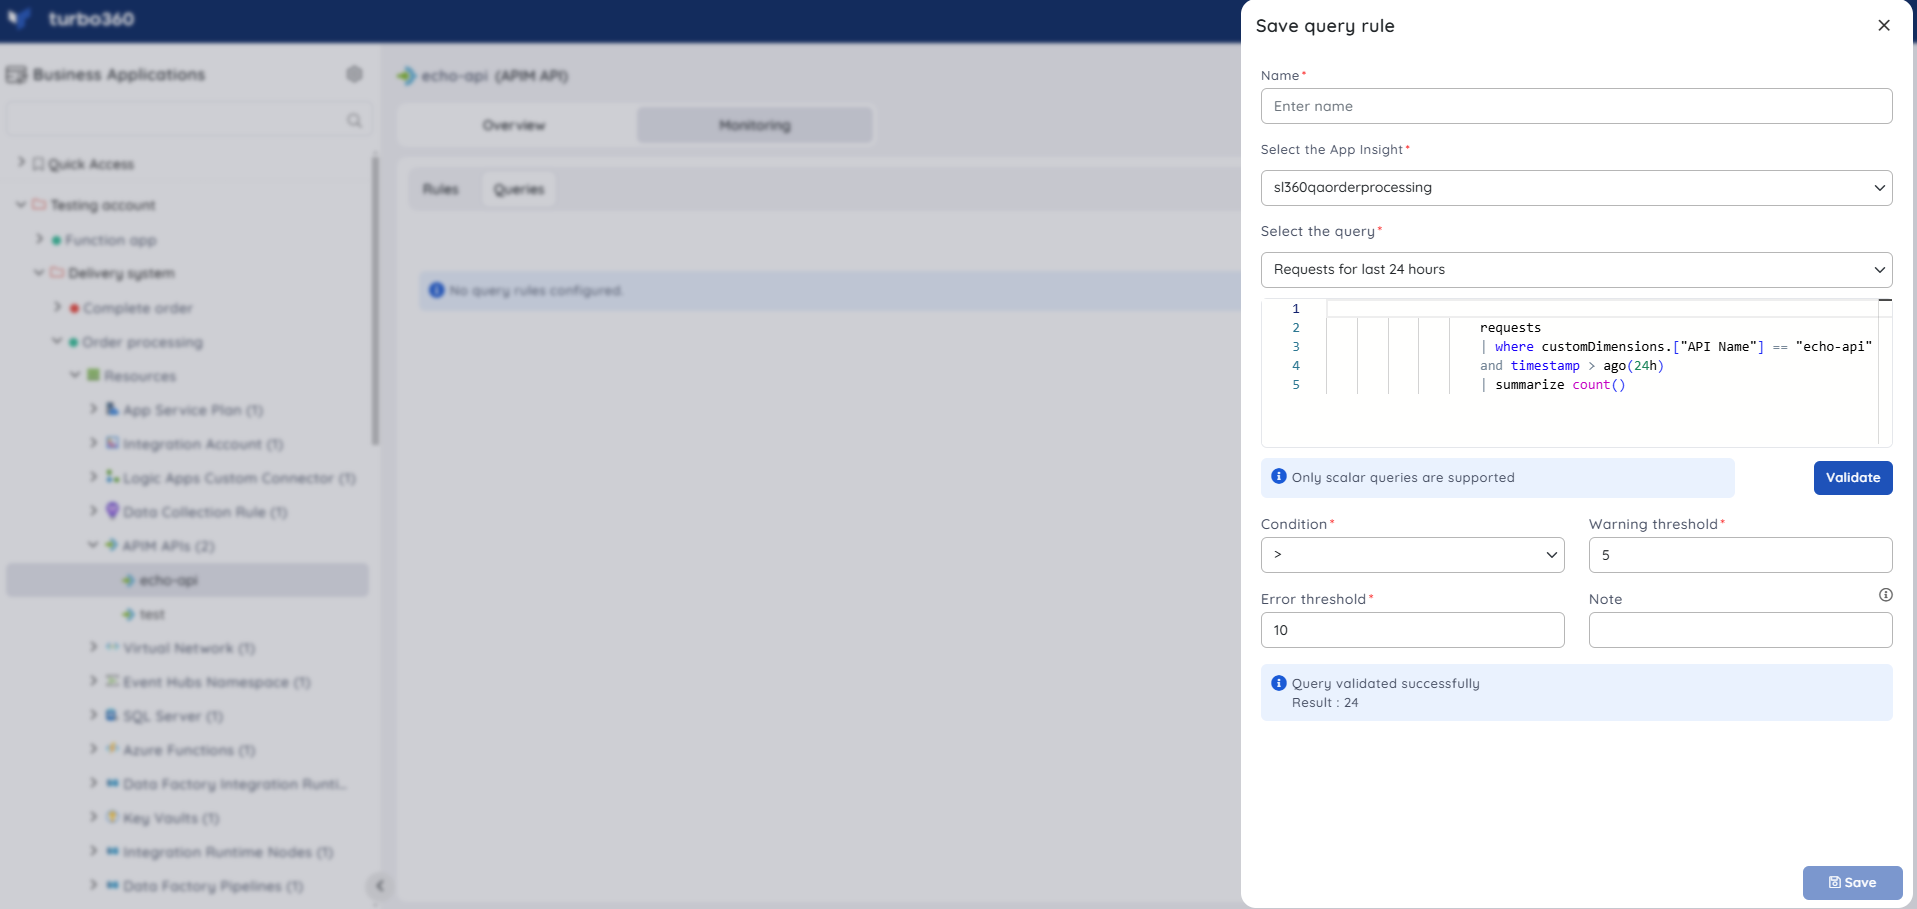
Query monitoring will be initiated once the rules are saved, and the query monitoring state will be reflected after every monitoring cycle.
APIM Operation
API operations correspond to the operations carried out by the back-end service.
API Management operations are highly customizable, allowing for control over URL mapping, query, and path parameters, request and response content, and operation response caching.
Policies for rate limits, quotas, and IP restrictions can also be implemented at the API or individual operation level.
Resource Dashboard
A default resource dashboard is available for APIM Operation resources in the Overview section, allowing for enhanced data visualization and tracking of real-time data.
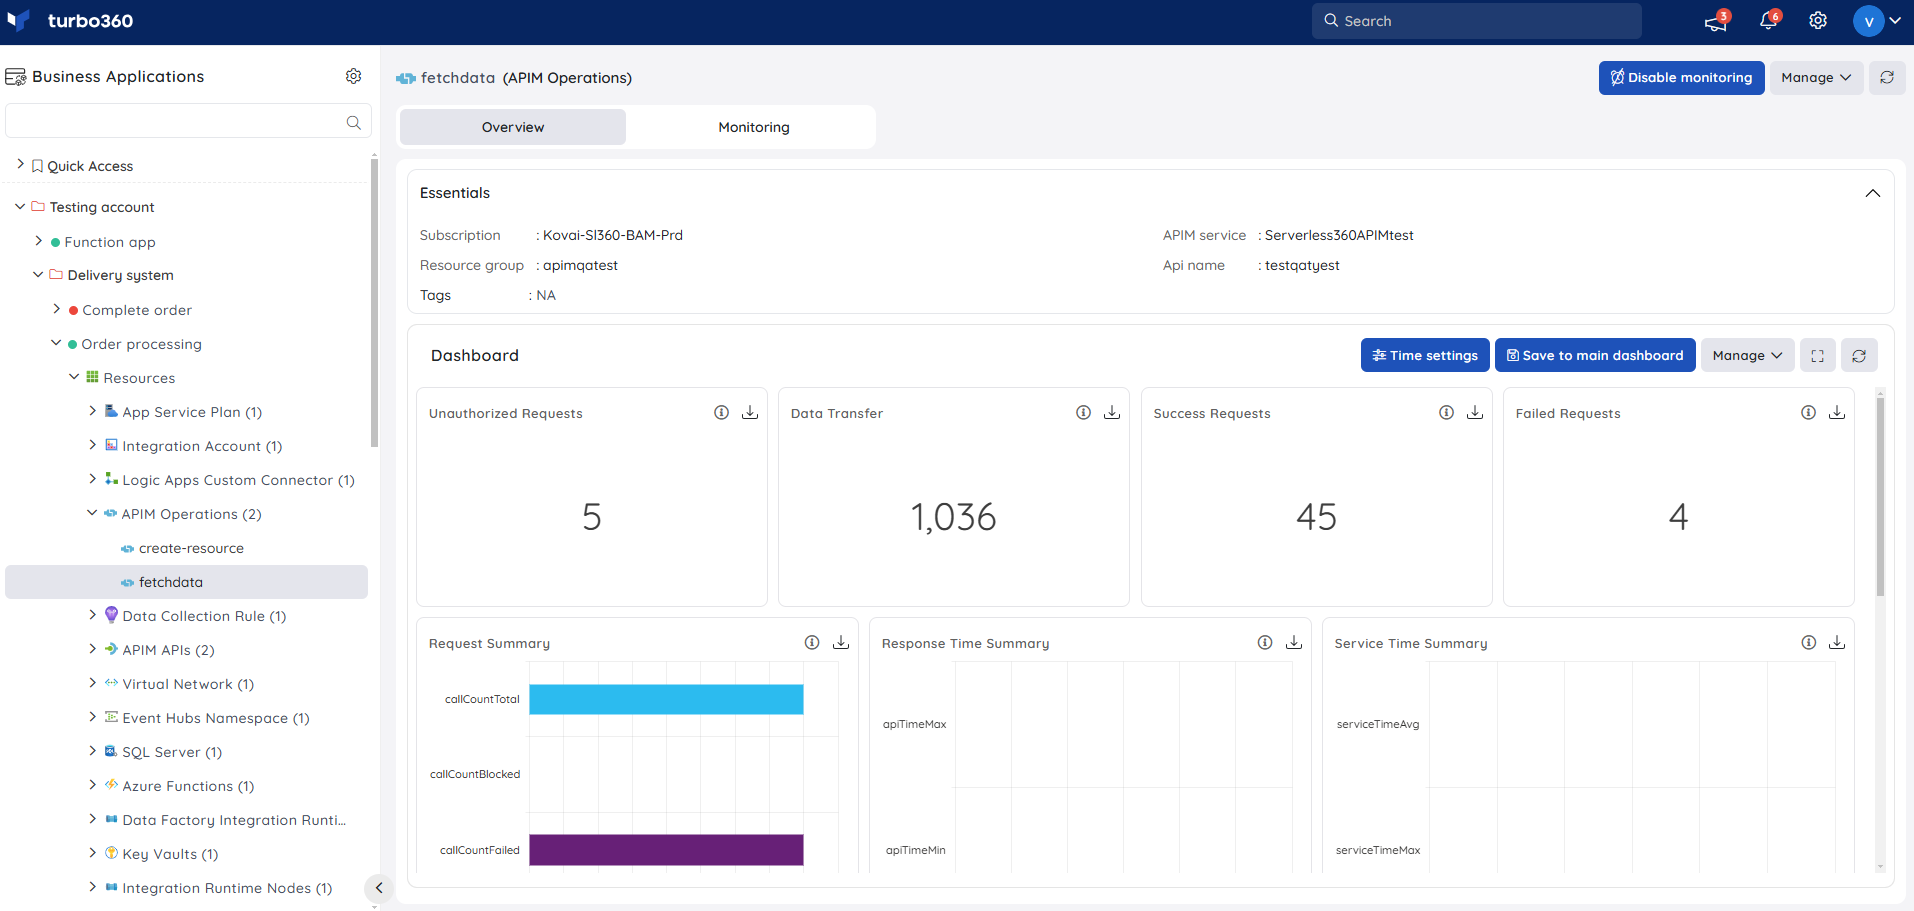
The following widgets are available by default to give users an idea of the resource dashboard:
1. Unauthorized Requests
2. Data Transfer
3. Success Requests
4. Failed Requests
5. Request Summary
6. Response Time Summary
7. Service Time Summary
8. Response Time Maximum vs Minimum
9. Cache Hit Vs Miss
10. Request Success Vs Failure
The data source for the dashboard widgets can be a query or metric data for chart types other than the Count chart. A set of default queries is available to create dashboard widgets using the associated application insight.
Any application insight resource can be used to generate query data that can be used for data visualization in the APIM Operation resource dashboard.
Monitoring
- Navigate to APIM Operation -> Monitoring to configure monitoring rules
- You can configure the monitoring metrics under the Rules tab and query rules under the Queries tab
Metric monitoring
- Switch to the Rules tab to configure rules for metric monitoring
- Select the necessary monitoring metrics and configure the threshold values
- Click Save
The threshold values can also be provided with any metric name, defining the monitoring rule to be violated when the metric value configured at threshold field is met.
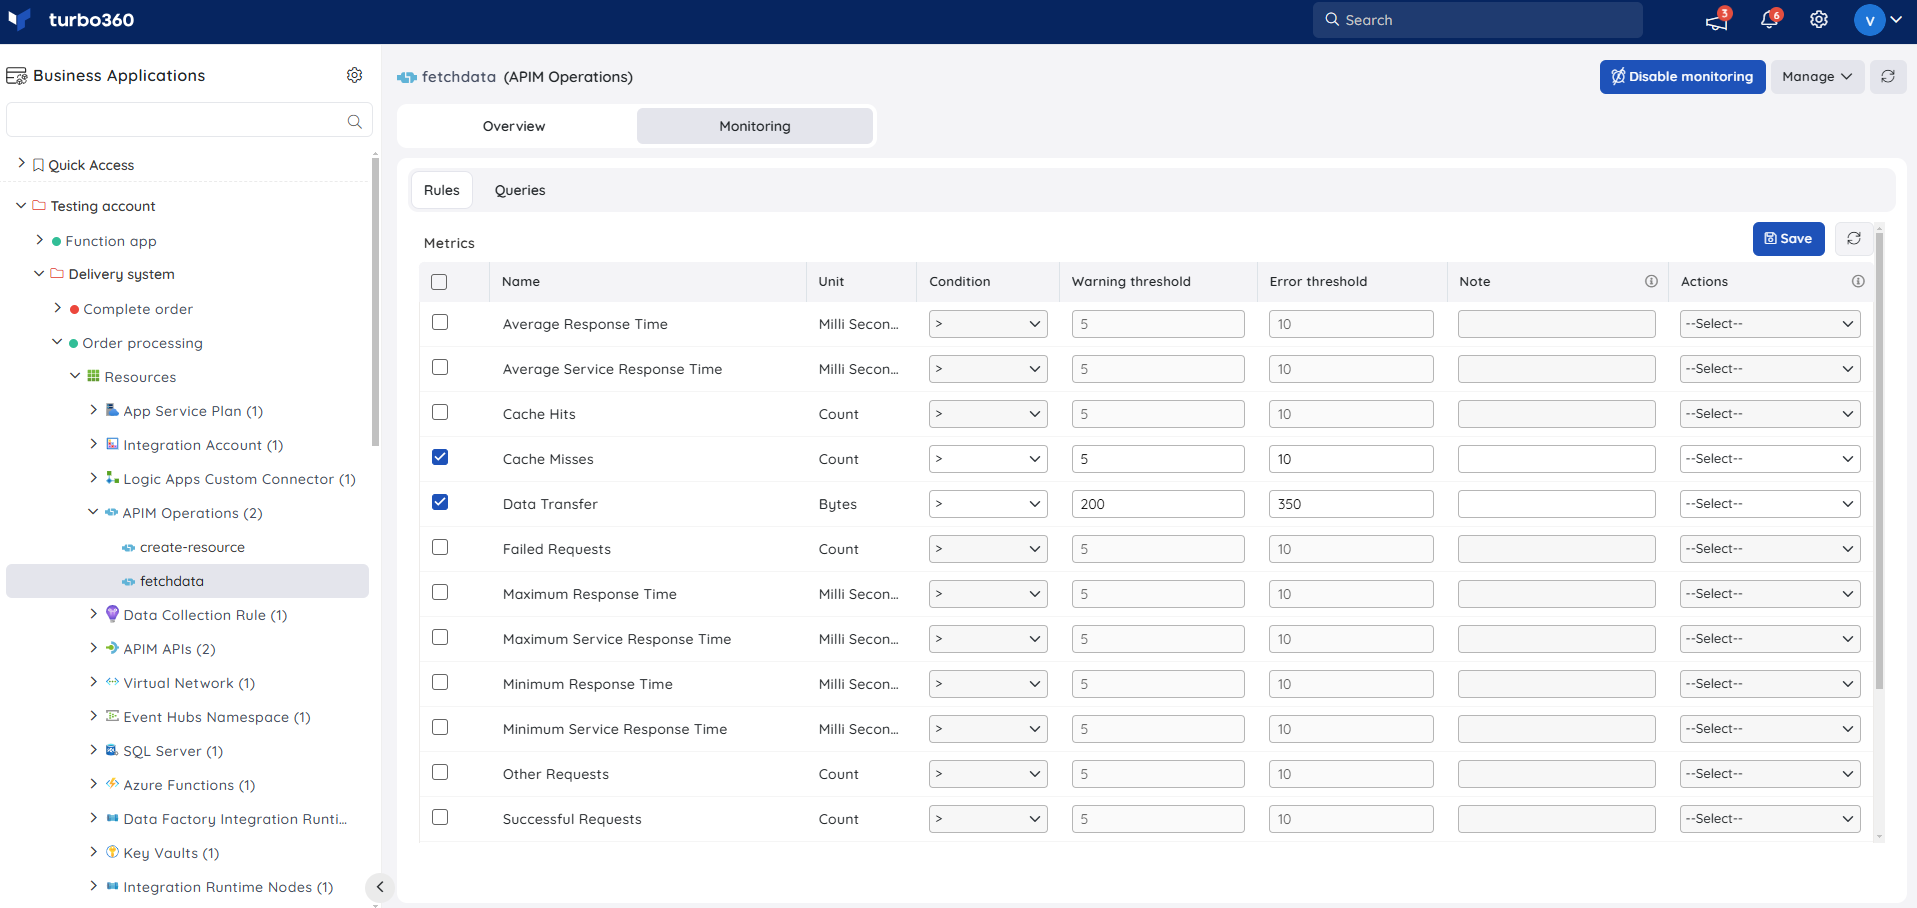
Monitoring rules will be saved for APIM Operation, and the monitoring state for the metrics will be reflected after every monitoring cycle.
Query monitoring
- Switch to the Queries tab to configure rules for query monitoring
- Click Add
- Enter a name to the query rule
- Choose any application insight resource to fetch query data
- You can enter the desired query by choosing Enter query (or) select one from the list of saved queries by choosing Open from saved queries
- Select the preferred time range
- Click Execute to run the query
- Select the required query columns and configure the threshold values
- Click Save
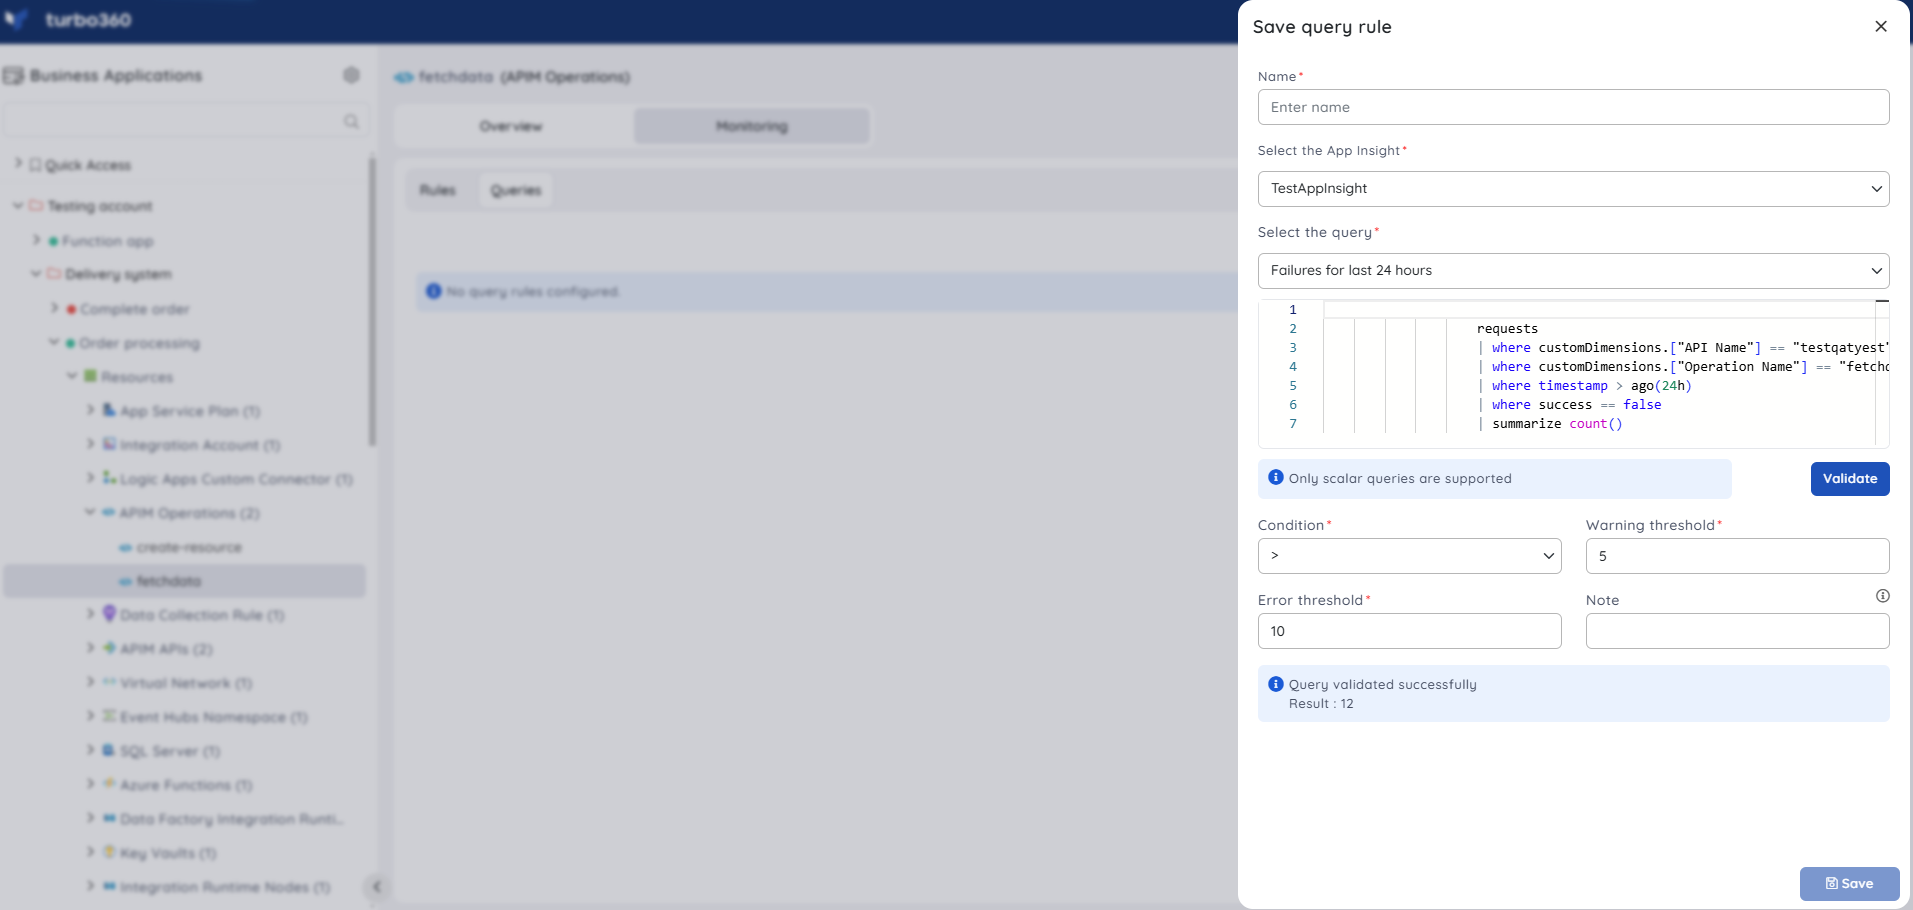
Query monitoring will be initiated once the rules are saved, and the query monitoring state will be reflected after every monitoring cycle.
APIM Product
APIs are exposed to developers through products. API Management products have one or more APIs and are labeled with a title, description, and terms of use.
Products can be either open or closed. Protected products require a subscription before they can be used, whereas open products can be used without one.
When a user subscribes, they receive a subscription key that can be used with any API in that product. Subscription approval is configured at the product level and can be either manual or automatic.
Operations
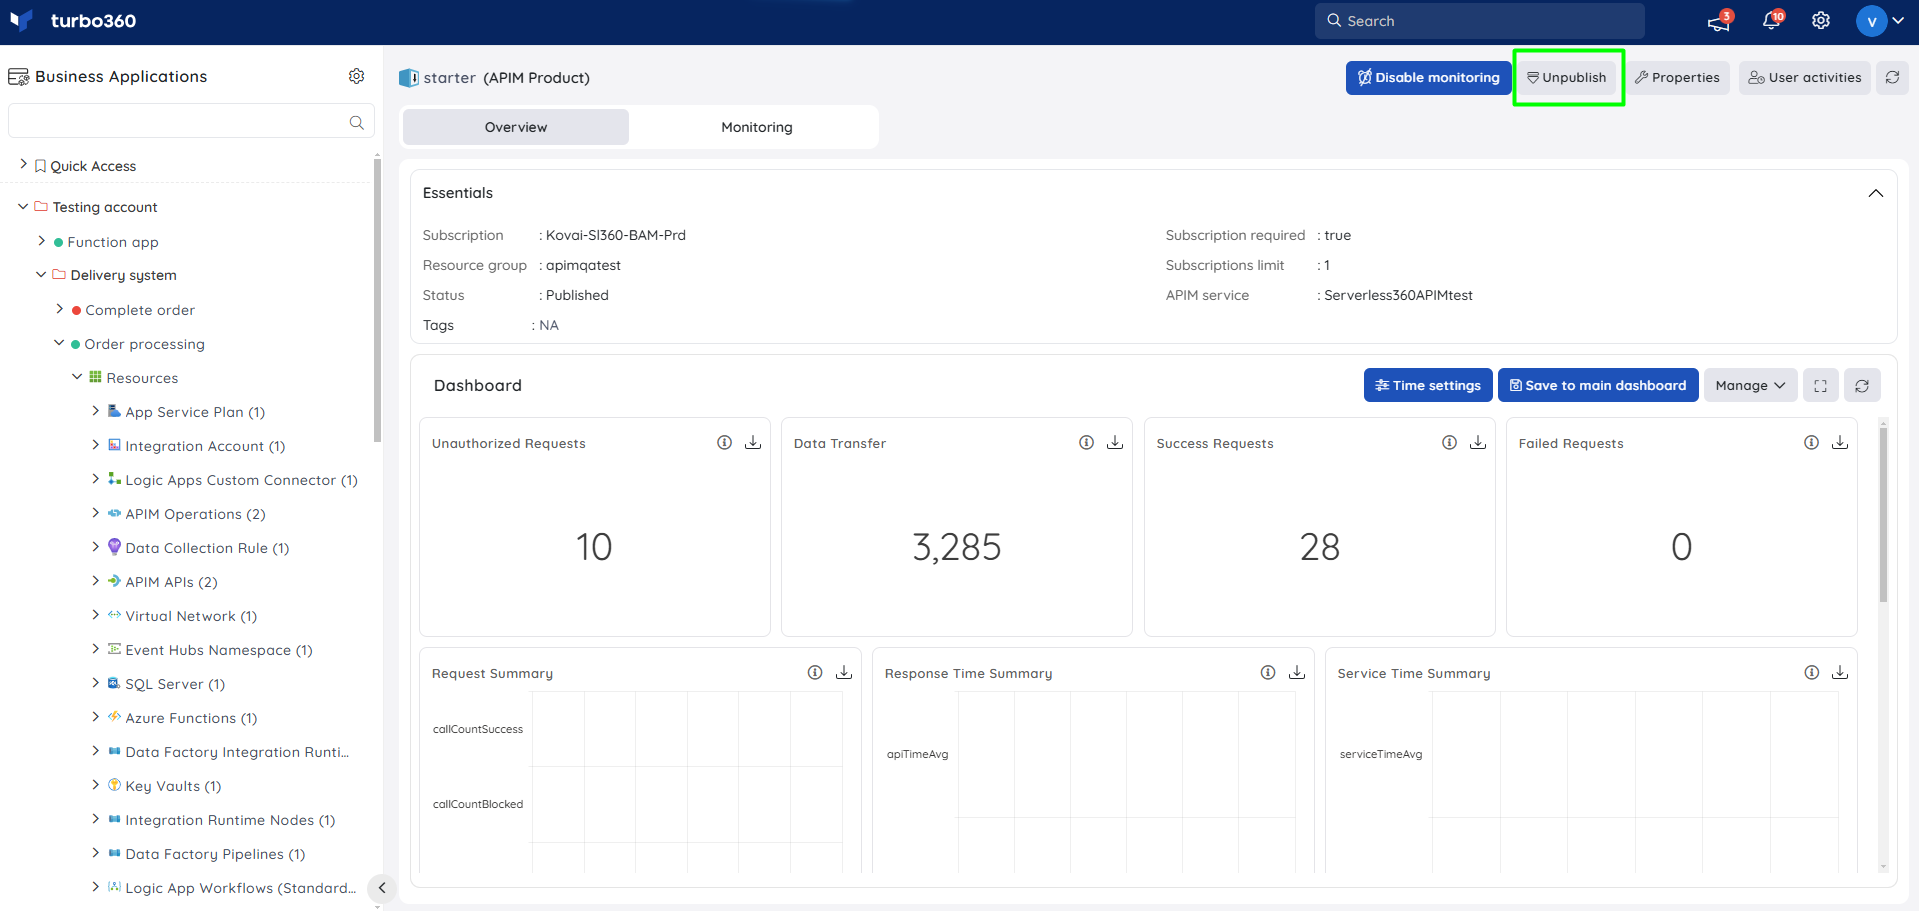
APIM Products can be published and unpublished by clicking the respective options within the resource.
Resource Dashboard
A default resource dashboard is available for APIM Product resources in the Overview section, allowing for enhanced data visualization and tracking of real-time data.
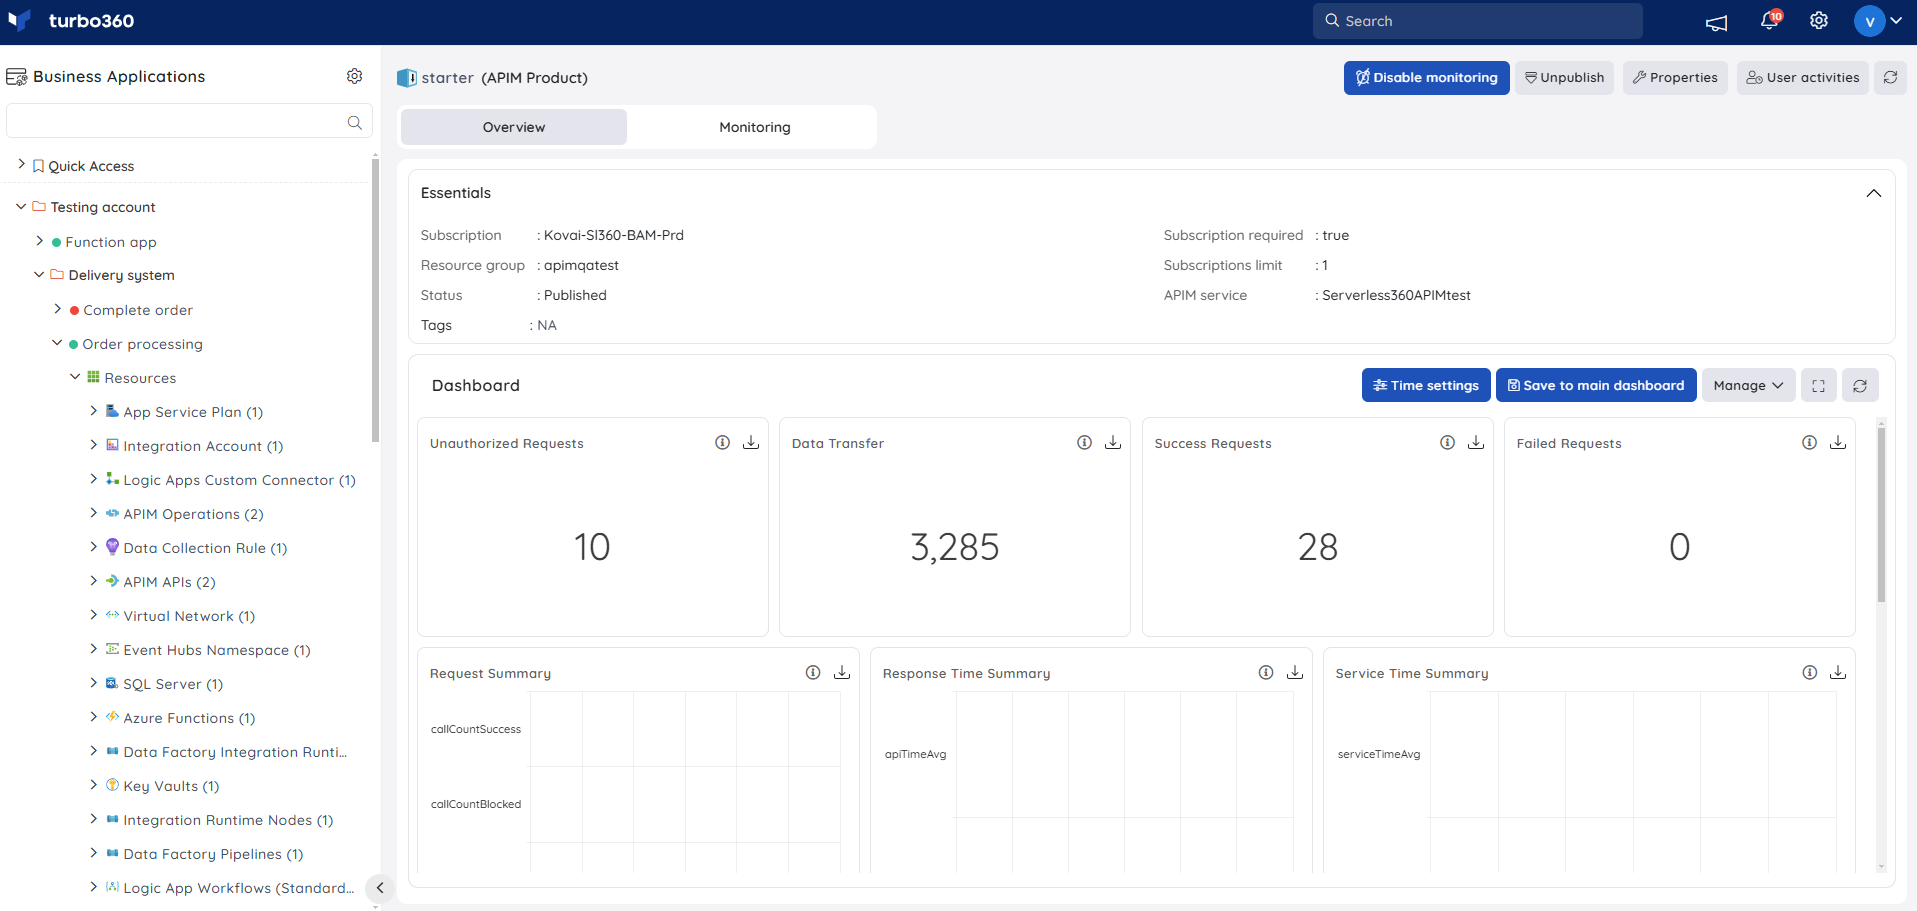
The following widgets are available by default to the resource dashboard:
1. Unauthorized Requests
2. Data Transfer
3. Success Requests
4. Failed Requests
5. Request Summary
6. Response Time Summary
7. Service Time Summary
8. Response Time Maximum vs Minimum
9. Cache Hit Vs Miss
10. Request Success Vs Failure
Monitoring
- Navigate to APIM Product -> Monitoring to configure the monitoring rules for API Products
- Select the necessary monitoring metrics and configure the threshold values
- Click Save
The threshold values can also be provided with any metric name, defining the monitoring rule to be violated when the metric value configured at threshold field is met.
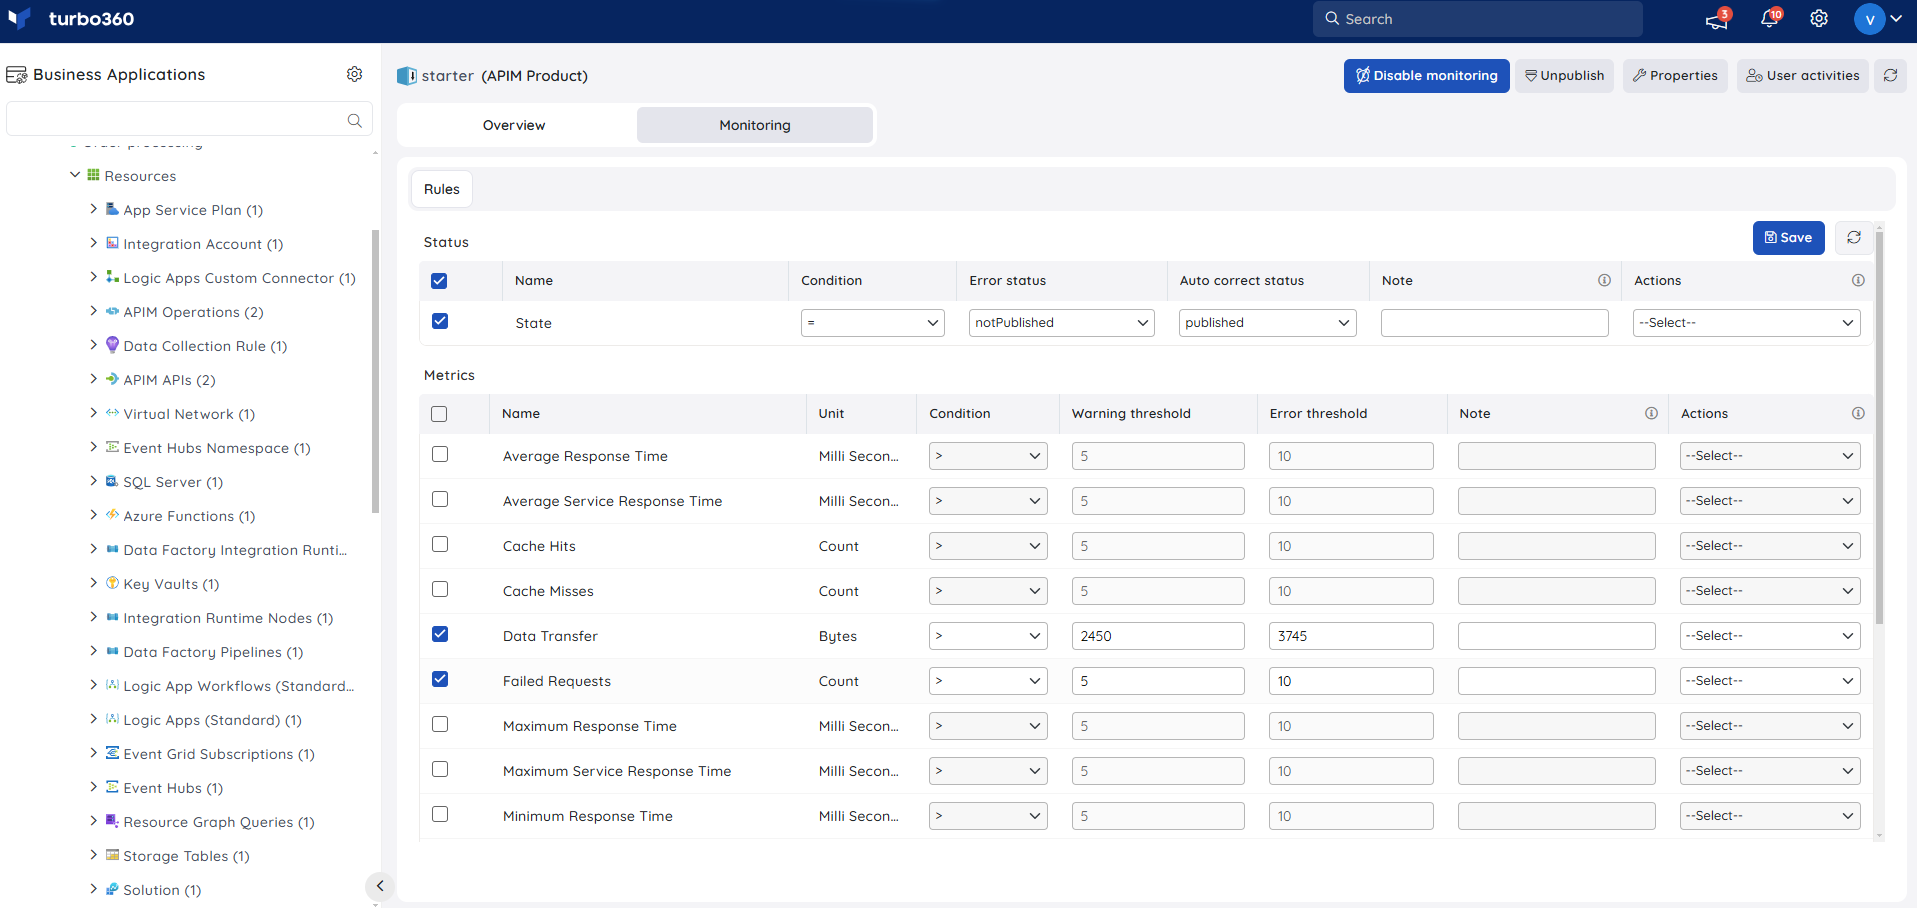
Monitoring rules will be saved for APIM Product, and the monitoring state for the metrics will be reflected after every monitoring cycle.
APIM Service
APIM Service assists organizations in publishing APIs to external, partner, and internal developers to maximize the value of their data and services.
Resource Dashboard
Users can create unique dashboard widgets to perform data visualization by using the APIM Service resource metrics or app insights queries.
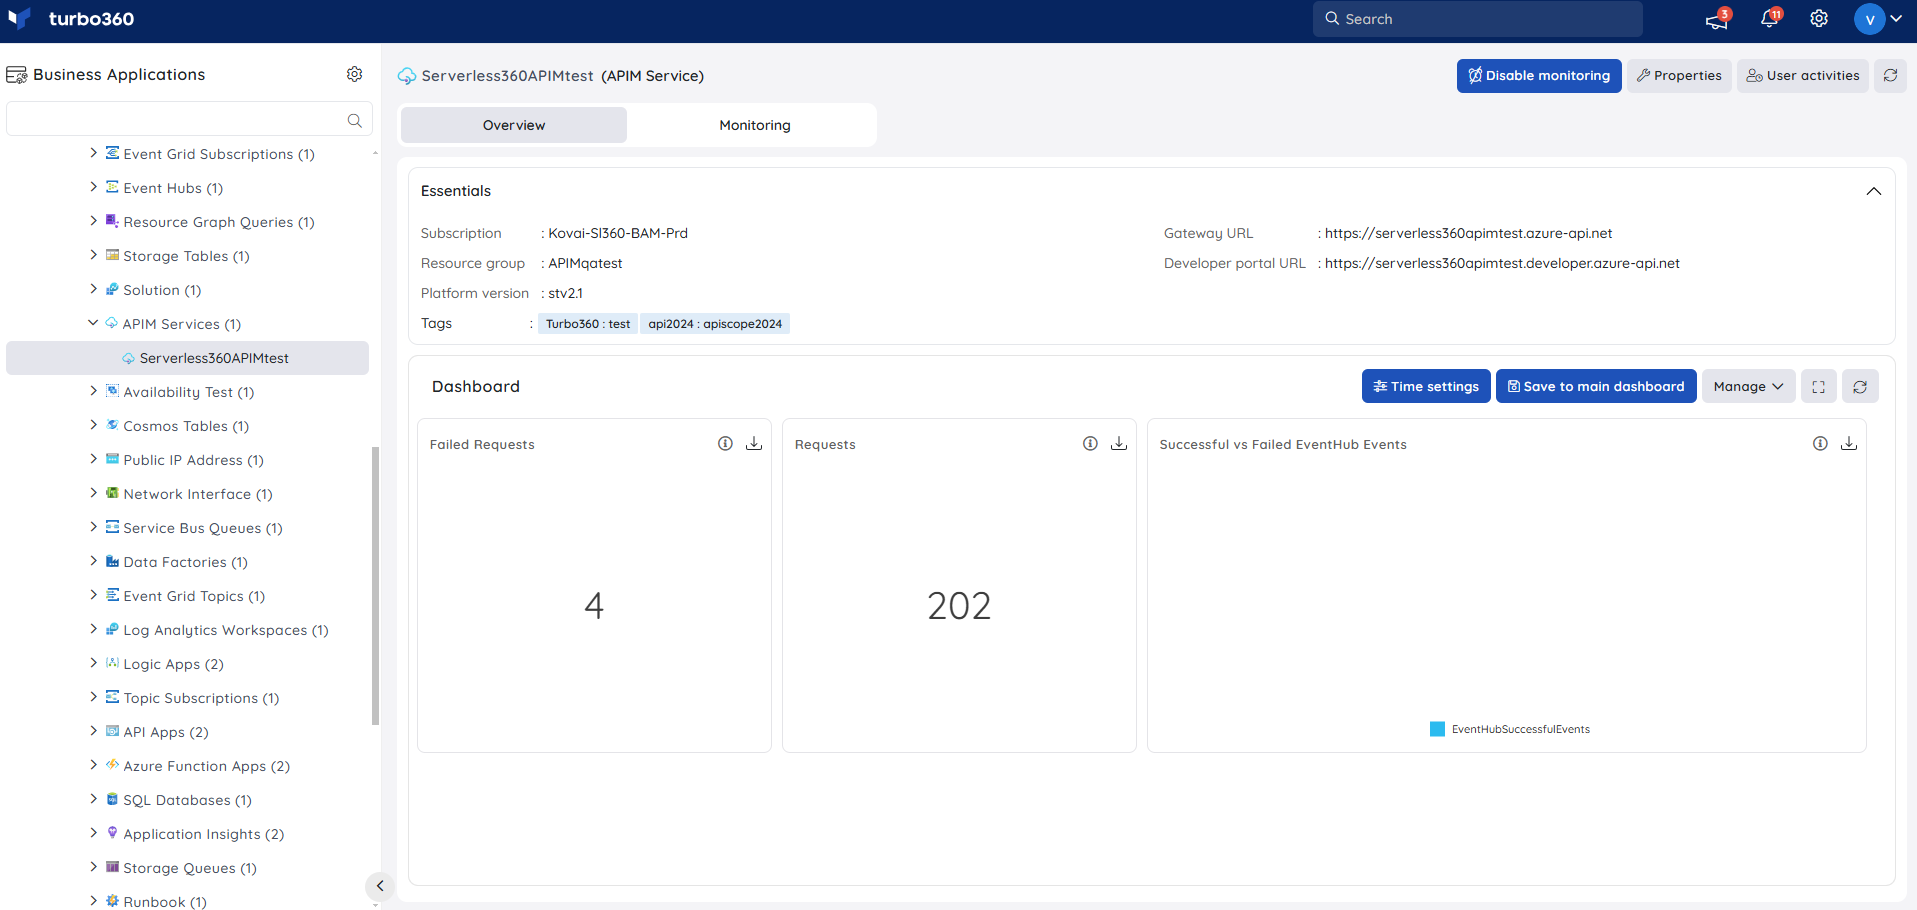
Users are provided with an in-built Dashboard for APIM Services with the following widgets:
1. Failed Requests
2. Requests
3. Successful vs Failed EventHub Events
- Any application insight resource can be used to generate query data that can be used for data visualization of the APIM Service.
Monitoring
- Navigate to APIM Service -> Monitoring to configure monitoring rules
- You can configure the monitoring metrics under the Rules tab and query rules under the Queries tab
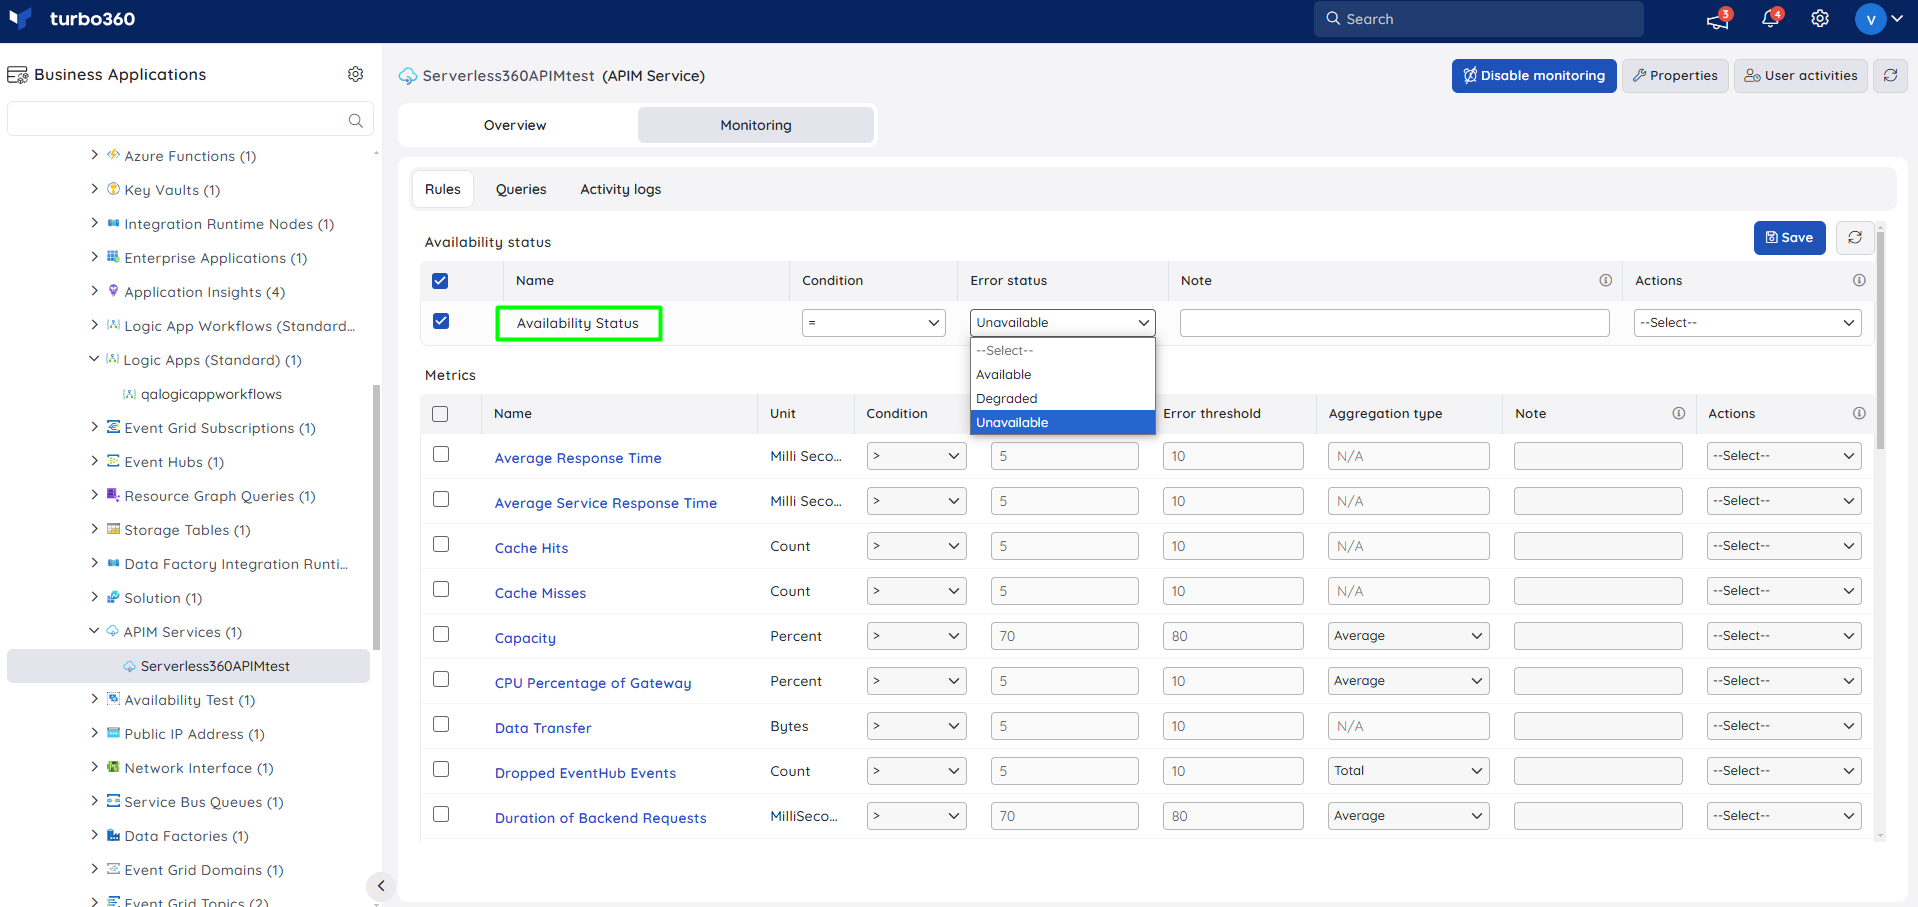
Availibility status monitoring
The resource health status can be monitored for APIM Service by using the Availability status rule.
- Configure Availability status rule with the desired threshold
- Click Save
Metric monitoring
- Switch to the Rules tab to configure rules for metric monitoring.
- Select the necessary monitoring metrics and configure the threshold values.
- Click Save.
The threshold values can also be provided with any metric name, defining the monitoring rule to be violated when the metric value configured at threshold field is met.
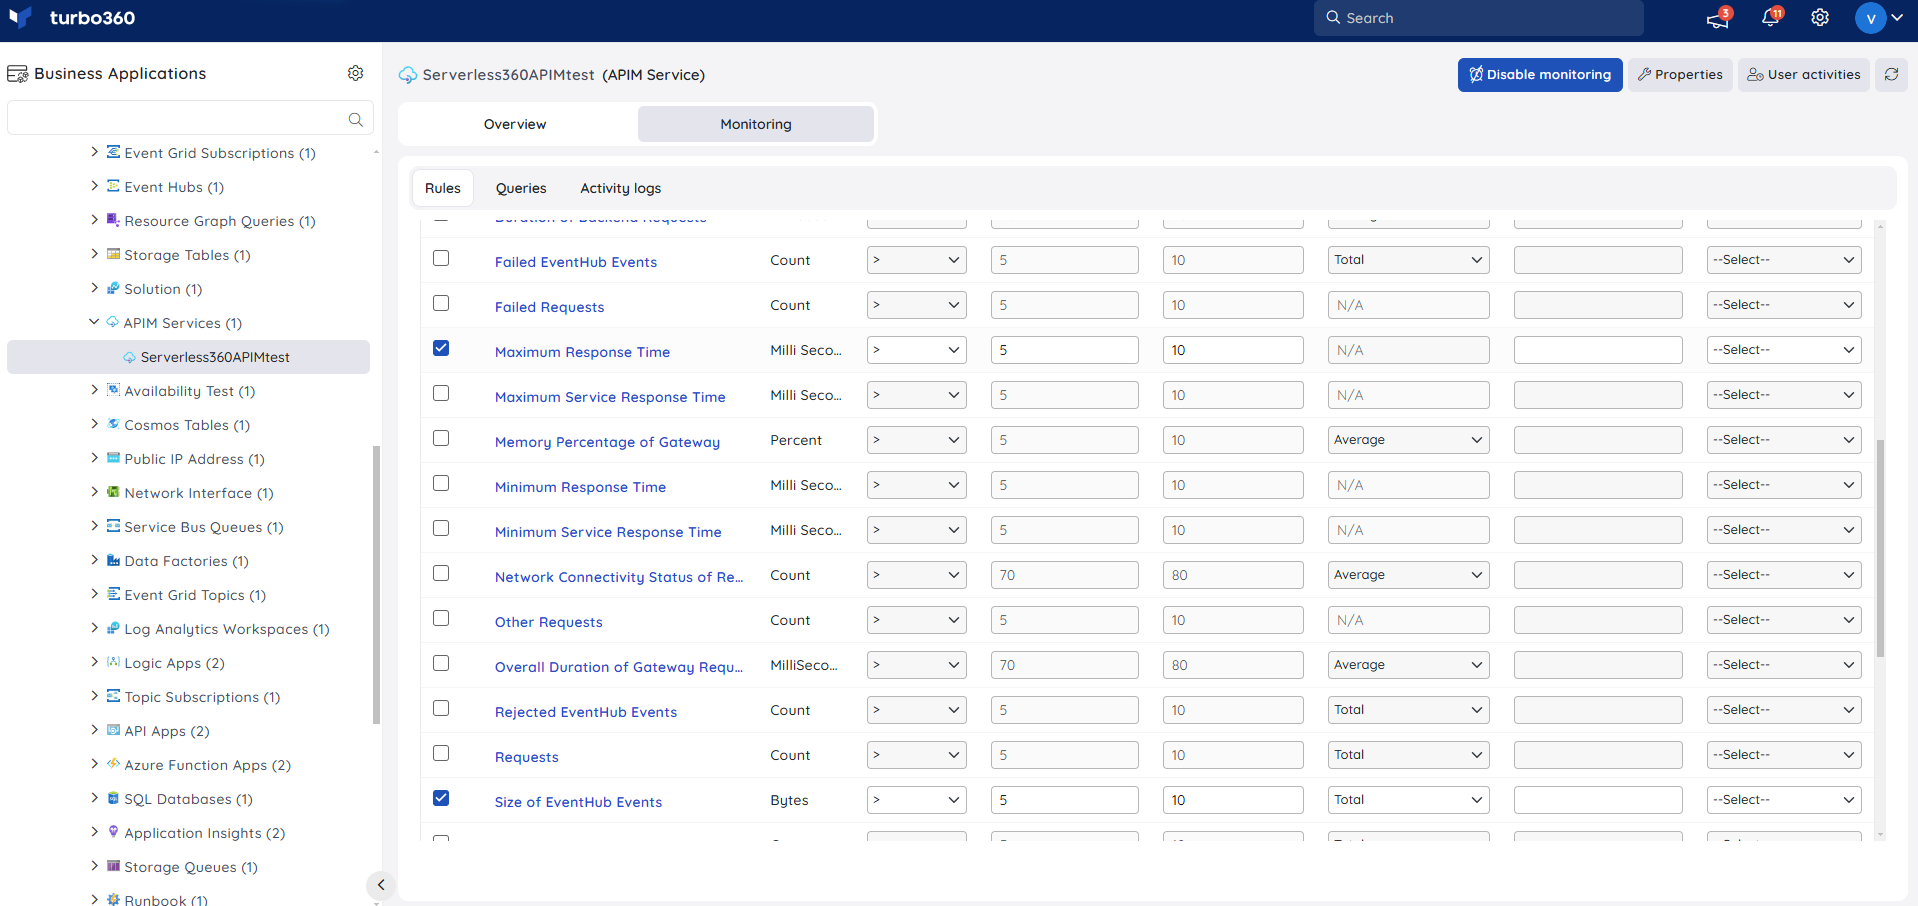
Monitoring rules will be saved for APIM Service, and the monitoring state for the metrics will be reflected after every monitoring cycle.
Query monitoring
- Switch to the Queries tab to configure rules for query monitoring.
- Click Add.
- Enter a name to the query rule.
- Choose any application insight resource to fetch query data
- You can enter the desired query by choosing Enter query (or) select one from the list of saved queries by choosing Open from saved queries.
- Select the preferred time range.
- Click Execute to run the query.
- Select the required query columns and configure the threshold values.
- Click Save.
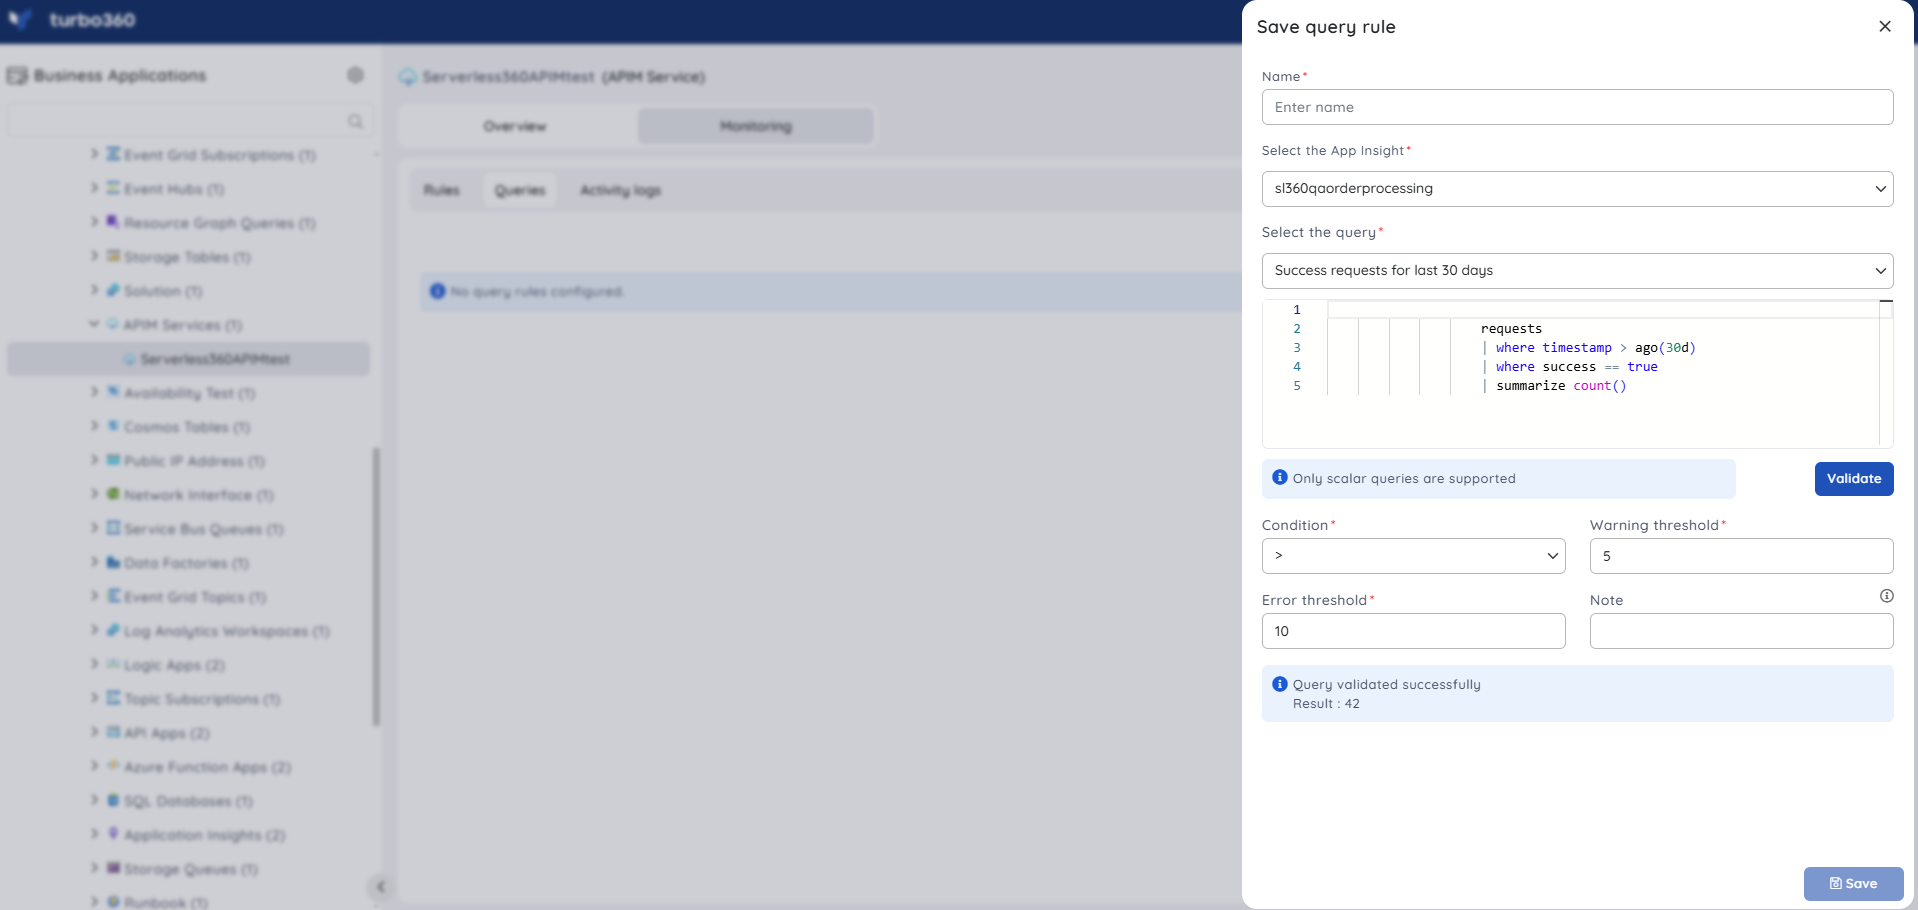
Query monitoring will be initiated once the rules are saved, and the query monitoring state will be reflected after every monitoring cycle.

