- 19 Nov 2024
- 3 Minutes to read
- Print
- DarkLight
- PDF
App Service Plan
- Updated on 19 Nov 2024
- 3 Minutes to read
- Print
- DarkLight
- PDF
Introduction
Azure App Service Plan is a PaaS resource which hosts resources like Web Apps, Function Apps and Logic Apps.
In Turbo360, you can add your app service plan to your Business Application. App Service plan is one of our generic resource types which support monitoring features and dashboards based around the metrics API on Azure.
You can see below where an App Service Plan is added as part of my Order Processing Application.
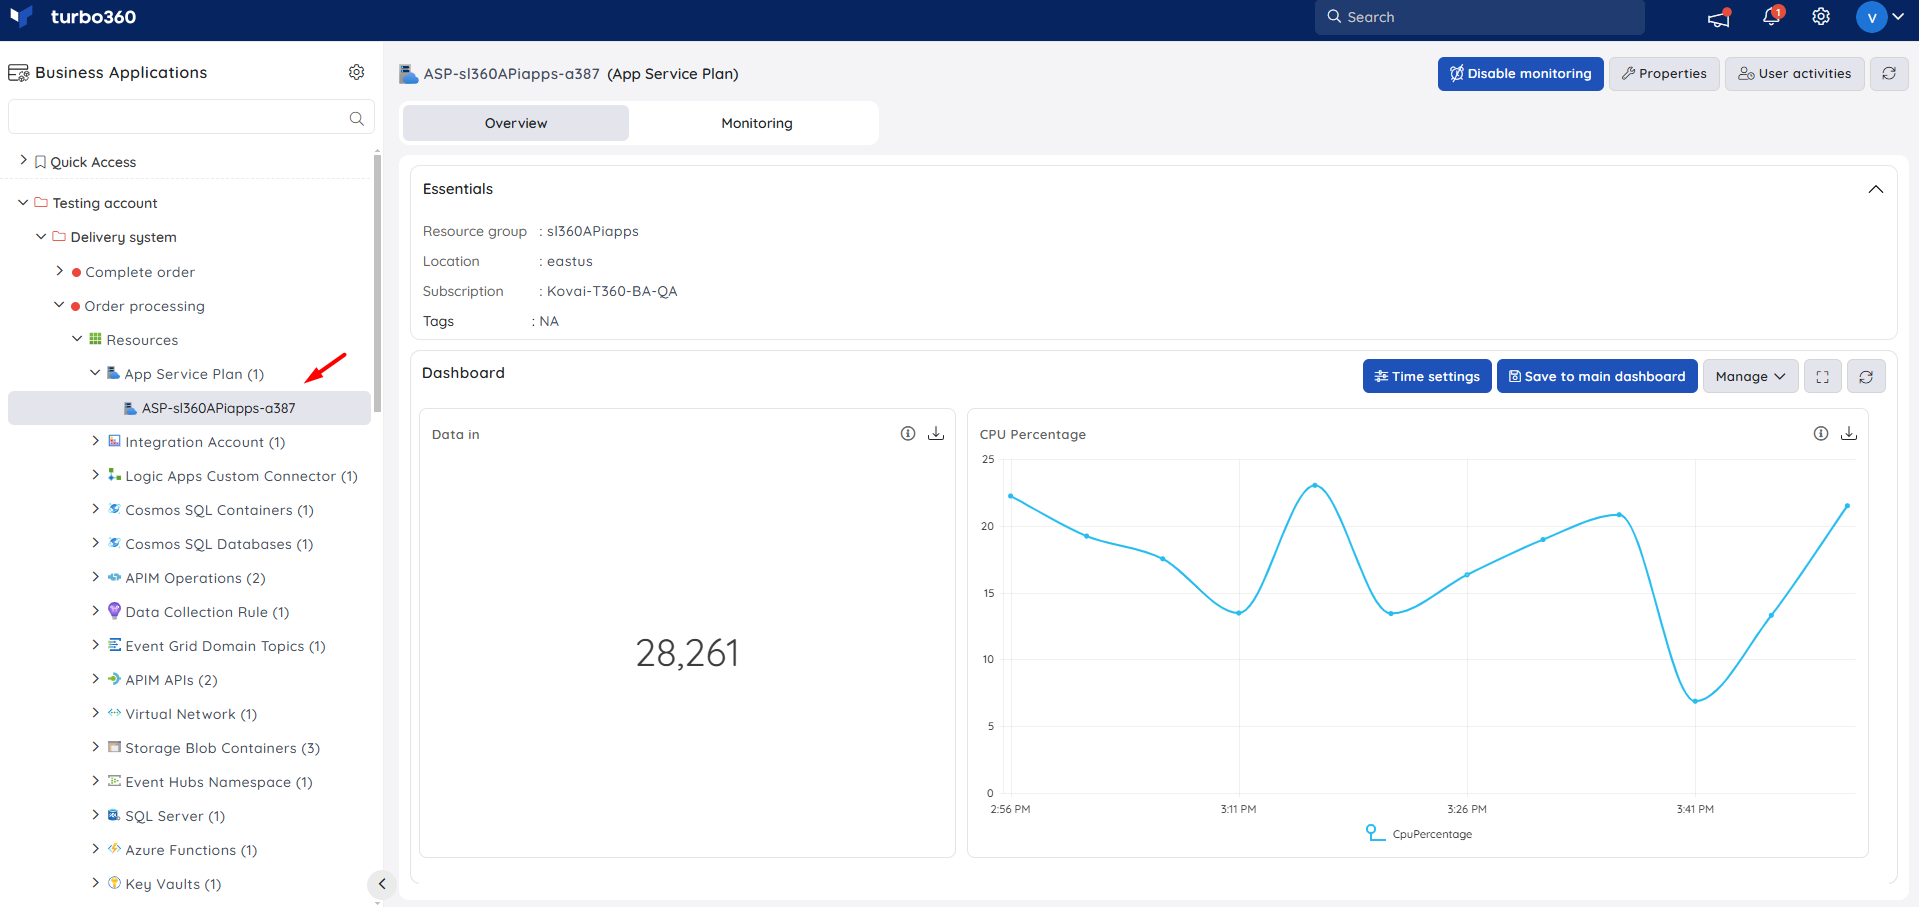
One of the things to note is that an App Service plan may be used to host multiple apps of different types so sometimes you might want to add the App Service plan to a Business App used for common resources or something you might want to add it to one for a specific application. This is where you can model what makes sense for your support view.
Resource dashboard
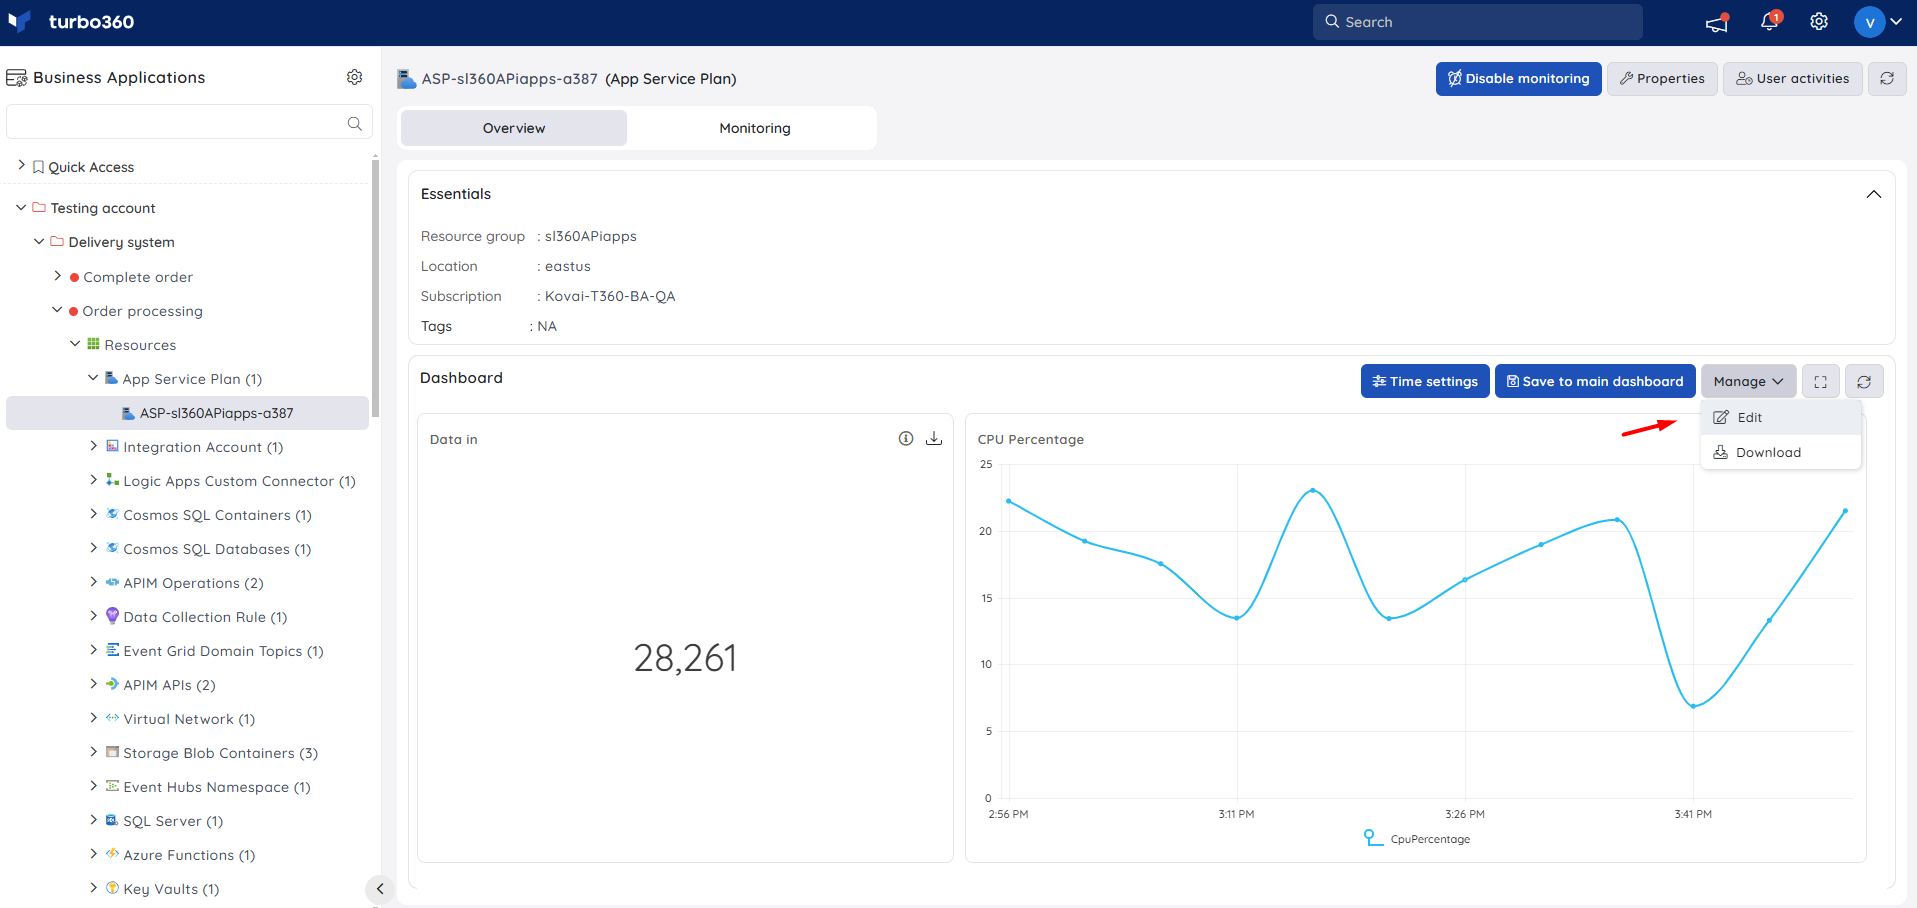
The dashboards feature lets you add the custom dashboards you want to see for your specific scenario.
Below I am using CPU and Data In based dashboards that I want the support operator to be aware of.
Monitoring
Availability status monitoring
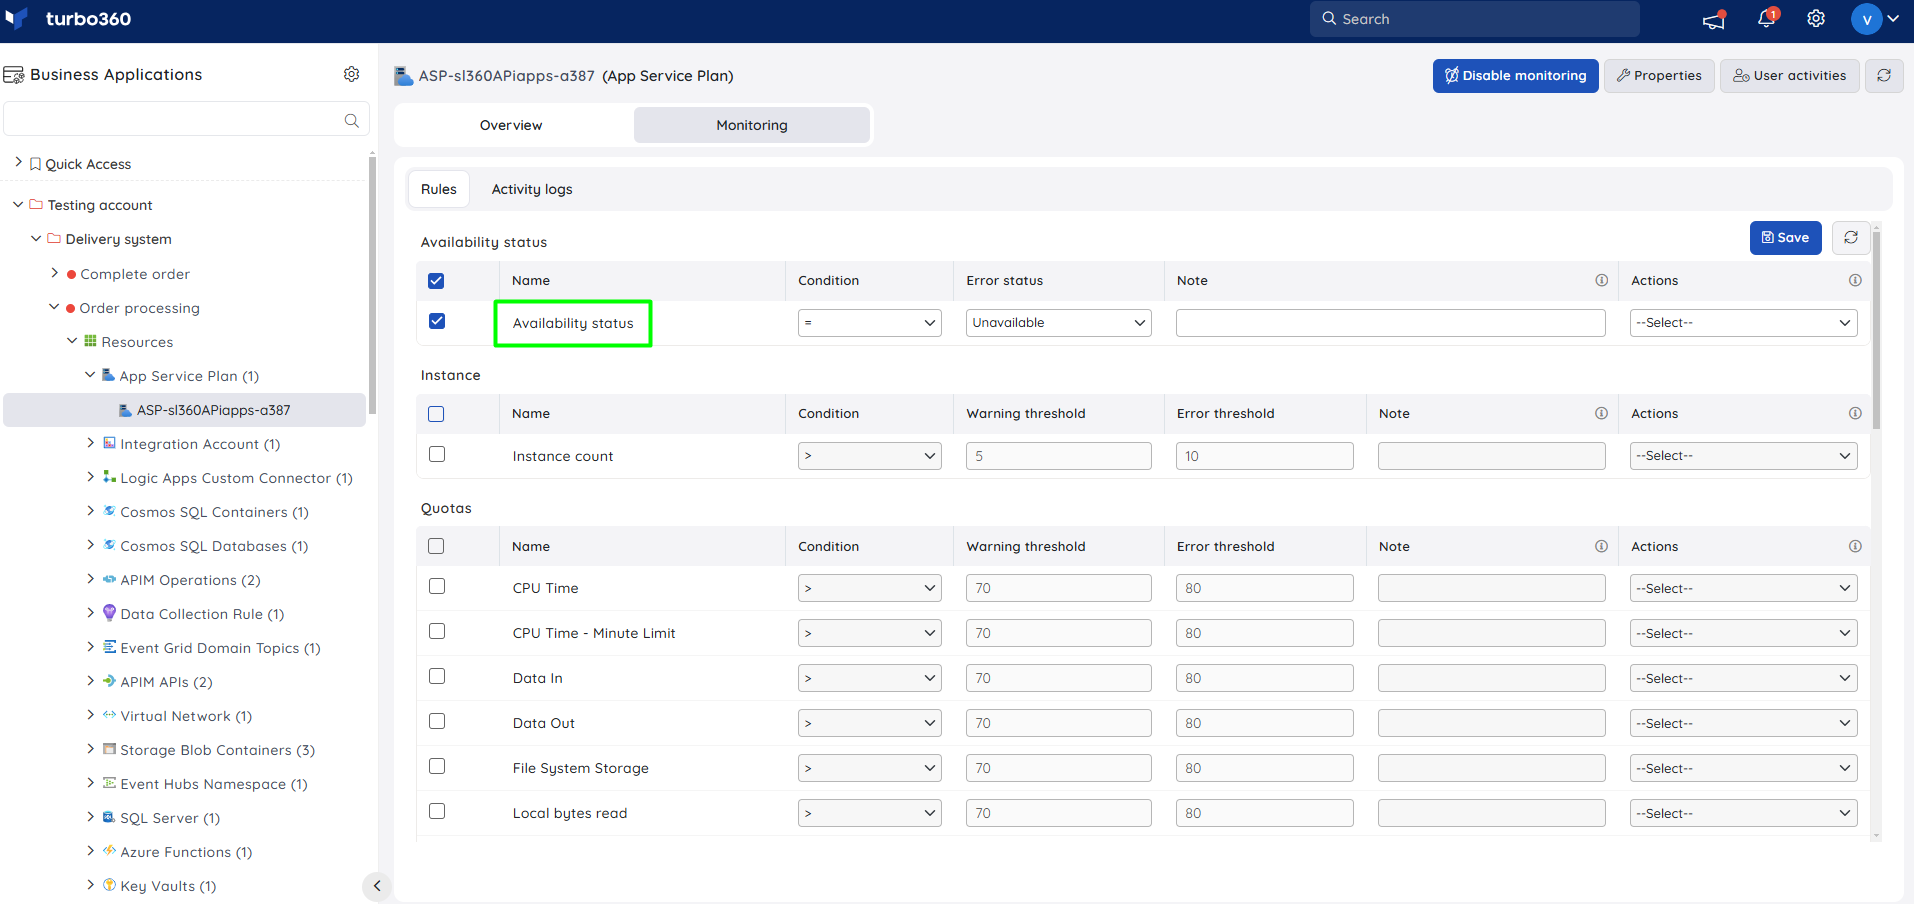
The resource health status can be monitored for App service plans by configuring the Availability status monitoring rule.
- Navigate to App service plan -> Monitoring
- Configure Availability status with the desired threshold
- Click Save
Instance monitoring
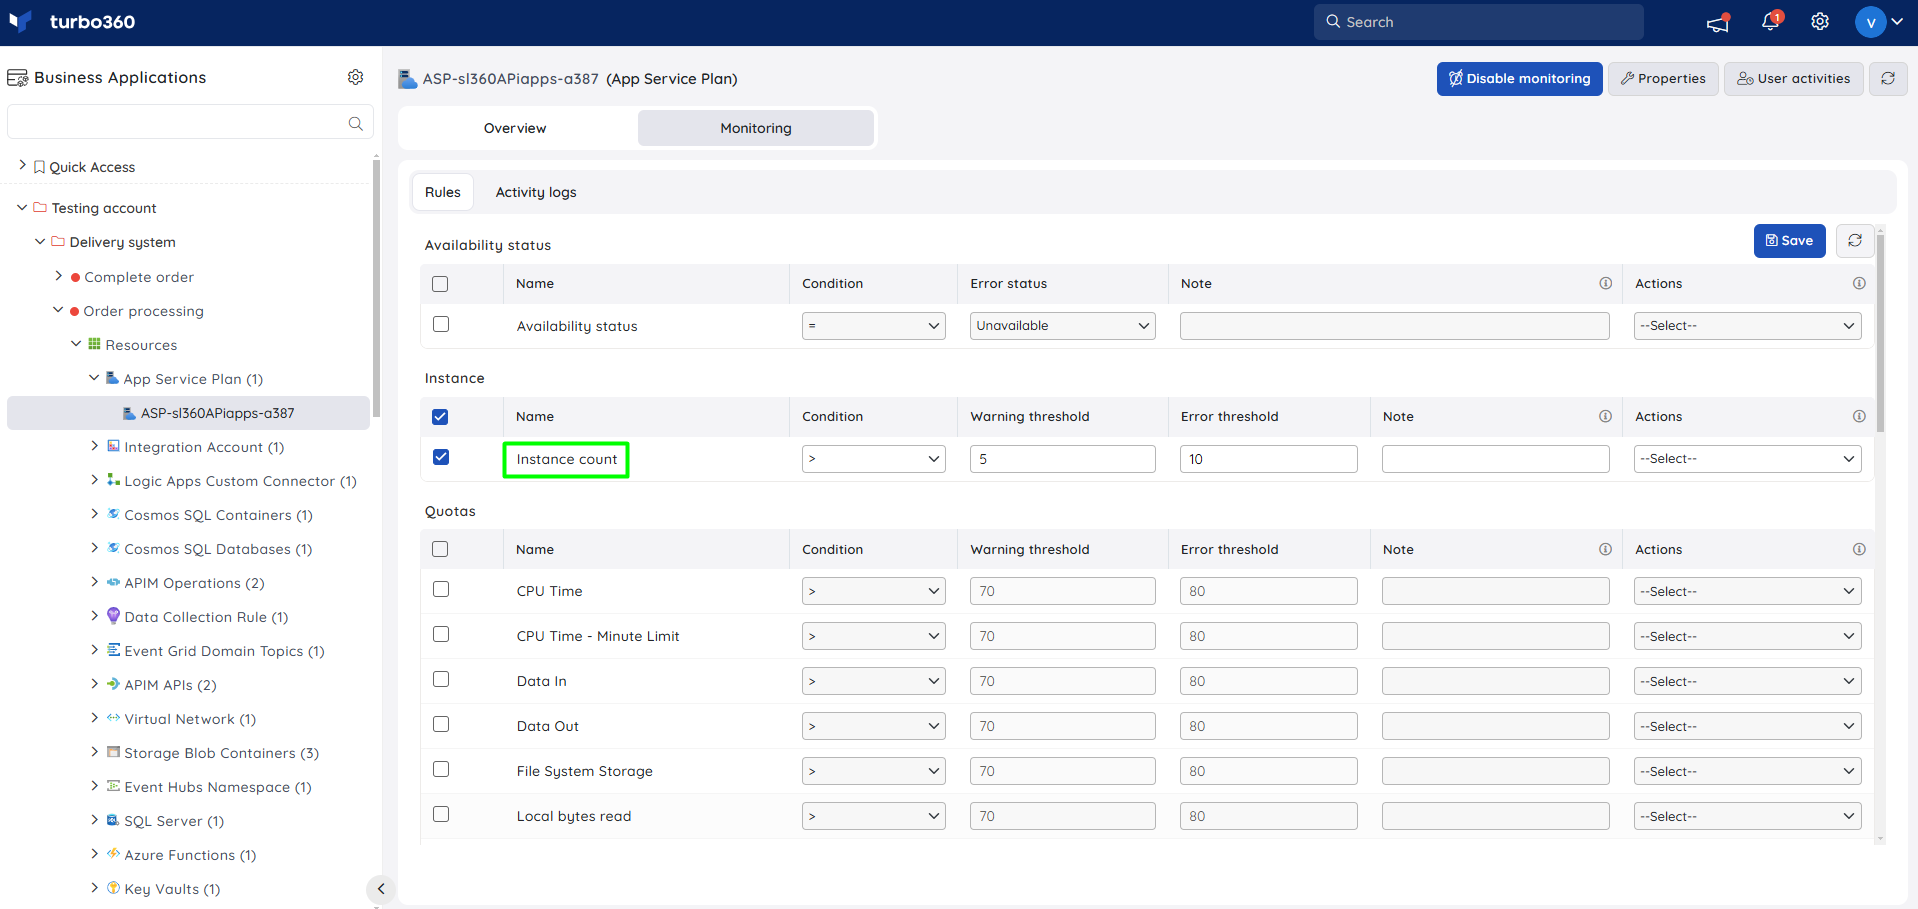
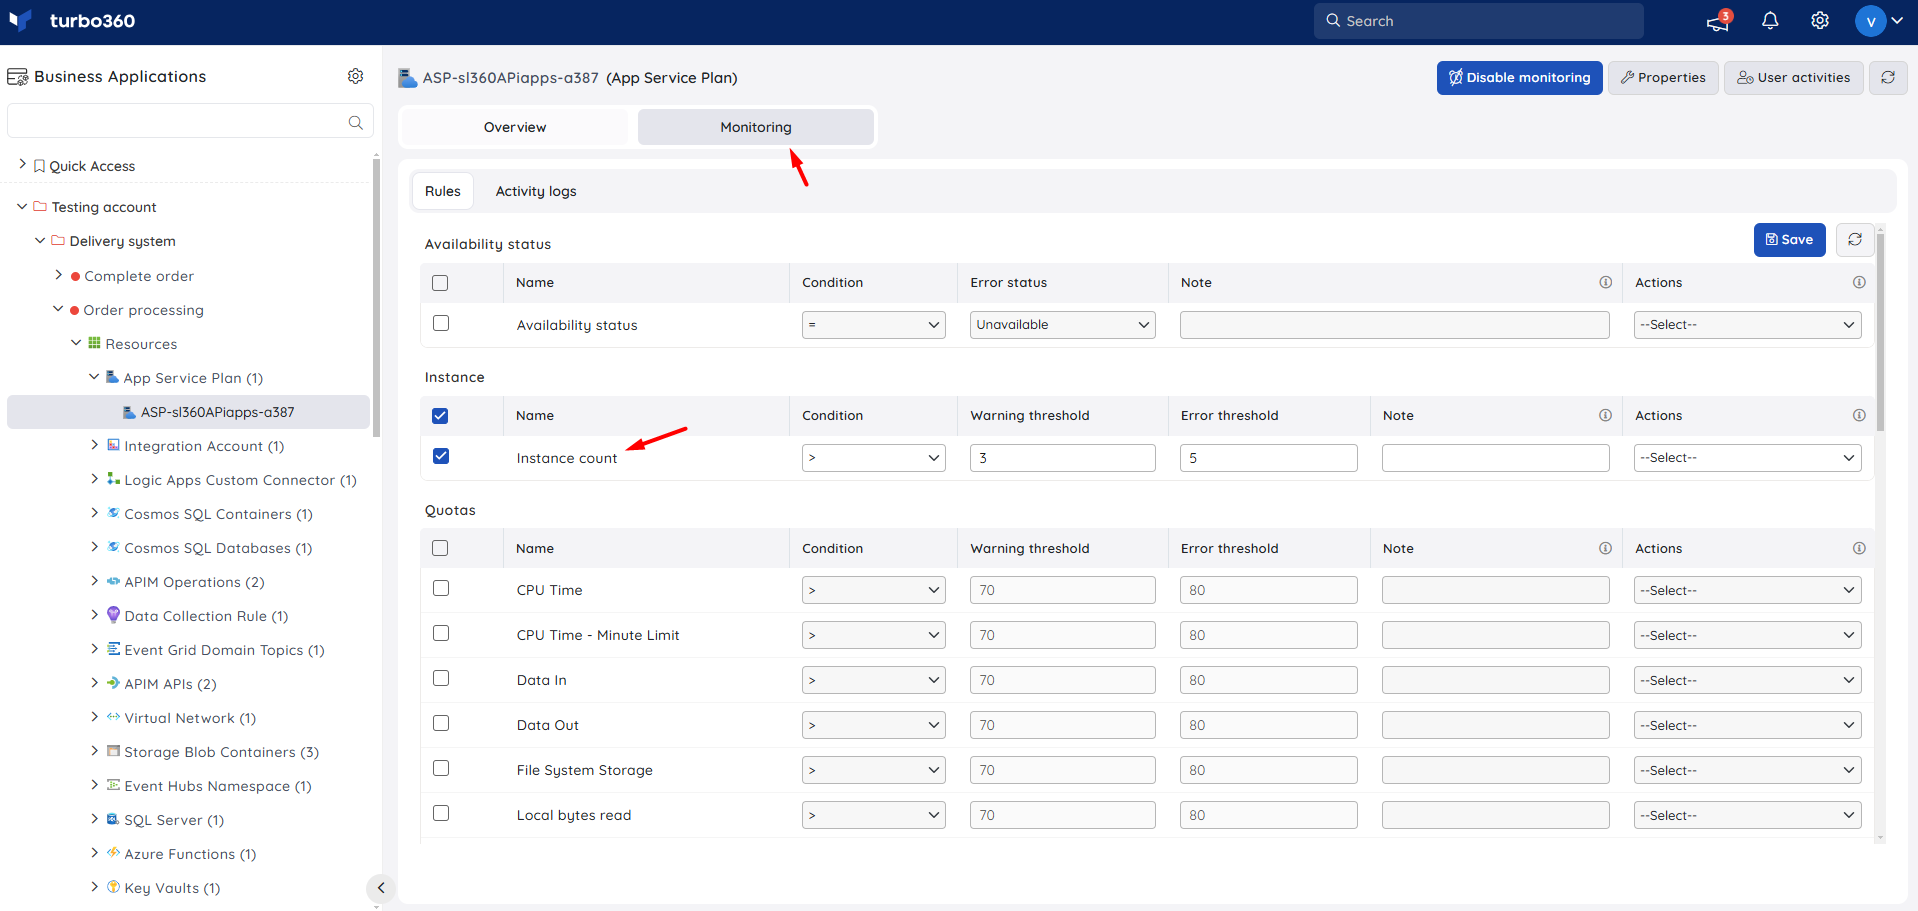
The instance count available for an App service plan can be monitored with the help of Instance count rule under Instance.
- Navigate to App Service Plan -> Monitoring
- Configure the Instance count rule with the desired threshold
- Click Save
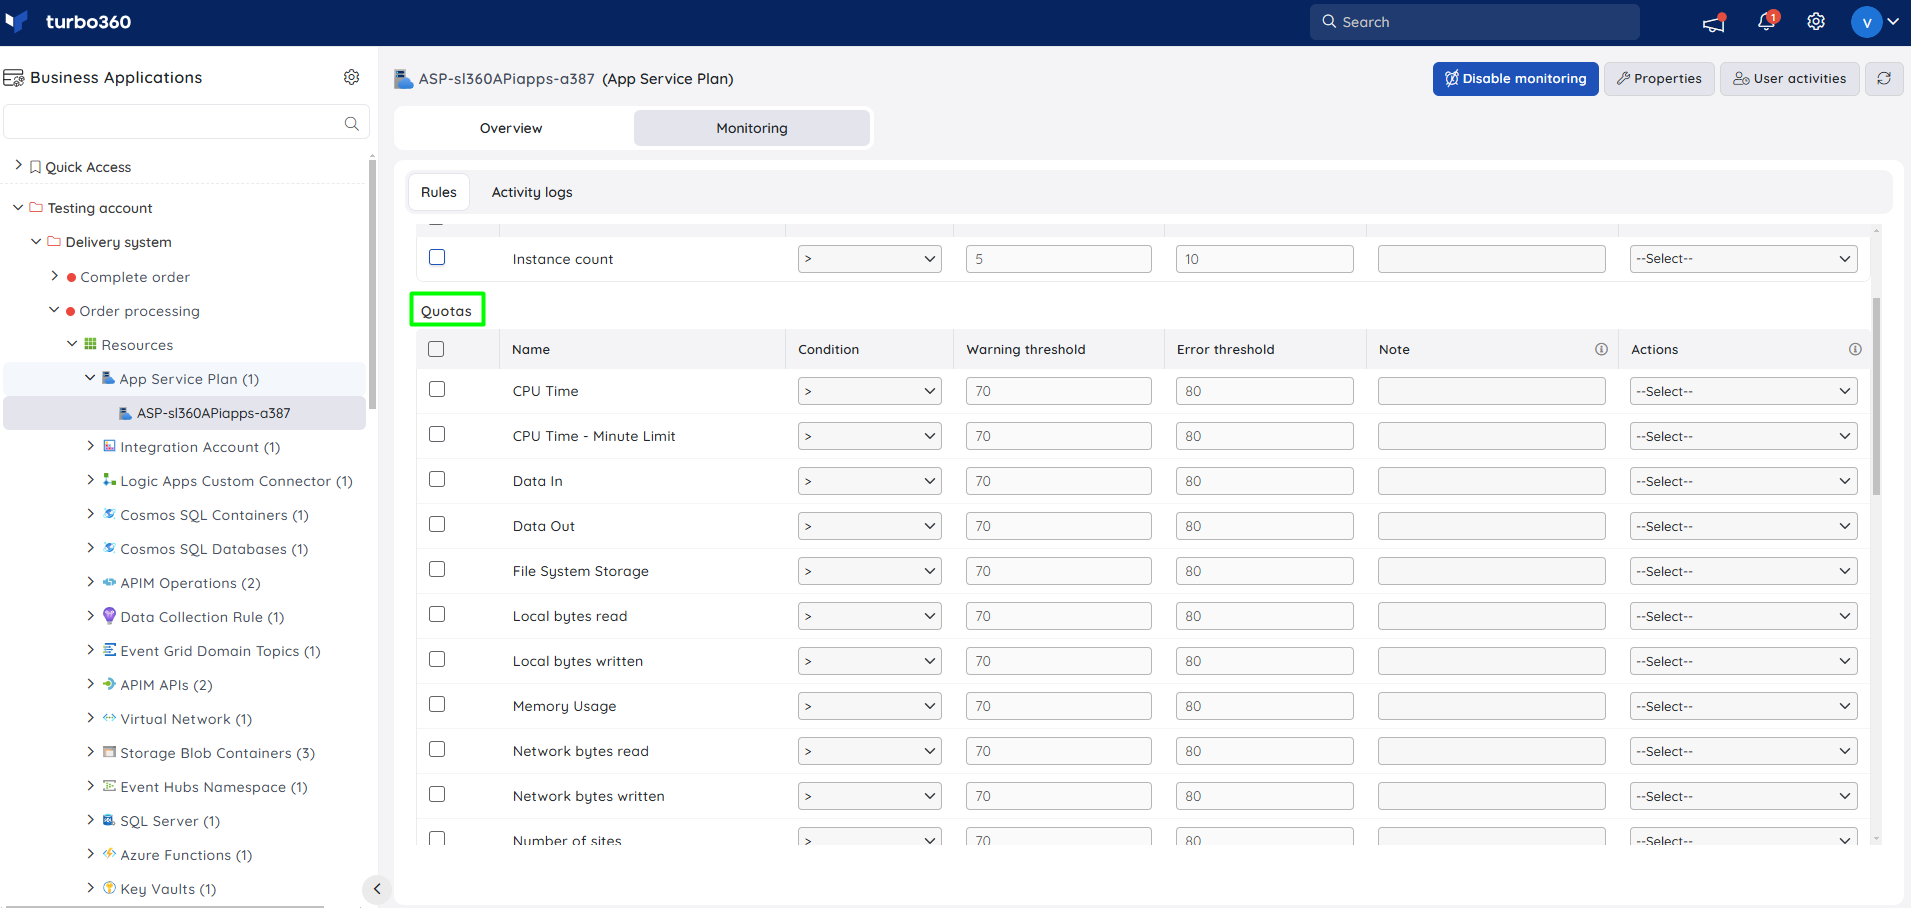
Quotas monitoring
- Navigate to App Service Plan -> Monitoring
- Choose the required quotas exposed by App service plan and configure the threshold values
- Click Save
Metric monitoring
- Navigate to App Service Plan -> Monitoring
- Select the required metrics and configure the threshold values
- Click Save
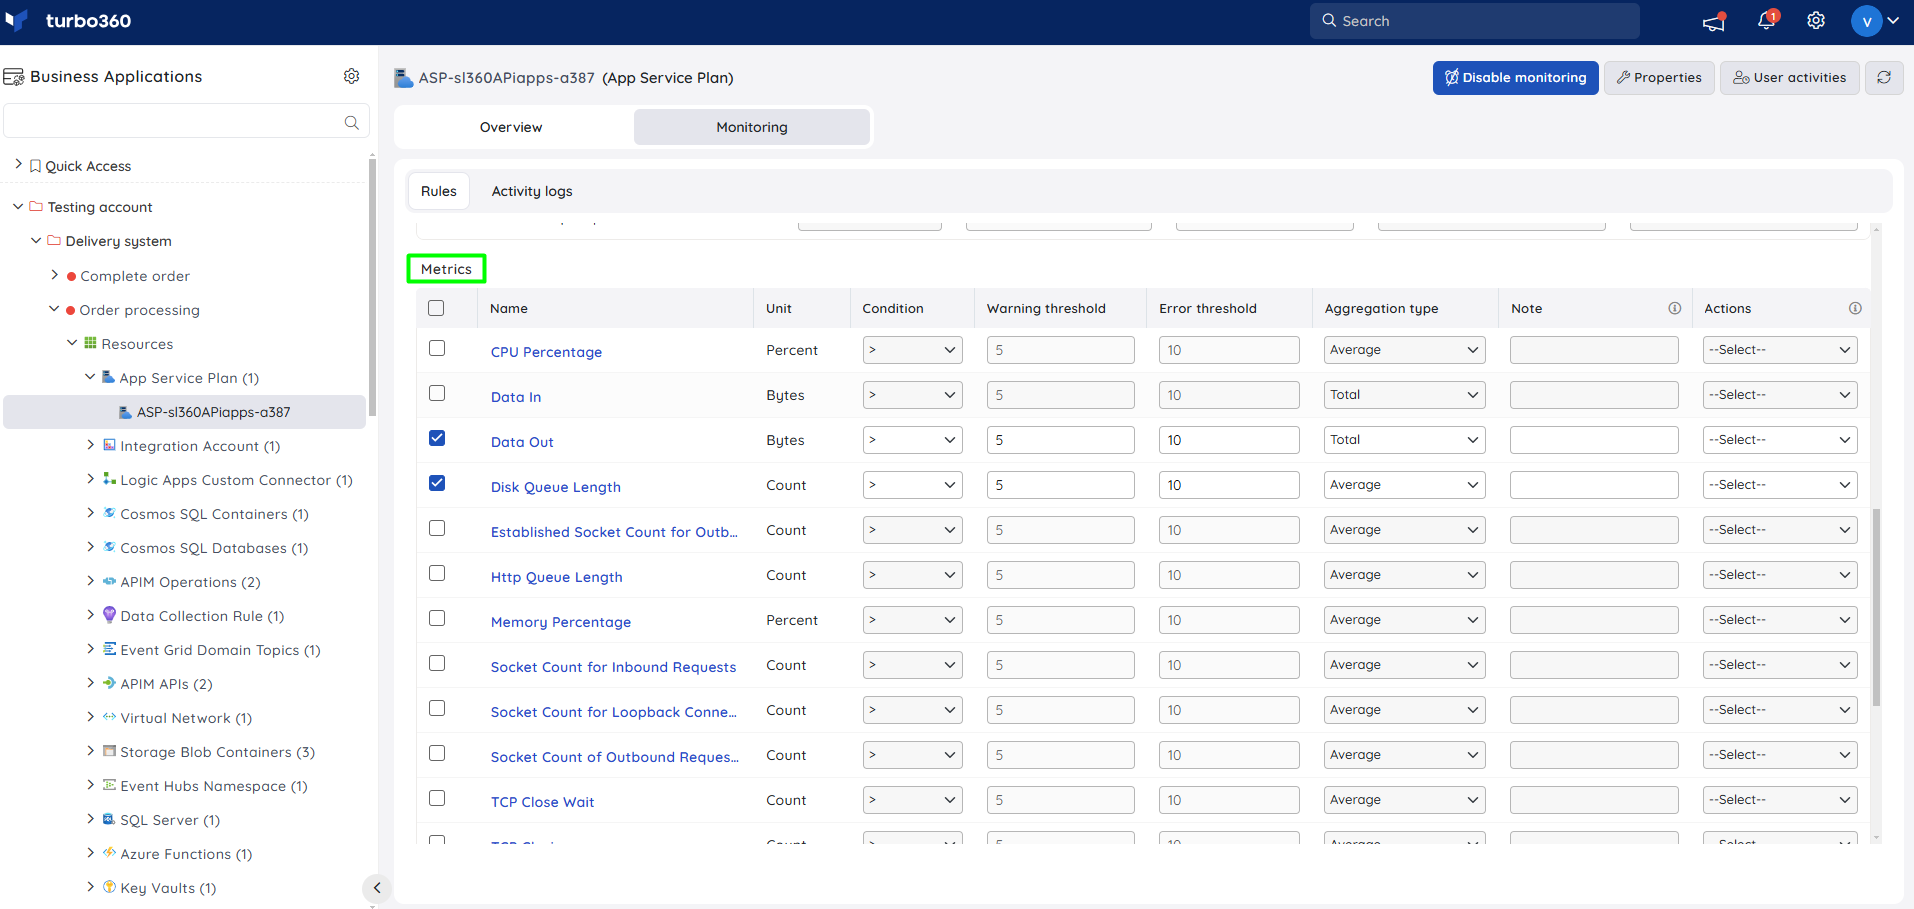
The threshold values can also be provided with any metric name, defining the monitoring rule to be violated when the metric value configured at threshold field is met.
Monitoring rules will be saved for App Service Plan, and the monitoring state for the metrics will be reflected after every monitoring cycle.
Monitoring Recommendations
The App Service Plan is potentially used by multiple apps. In this case you want to consider it a bit like a server where we are monitoring infrastructure type metrics.
There will be some overlap between metrics which can be monitored at the plan level and metrics which can be monitored at the app level. An example to consider here is that you might have a noisy application which may trigger monitoring alerts and do you want to see the alerts in the context of the single app, both apps or the shared infrastructure they run on.
Metrics
The common metrics people monitor here are:
| Metric | Warning Threshold | Error threshold |
|---|---|---|
| CPU Percentage | > 90 | > 95 |
| Memory Percentage | > 90 | > 95 |
| Http Queue Length | 100 | 200 |
Points to Note:
- The threshold above are a guide and your application may vary based on its usage
- HTTP queue length indicates requests in the queue waiting to be processed and is an indicator your plan needs to be scaled
- You may also wish to monitor other metrics on a case by case basis.
Instance
The instance monitoring is based on the number of nodes being used by the app service plan. A common scenario here would be to get an alert if the number of nodes scales beyond 3 then I will get an alert so I know my application may be under load.
You may choose to add instance monitoring if you are using dynamic scaling and want to get alerts as the plan scales out if you want to watch for scenarios like high load causing your app service plan to scale out.
More Info
There are more info on specific counters on the below link:
https://learn.microsoft.com/en-us/azure/app-service/web-sites-monitor

