- 07 Jan 2026
- 1 Minute to read
- Print
- DarkLight
- PDF
Automatic Anomaly Detection
- Updated on 07 Jan 2026
- 1 Minute to read
- Print
- DarkLight
- PDF
Introduction
The Cost Analyzer offers real-time visibility into your Azure expenses and utilizes your historical data to spot any unusual cost occurrences. It automatically identifies any spikes in subscription costs within the specified time intervals, like monthly or daily, at the group level. This feature includes the benefit of alerting the user whenever anomalies are detected.
Anomaly detection is automatically activated upon enabling a budget monitor in a cost management group, alerting the user in case of of any anomalies detected.
The below video is a good example of whowing how anomaly detection can help.
Configuration
Follow the below steps to manage anomaly detection configuration at the group level:
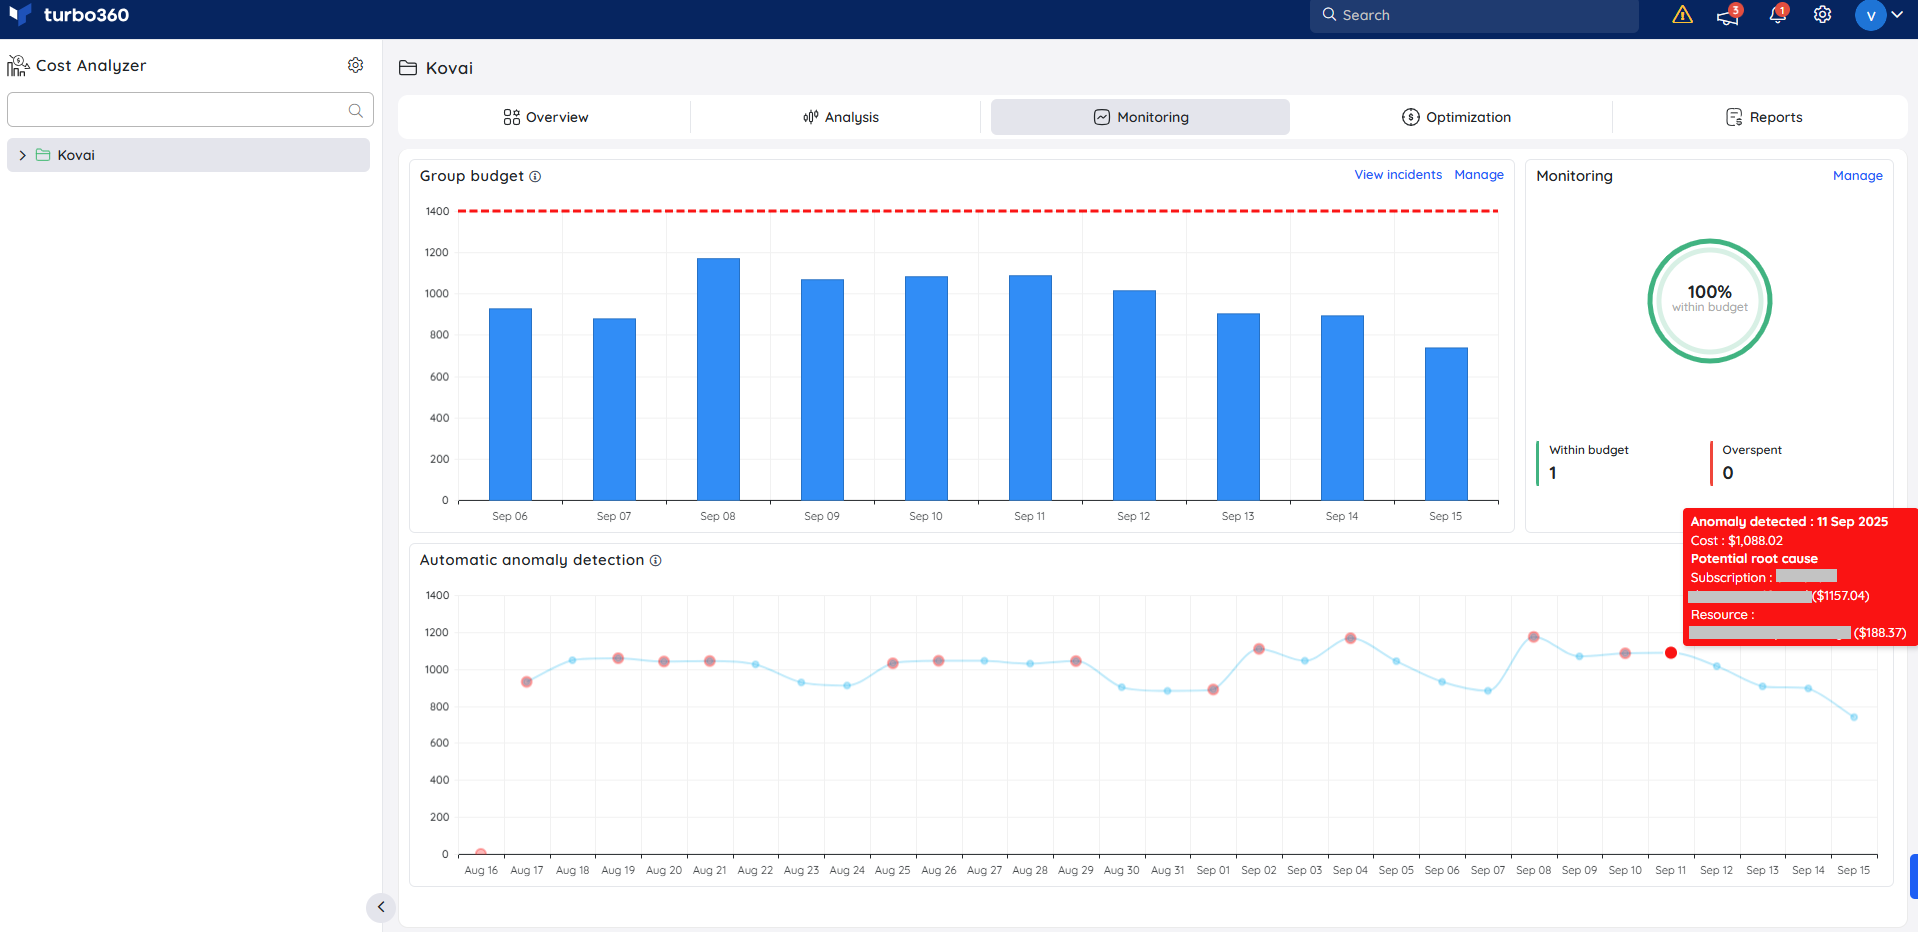
- Go to Cost group -> Monitoring
The Automatic anomaly detection widget displays a chart of the monthly usage trend, with red points denoting any anomalies.

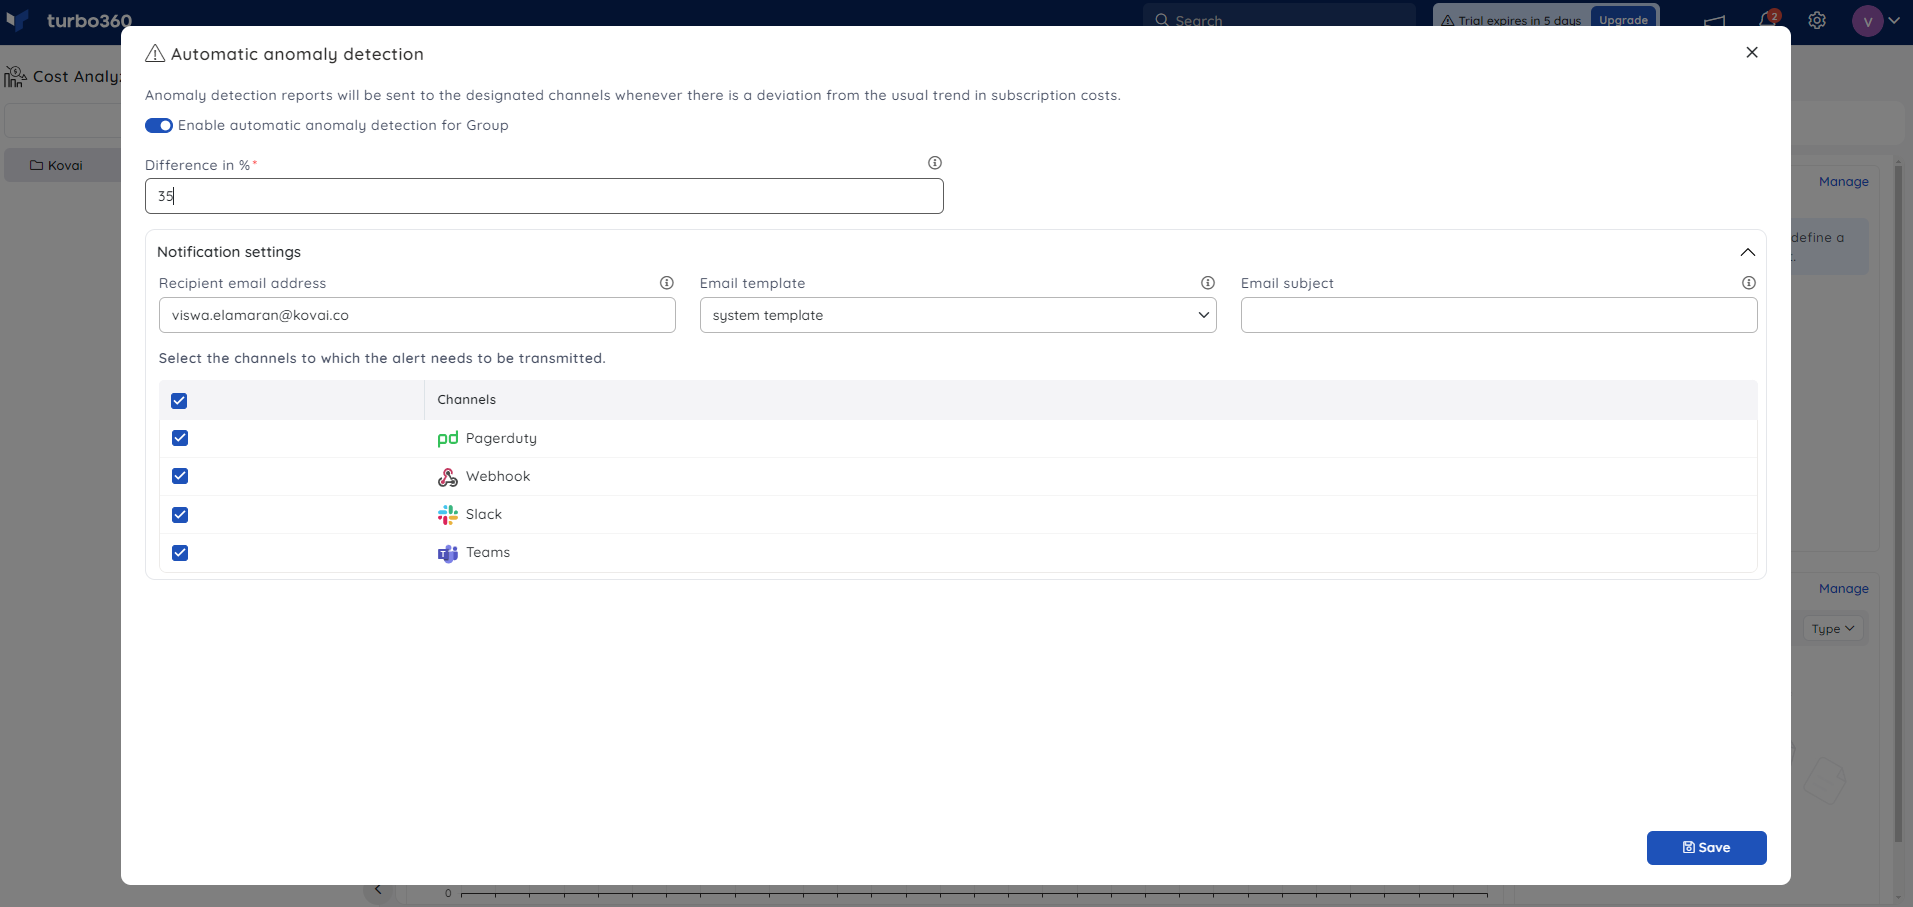
- Click the Manage option and enable the Anomaly detection toggle
- Define a Threshold multiplier to determine the sensitivity for anomaly detection.
Anomaly detection is based on the standard deviation of cost fluctuations over the past 30 days. If the daily cost change exceeds the calculated standard deviation, it is flagged as an anomaly. The sensitivity of this detection can be customized using the threshold multiplier, which ranges from 0.1 to 10. A lower multiplier increases sensitivity, triggering alerts even for small cost changes that exceed the standard deviation.
- Choose the desired notification channels for alerting.
- Click save.

Cost anomaly report
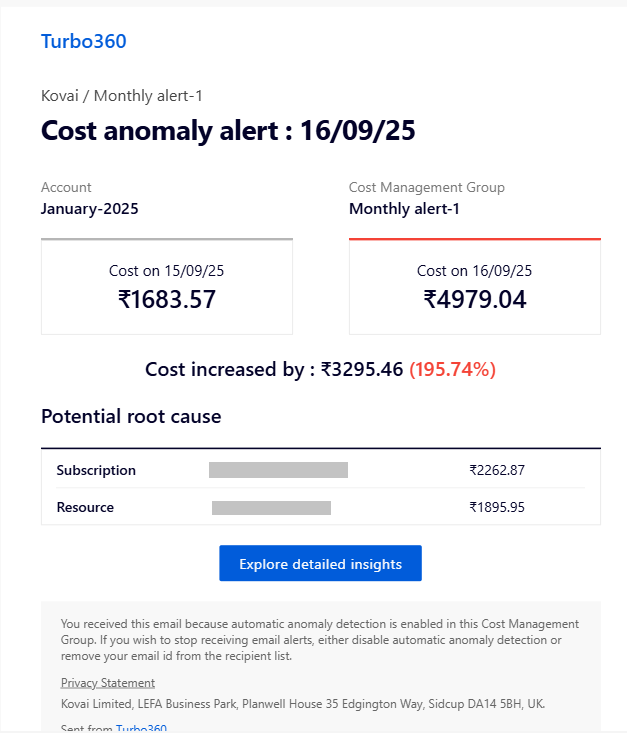
Below is the Cost anomaly report received via Turbo360 mail. This comprehensive report outlines potential root causes and the overall cost variation detected on the specified date.
The cost anomaly report contains a navigation link that directs users to explore the cost expenditure within the cost analysis section of the corresponding group.

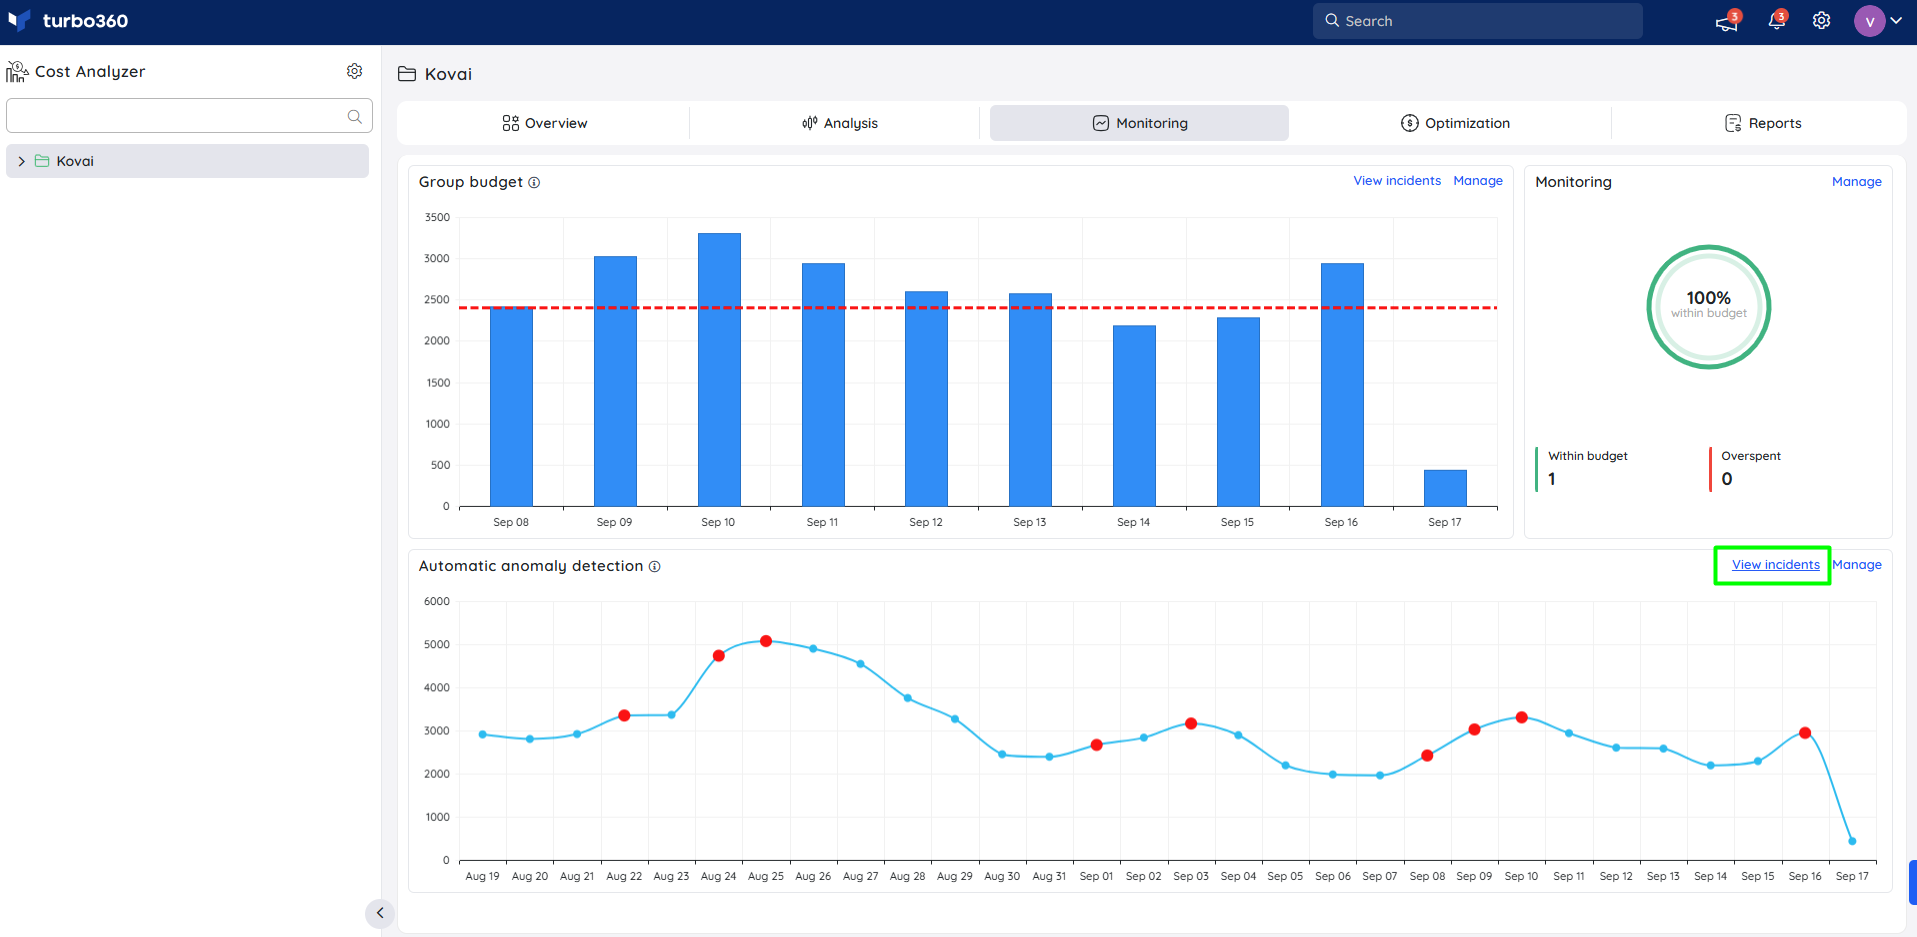
Alert Incidents
When anomalies are detected within the specified interval, alerts are logged as incidents. Users can review these incidents by clicking the View Incidents option located in the Automatic anomaly detection widget.


