- 14 Apr 2025
- 7 Minutes to read
- Print
- DarkLight
- PDF
Azure Function App
- Updated on 14 Apr 2025
- 7 Minutes to read
- Print
- DarkLight
- PDF
Azure Function
Operations
Users can enable and disable an Azure Function by clicking the respective options.
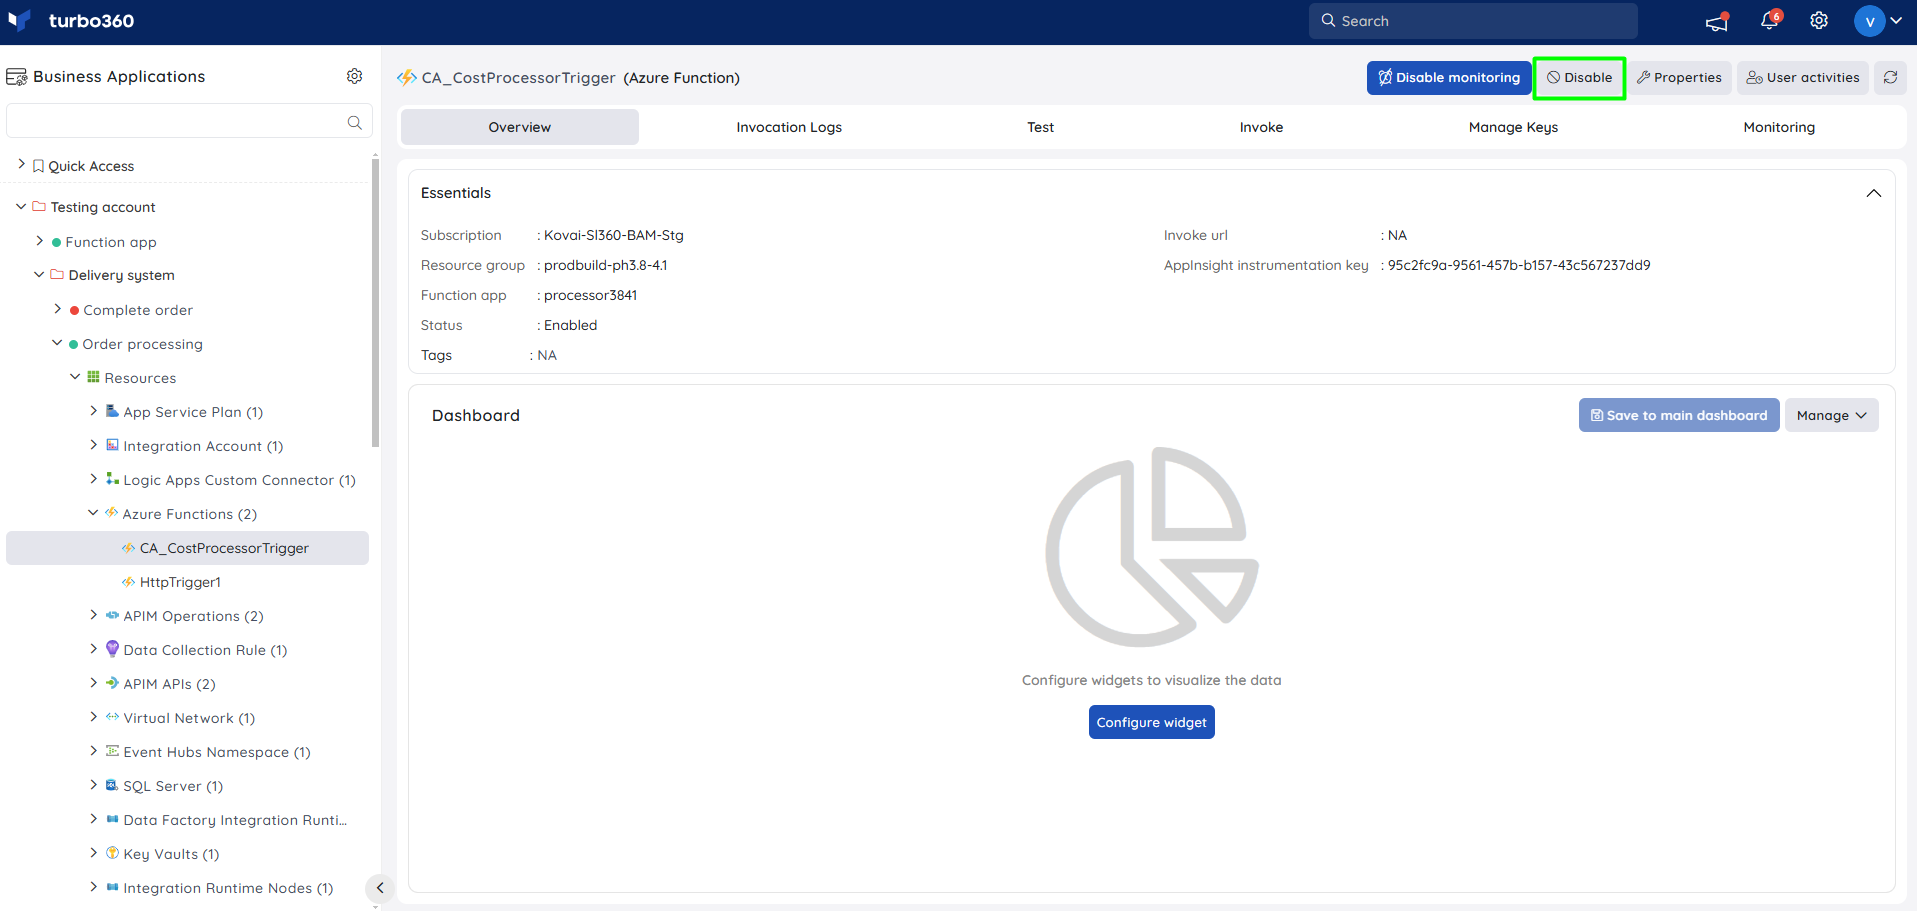
Test Function
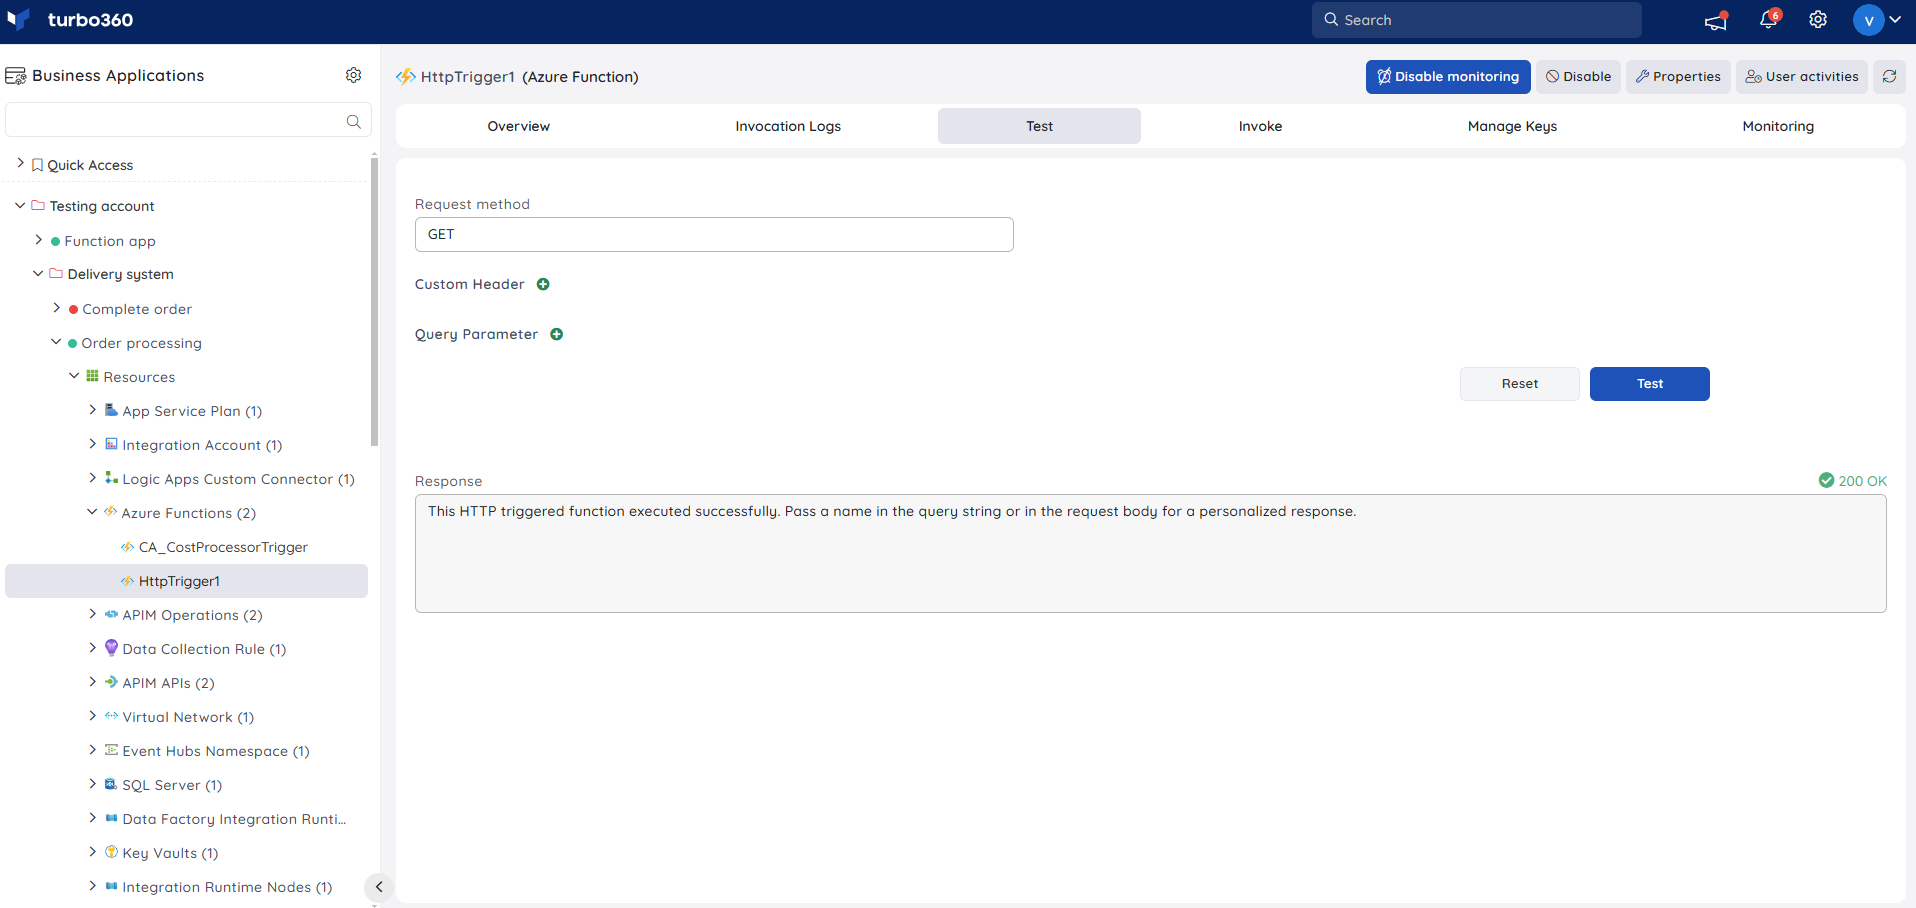
Azure Functions can be made to test run to view the status code and response using Turbo360.
- Select the Request method
- Provide a message body
- Custom headers and Query parameters can also be included
- Click Run
The input fields vary according to the trigger type.
For example, to test an HTTP triggered Function, the user can select the request method, say GET or POST and add Headers, Query parameters, and Message body. After providing the details, a test run can be made, and the response and its status code will be displayed.
Manage Keys
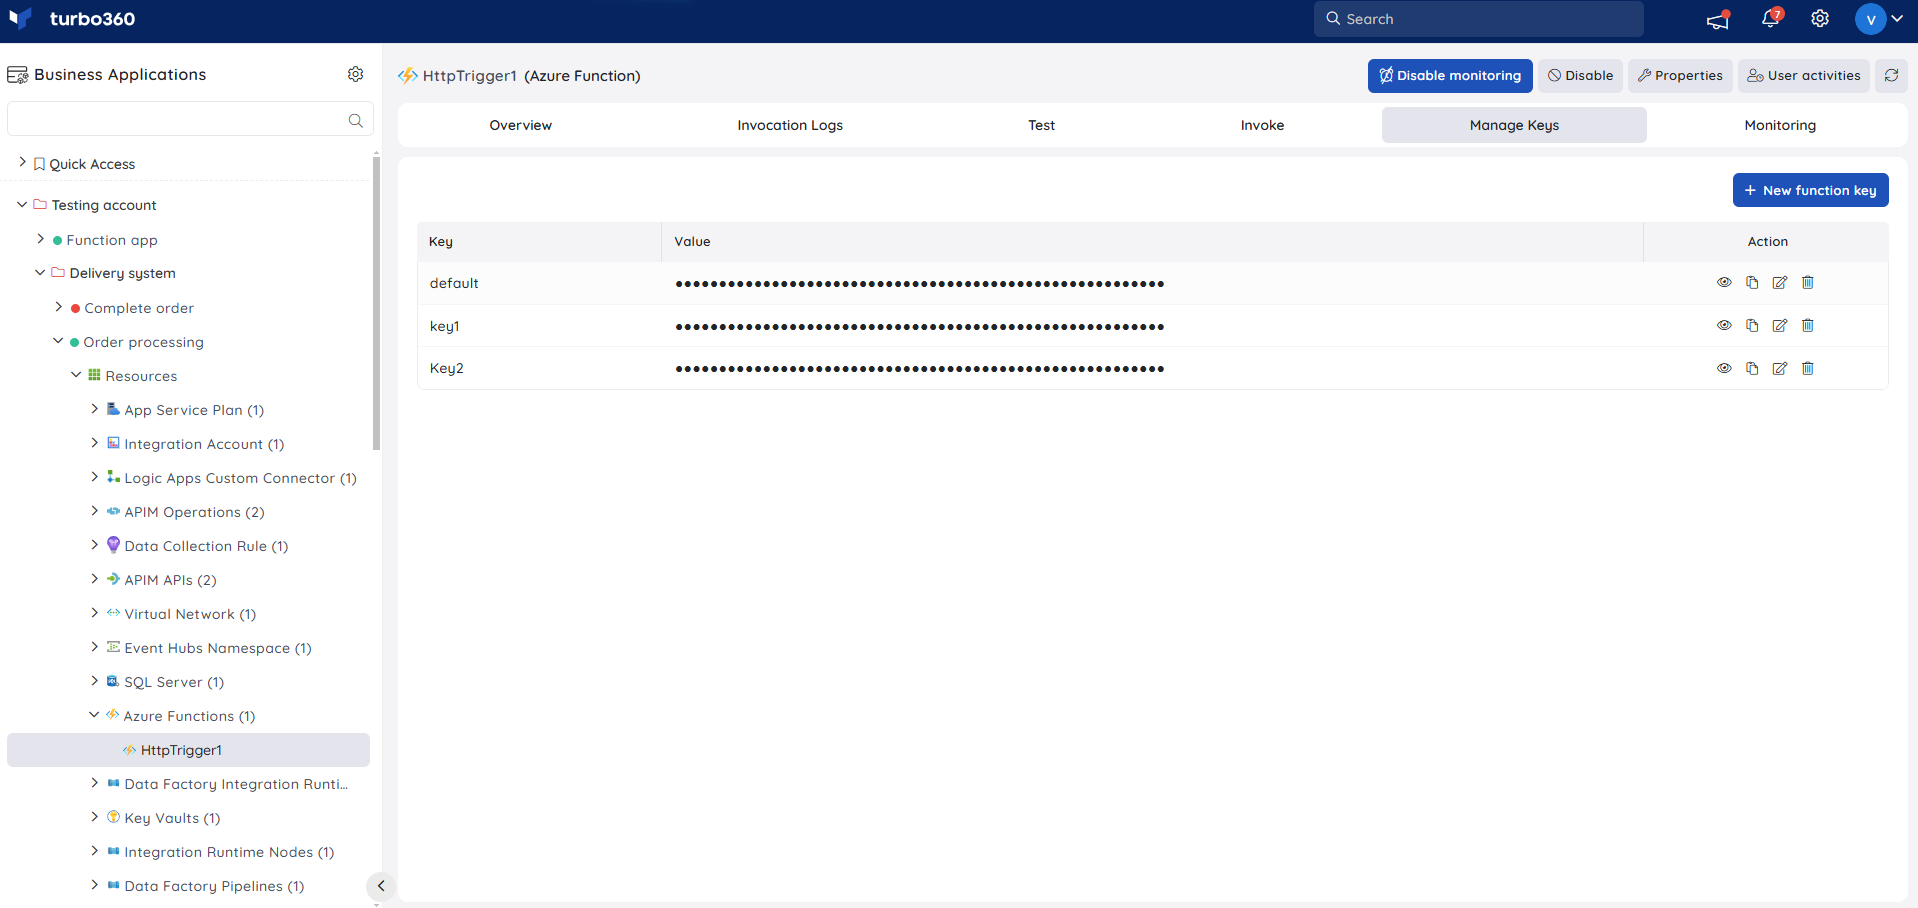
Keys provide default security mechanisms, and keys can be created at the Function level in Azure Functions.
If a key is created for a Function, then the Function expects the key as a header to authorize any HTTP request. If no key is created, no key is required for the HTTP requests to get authorized.
Turbo360 provides the capability to manage keys at the Function level. These keys are scoped to the function and can be used to access the function.
Perform the following steps to add a new key:
- Click the New function key
- Provide a key name and its value
- Click Create
The existing keys can be modified and deleted by using the respective icons.
Invoke Triggers
Azure Function supports triggers like HTTP, Service Bus Queue, Timer, etc. There may be scenarios where an invocation of the Function fails, and the user needs to reinvoke it.
There is no possibility to do it apart from posting the message of the failed invocation to the Trigger of the Function (this is not feasible in Timer triggered Function).
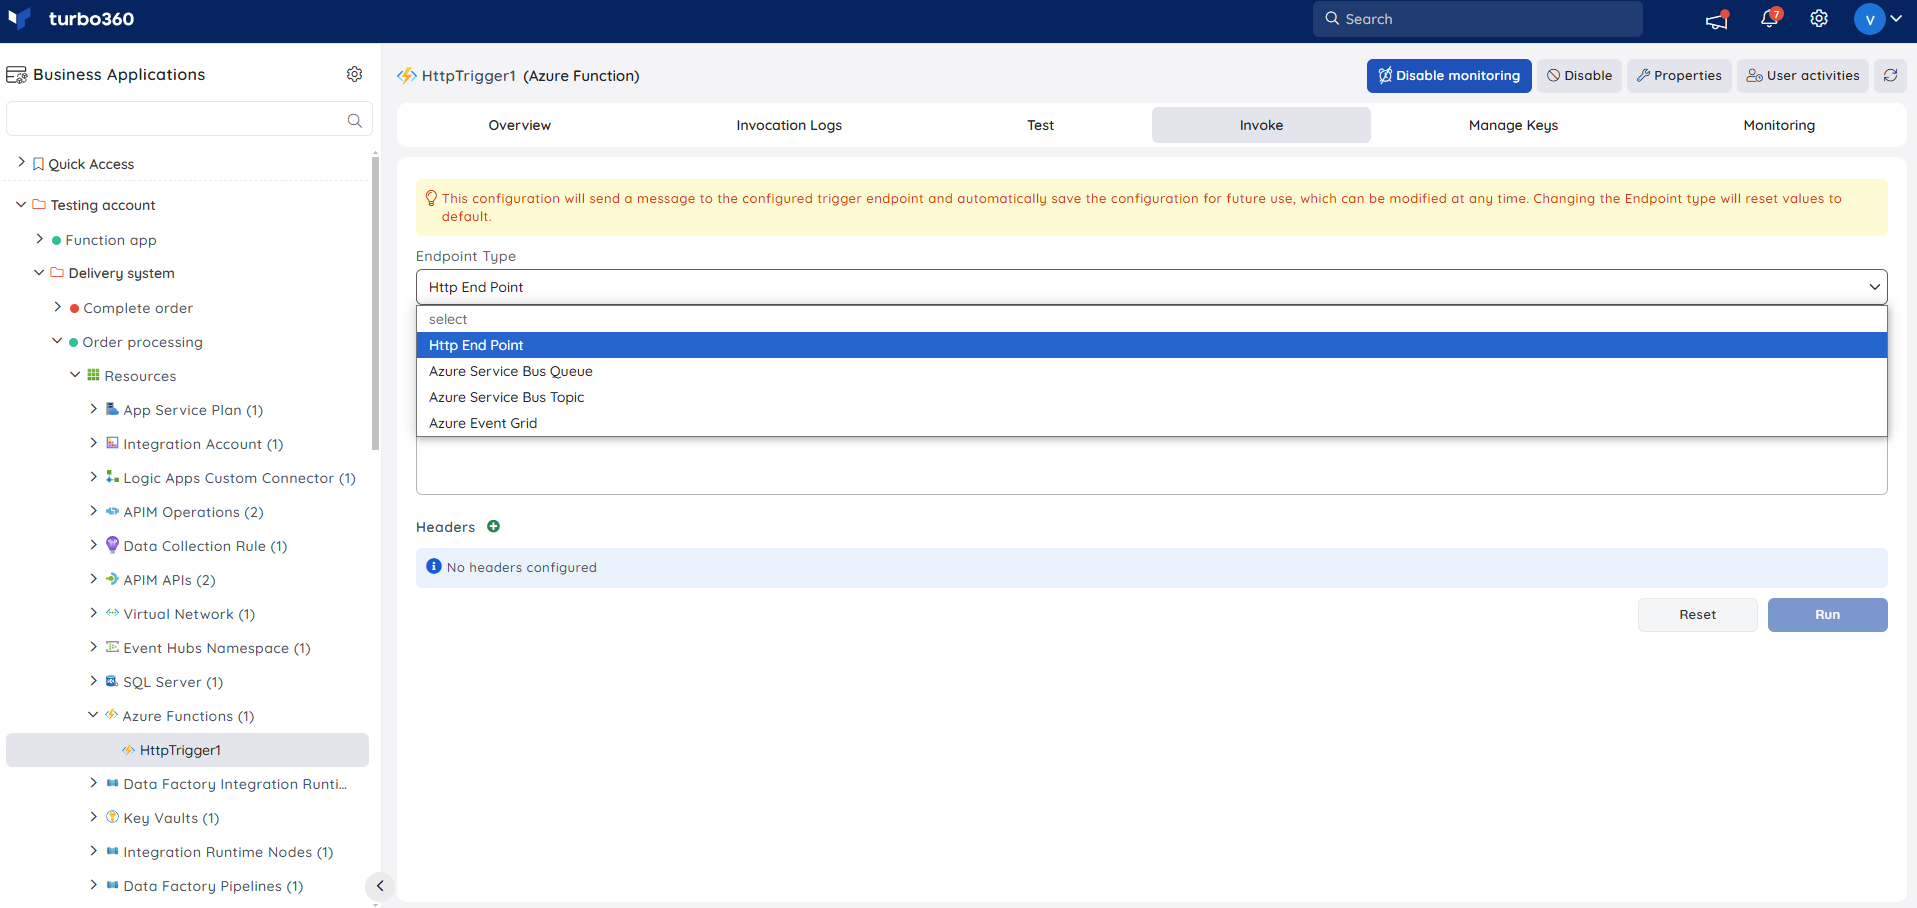
Turbo360 can invoke the Function by sending a message to the Trigger. Users can achieve this by providing the Trigger details in Invoke Function screen and by sending the message.
For example, if the Function is a Service Bus Queue triggered, the user can provide the Queue connection details and post the message. The Triggers supported in Turbo360 are Service Bus Queue, Service Bus Topic, Event Grid, and HTTP.
Invocation Logs
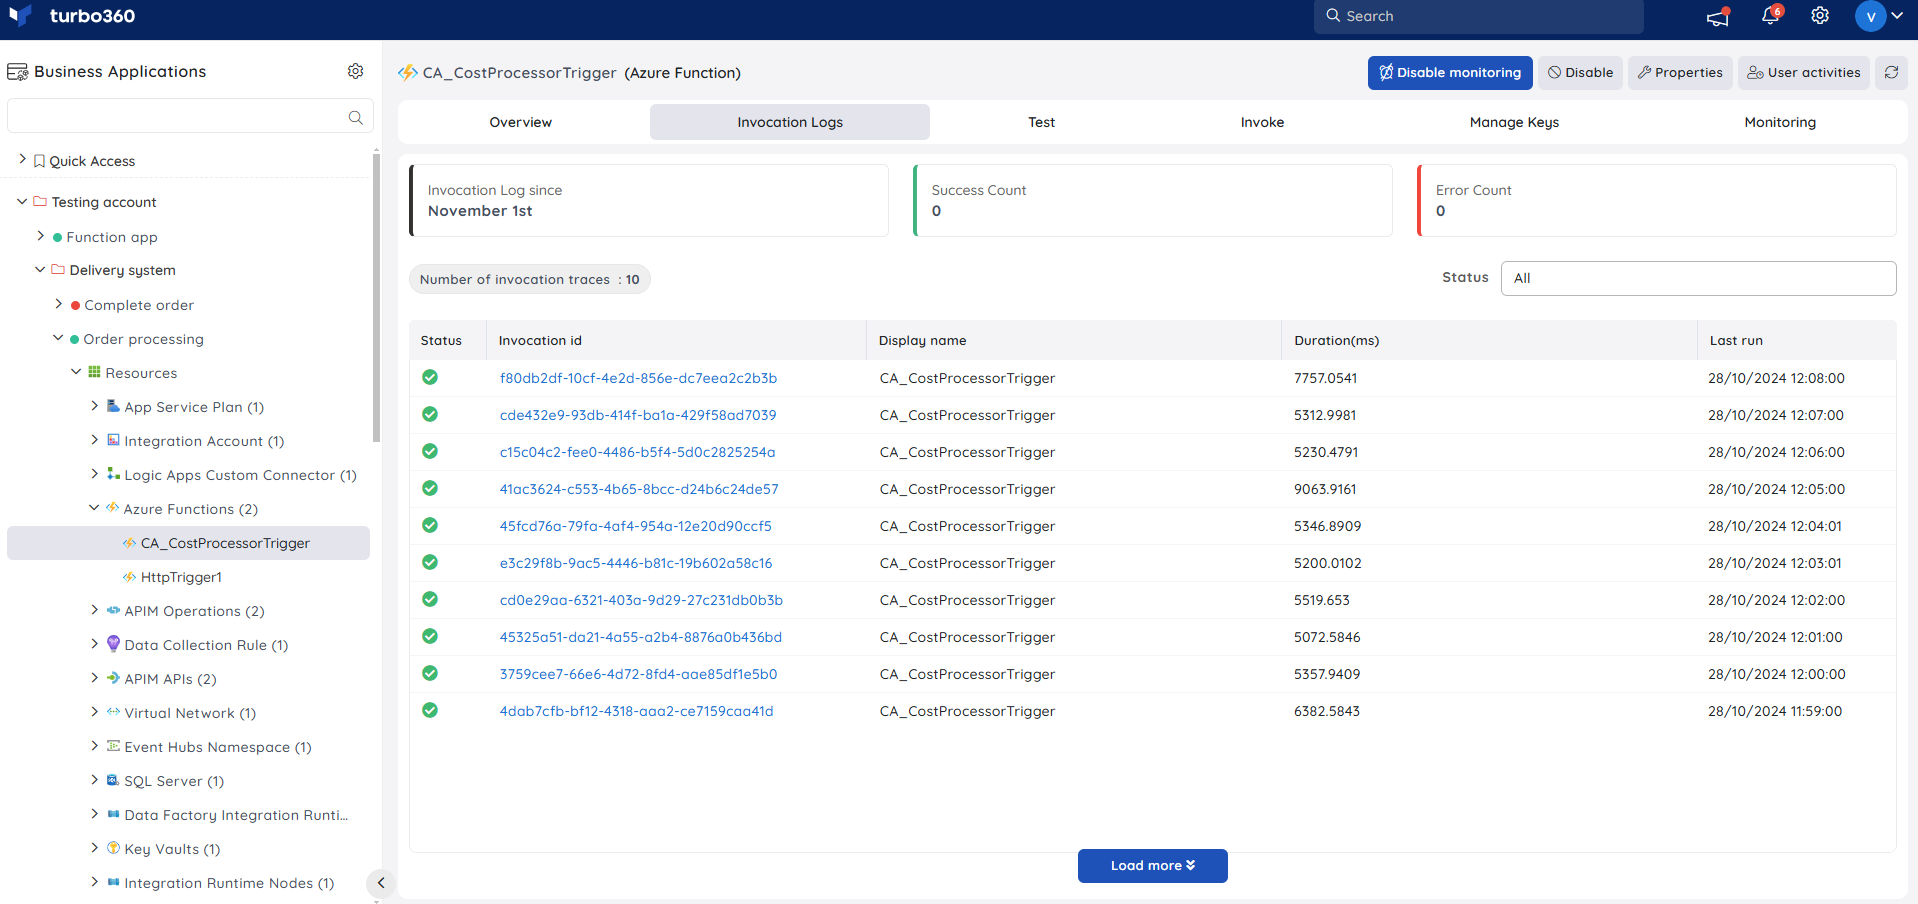
Access to the invocation logs of Azure Functions is a significant capability provided by Turbo360 in terms of Azure Function App management.
The logs can be filtered by selecting one of the following states: Succeeded, Failed.
The invocation detail contains the following information: Invocation date, Message, and Log level.
Resource Dashboard
- The application insight resource created when deploying the Azure Function resource in the Azure portal must be associated with the same Business Application to use the resource dashboard for Azure Function resources.
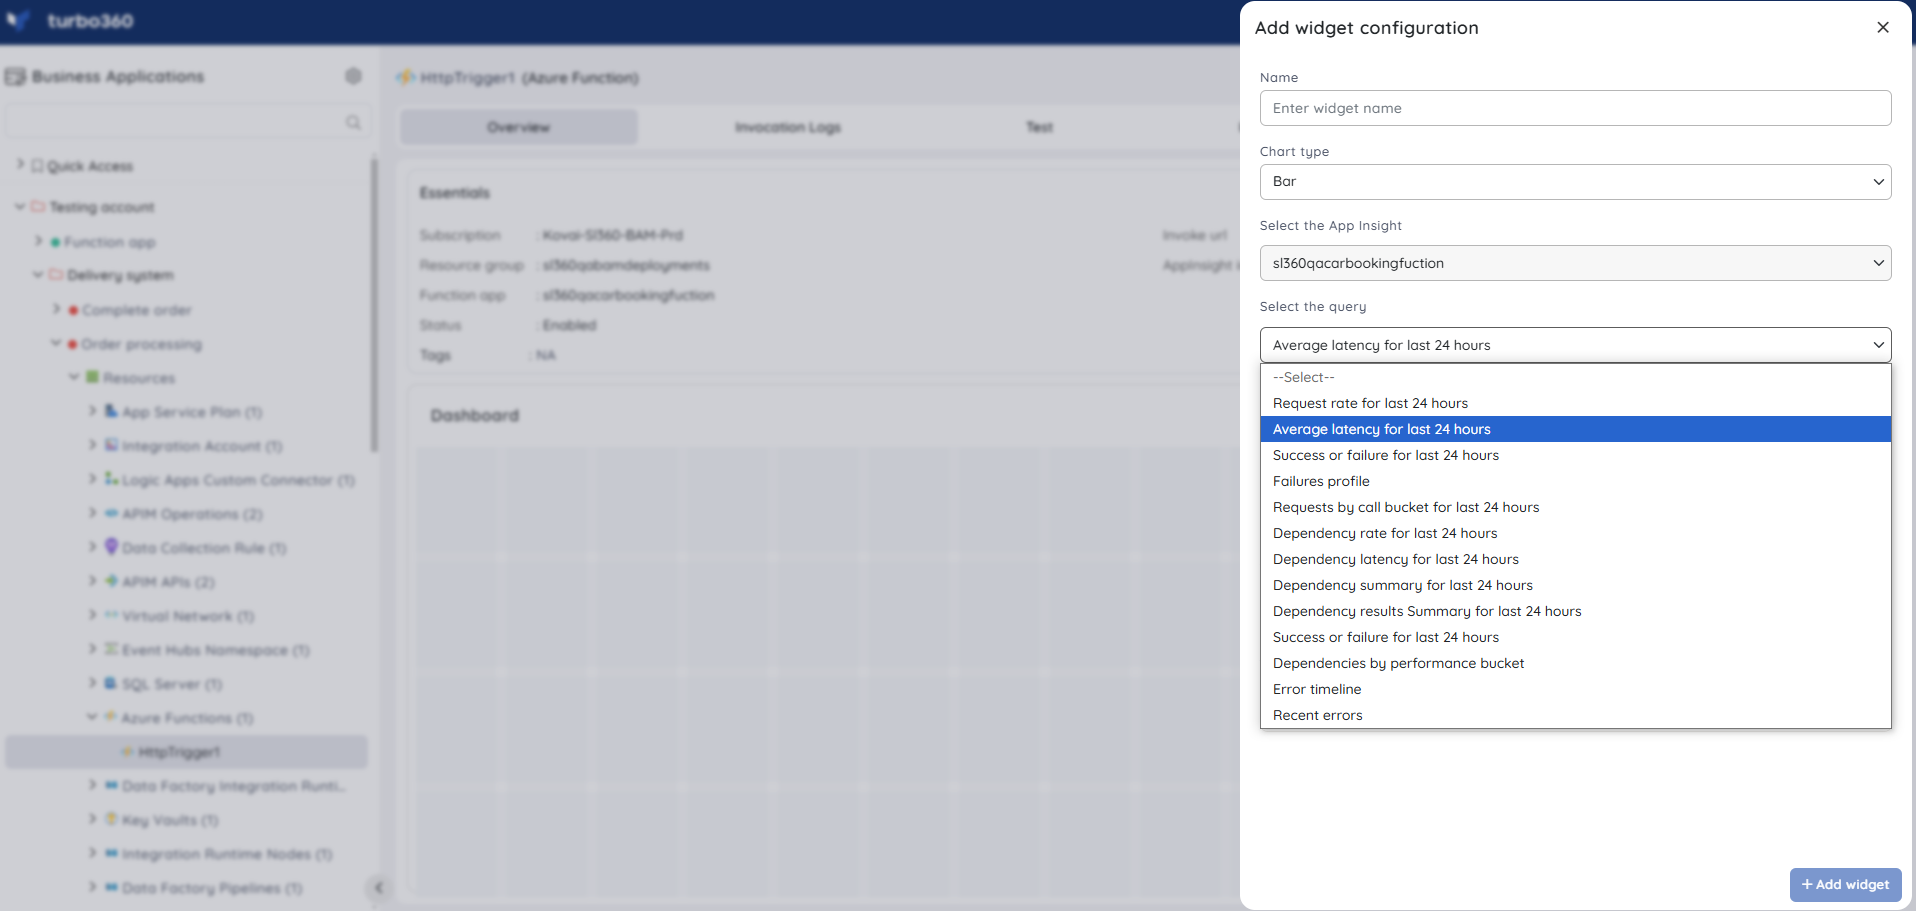
A set of default queries is available to create dashboard widgets using the associated application insight.
The count chart type is not supported for the Azure Function resource dashboard.
Azure Function resource dashboard widgets can only be created using the application insight resource deployed alongside the Azure function deployment. The creation of dashboard widgets will restrict access to additional application insight resources.
Monitoring
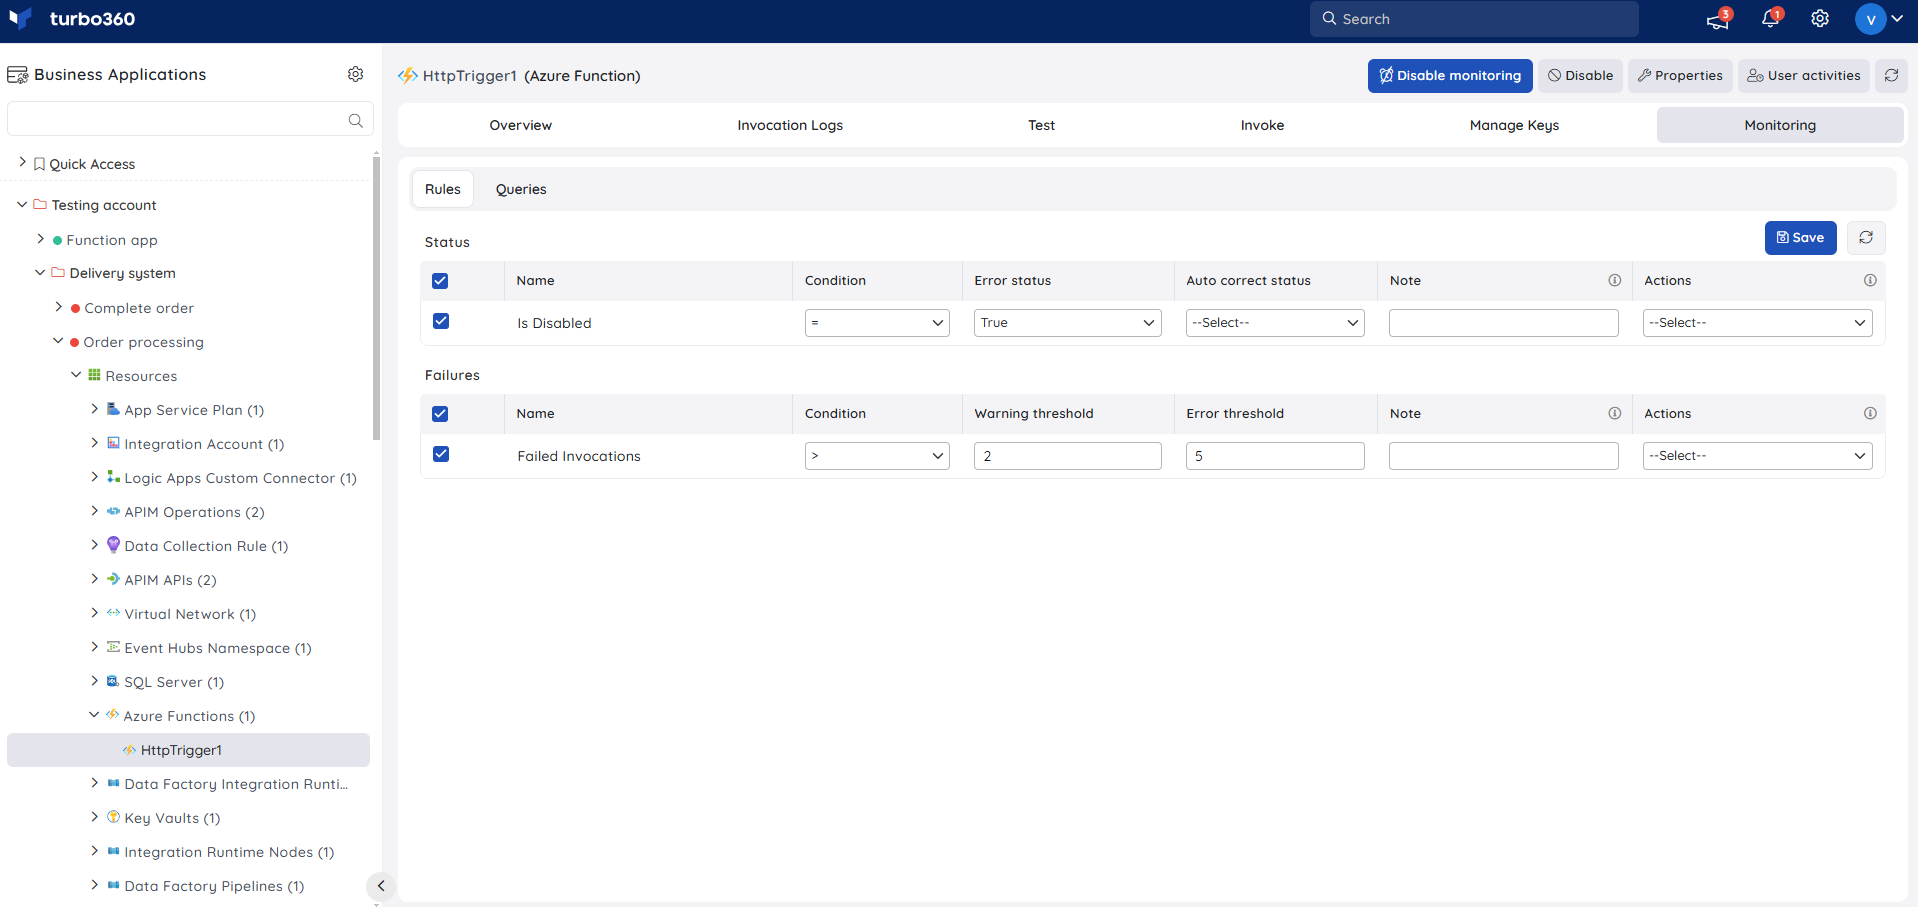
State Monitoring
- Navigate to Azure Function -> Monitoring
- Configure threshold value for the state of the function to determine the health state
- Click Save
The monitoring rule will be saved for Azure Function, and the monitoring state will be reflected after every monitoring cycle.
Failure Monitoring
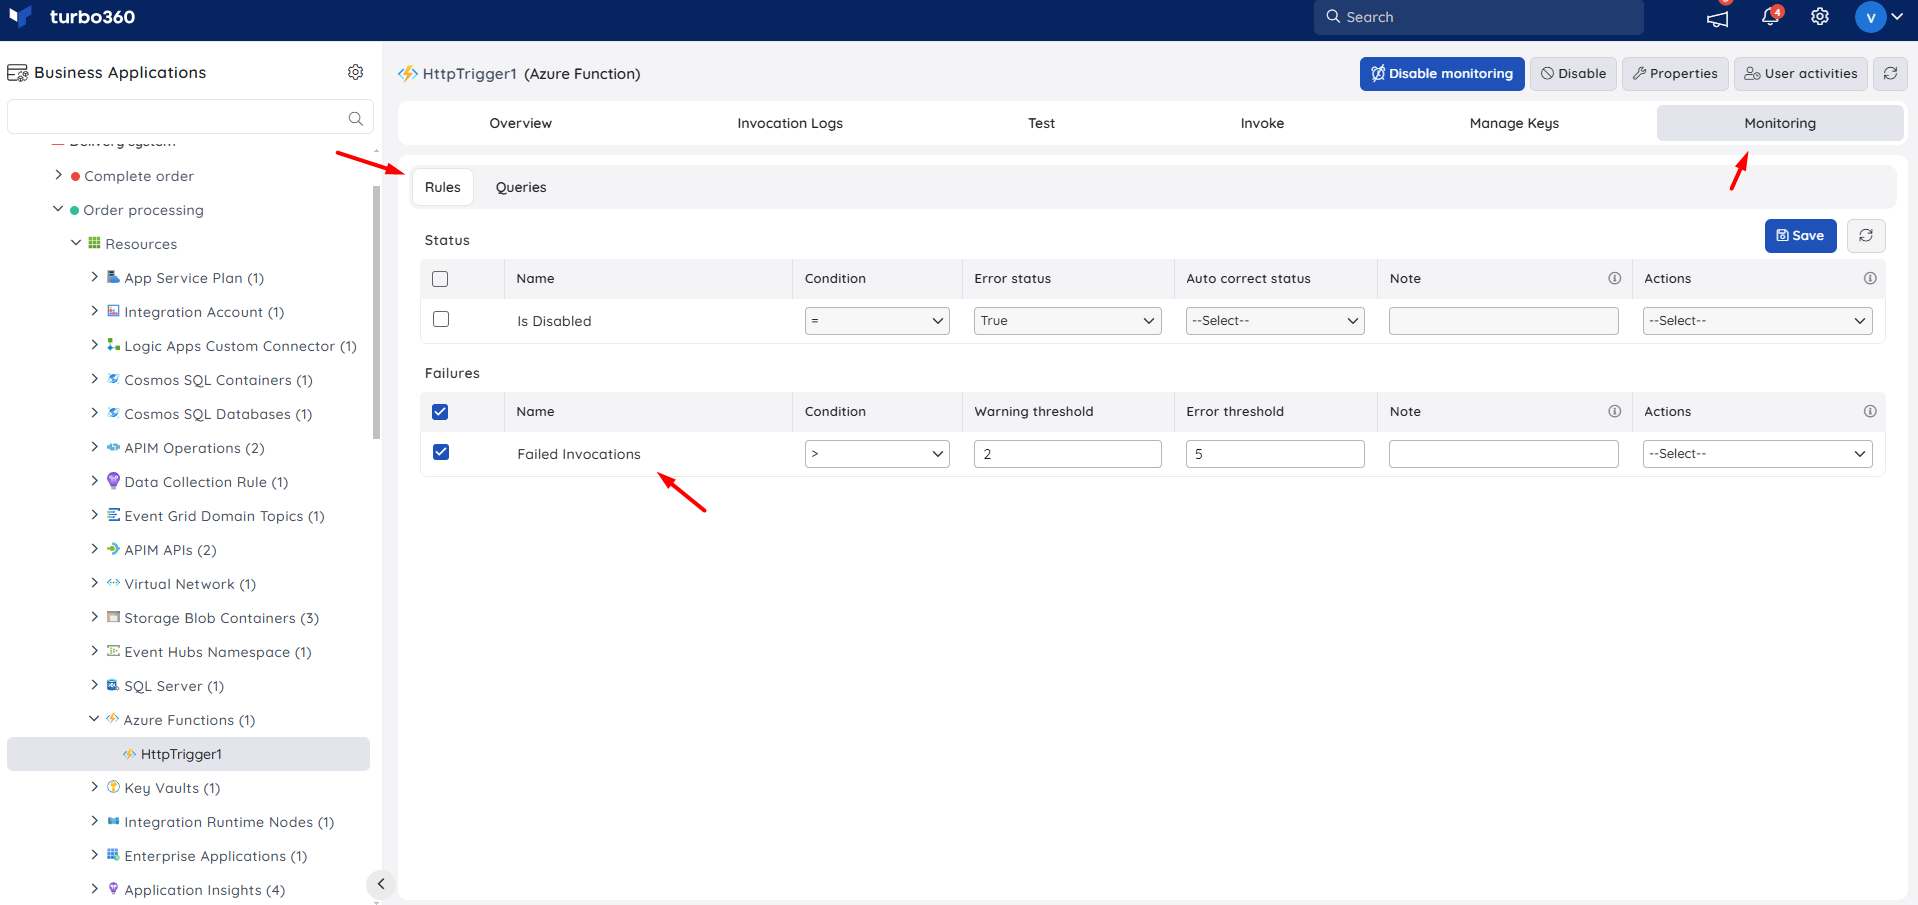
- Navigate to Azure Function -> Monitoring
- Select Failed invocations under Failures and configure the threshold values
- Click Save
Failure monitoring will be initiated once the rule is saved, and the monitoring state will be reflected after every monitoring cycle.
Query Monitoring
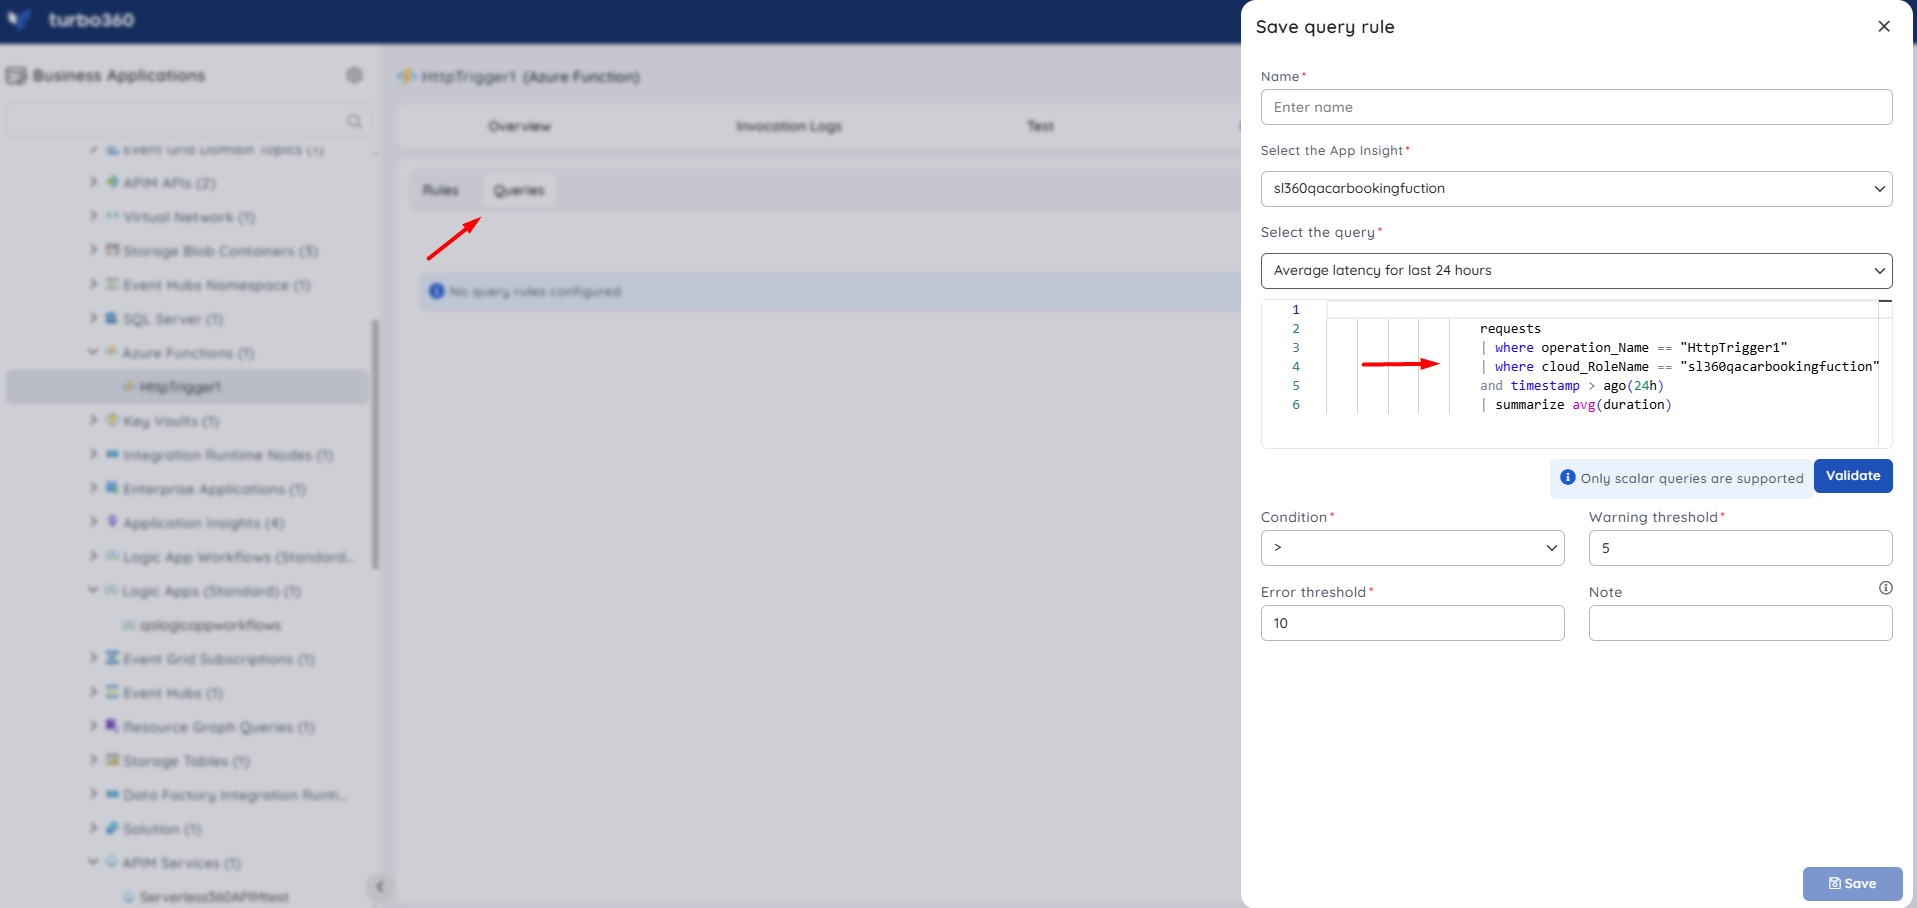
- Switch to the Queries tab to configure rules for query monitoring
- Click Add
- Enter a name to the query rule
- Choose any application insight resource to fetch query data
- You can enter the desired query by choosing Enter query (or) select one from the list of saved queries by choosing Open from saved queries
- Select the preferred time range
- Click Execute to run the query
- Select the required query columns and configure the threshold values
- Click Save
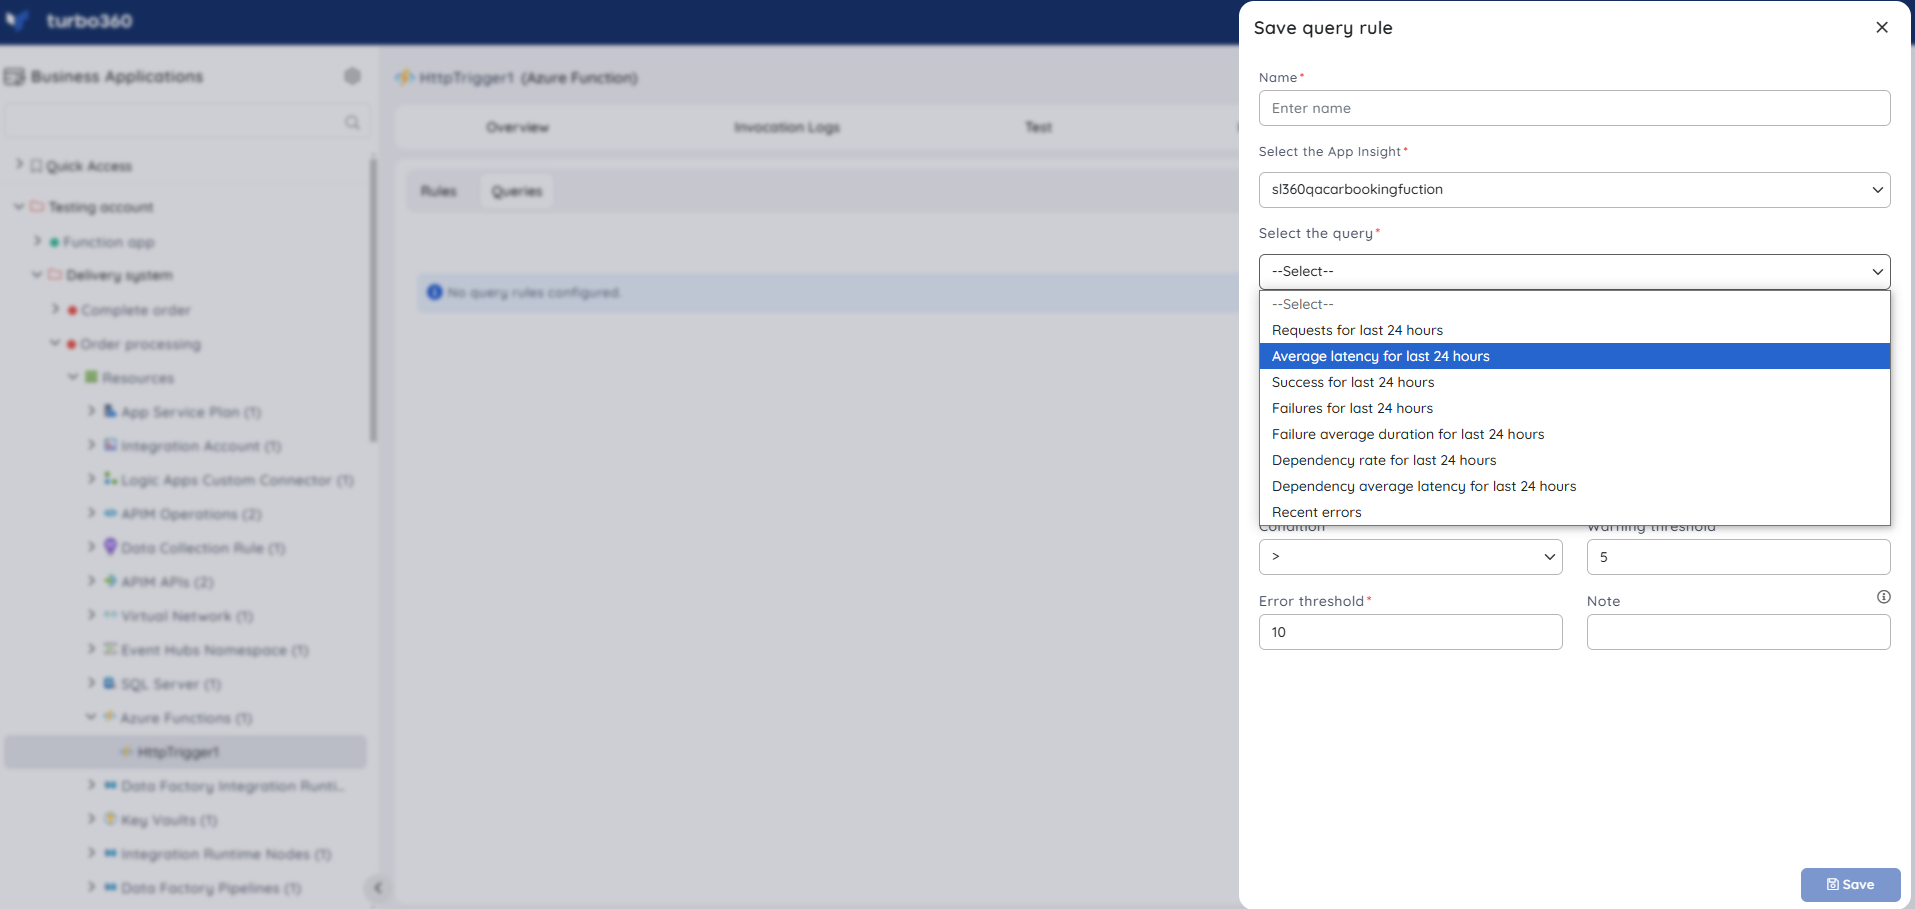
Query monitoring will be initiated once the rules are saved, and the query monitoring state will be reflected after every monitoring cycle.
Azure Function App
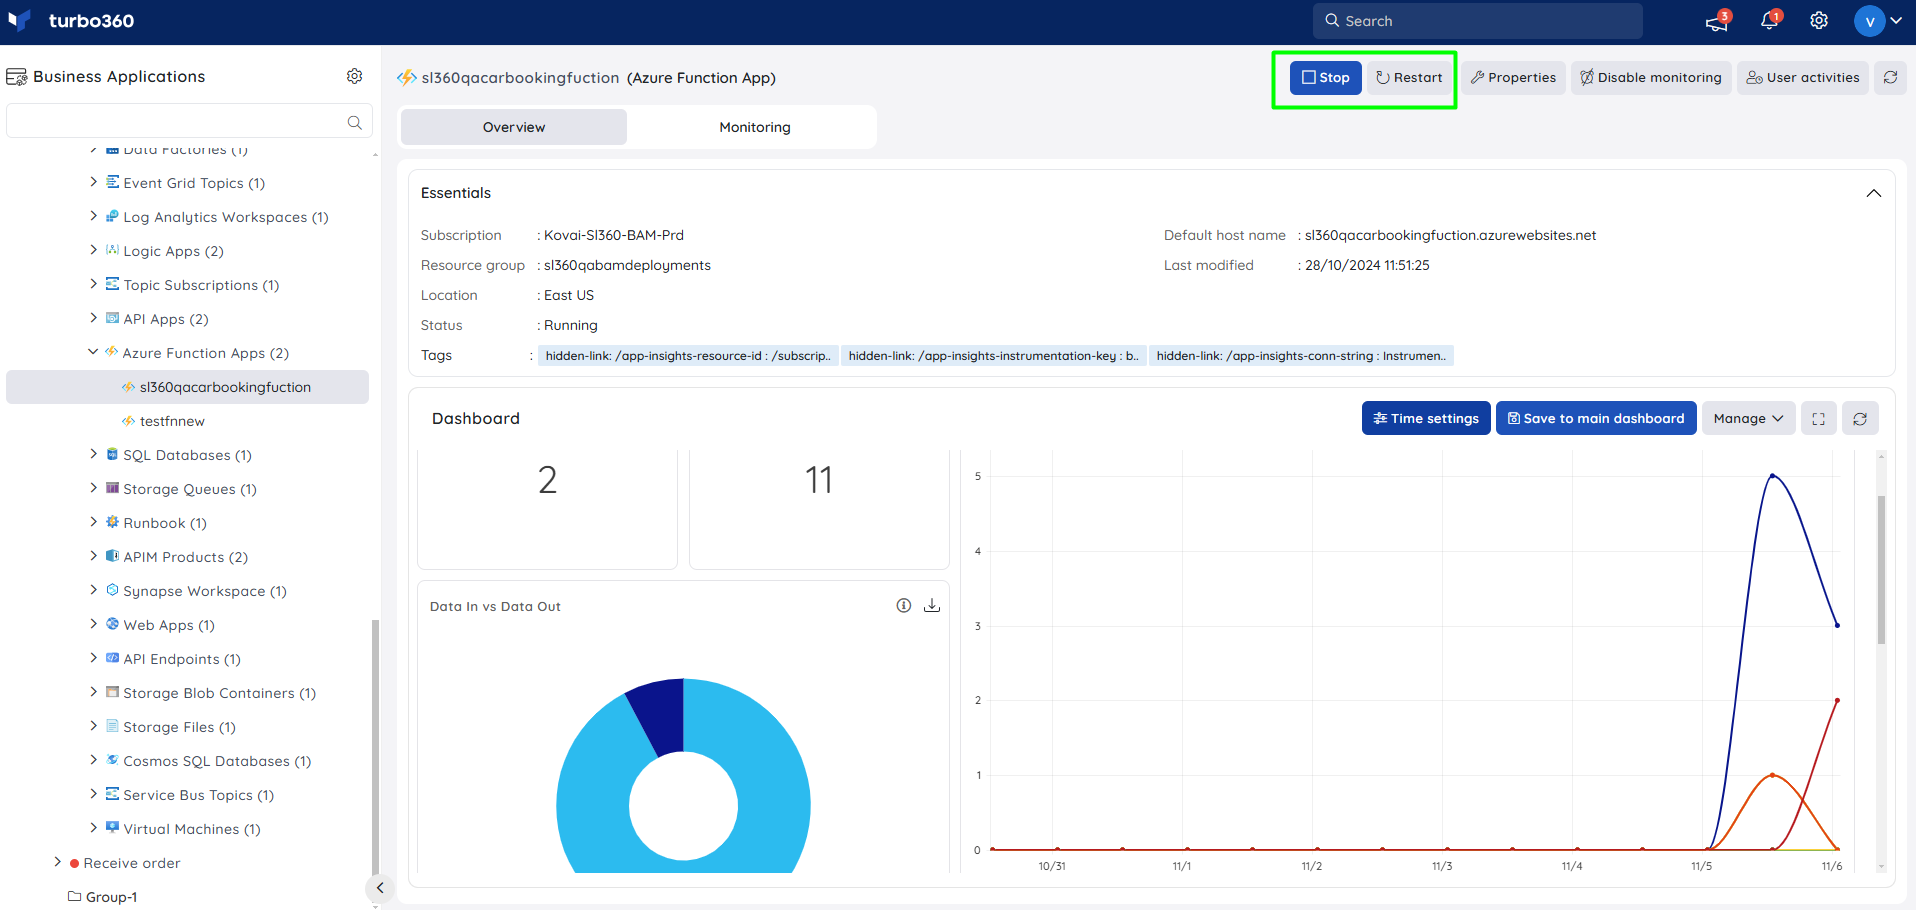
Azure Function Apps can be set to Start, Stop or Restart by clicking the respective options.
Resource Dashboard
Users have access to a default Azure Function App Dashboard, which allows them to stay updated with real-time data through enhanced data visualization.
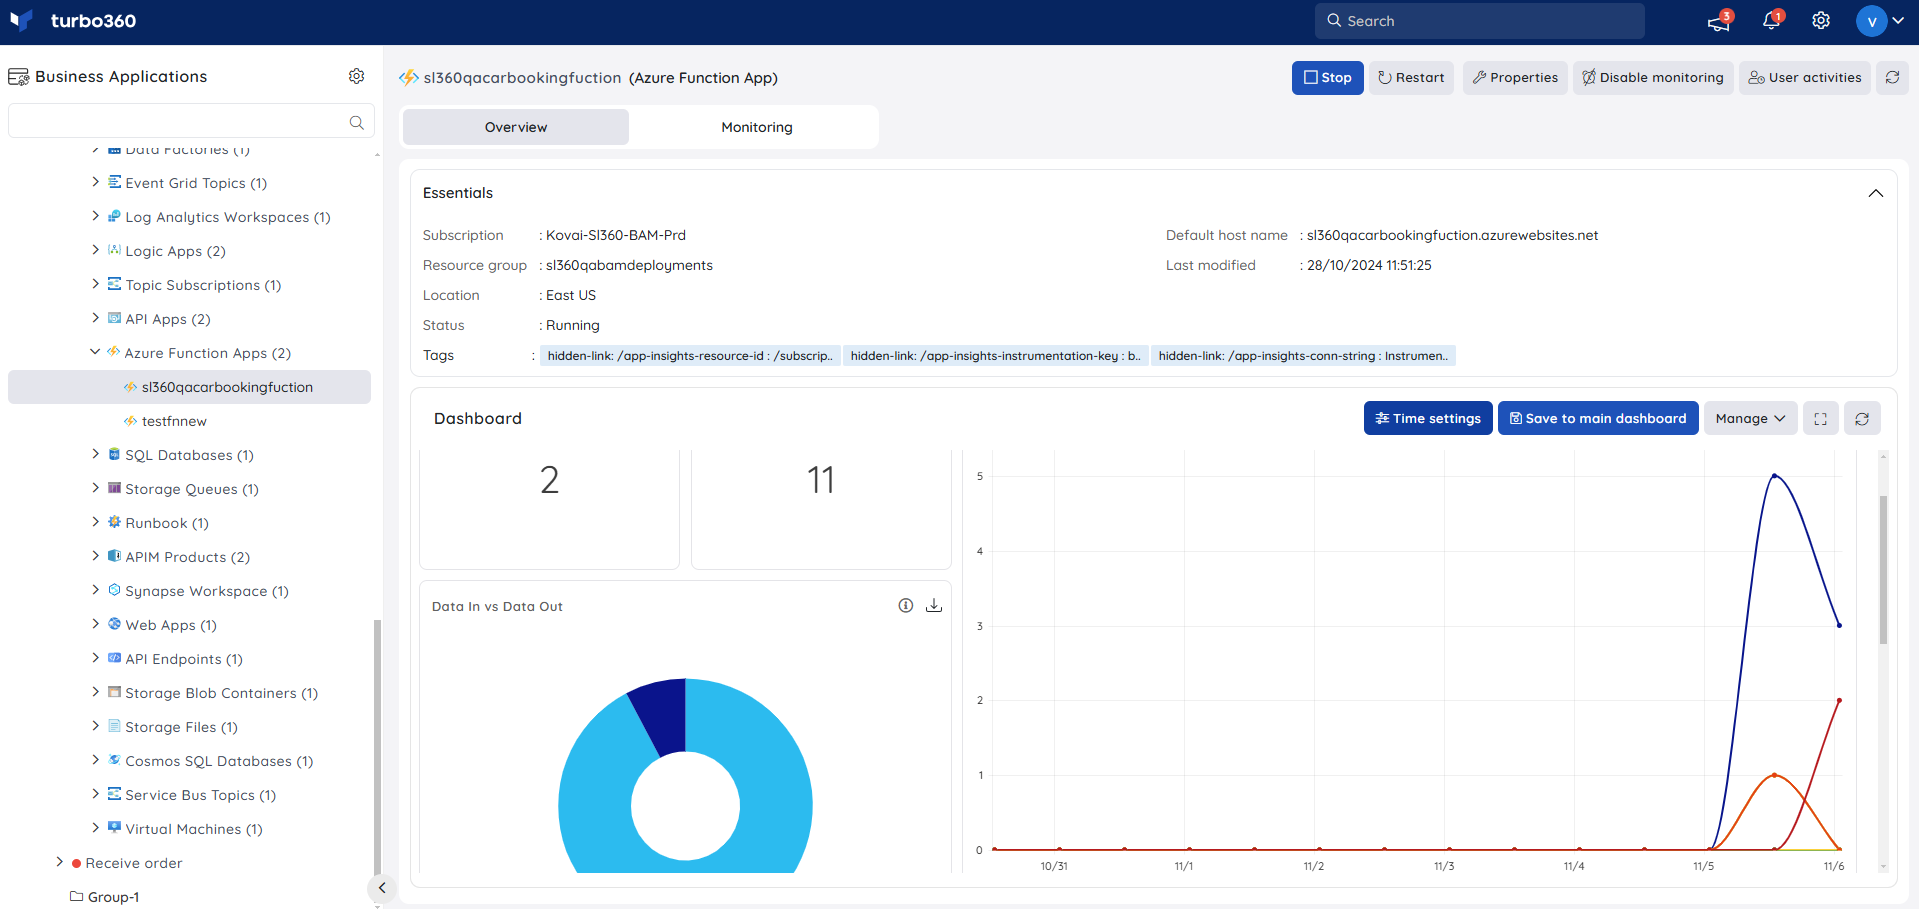
Users are provided the following pre-defined Dashboard widgets, which can be customized to meet their needs.
1. Function Execution Count
2. Requests Count
3. HTTP Errors
4. Data In vs Data Out
5. Average Memory Working Set
6. IO Read vs. IO Write
Monitoring
Availability status monitoring
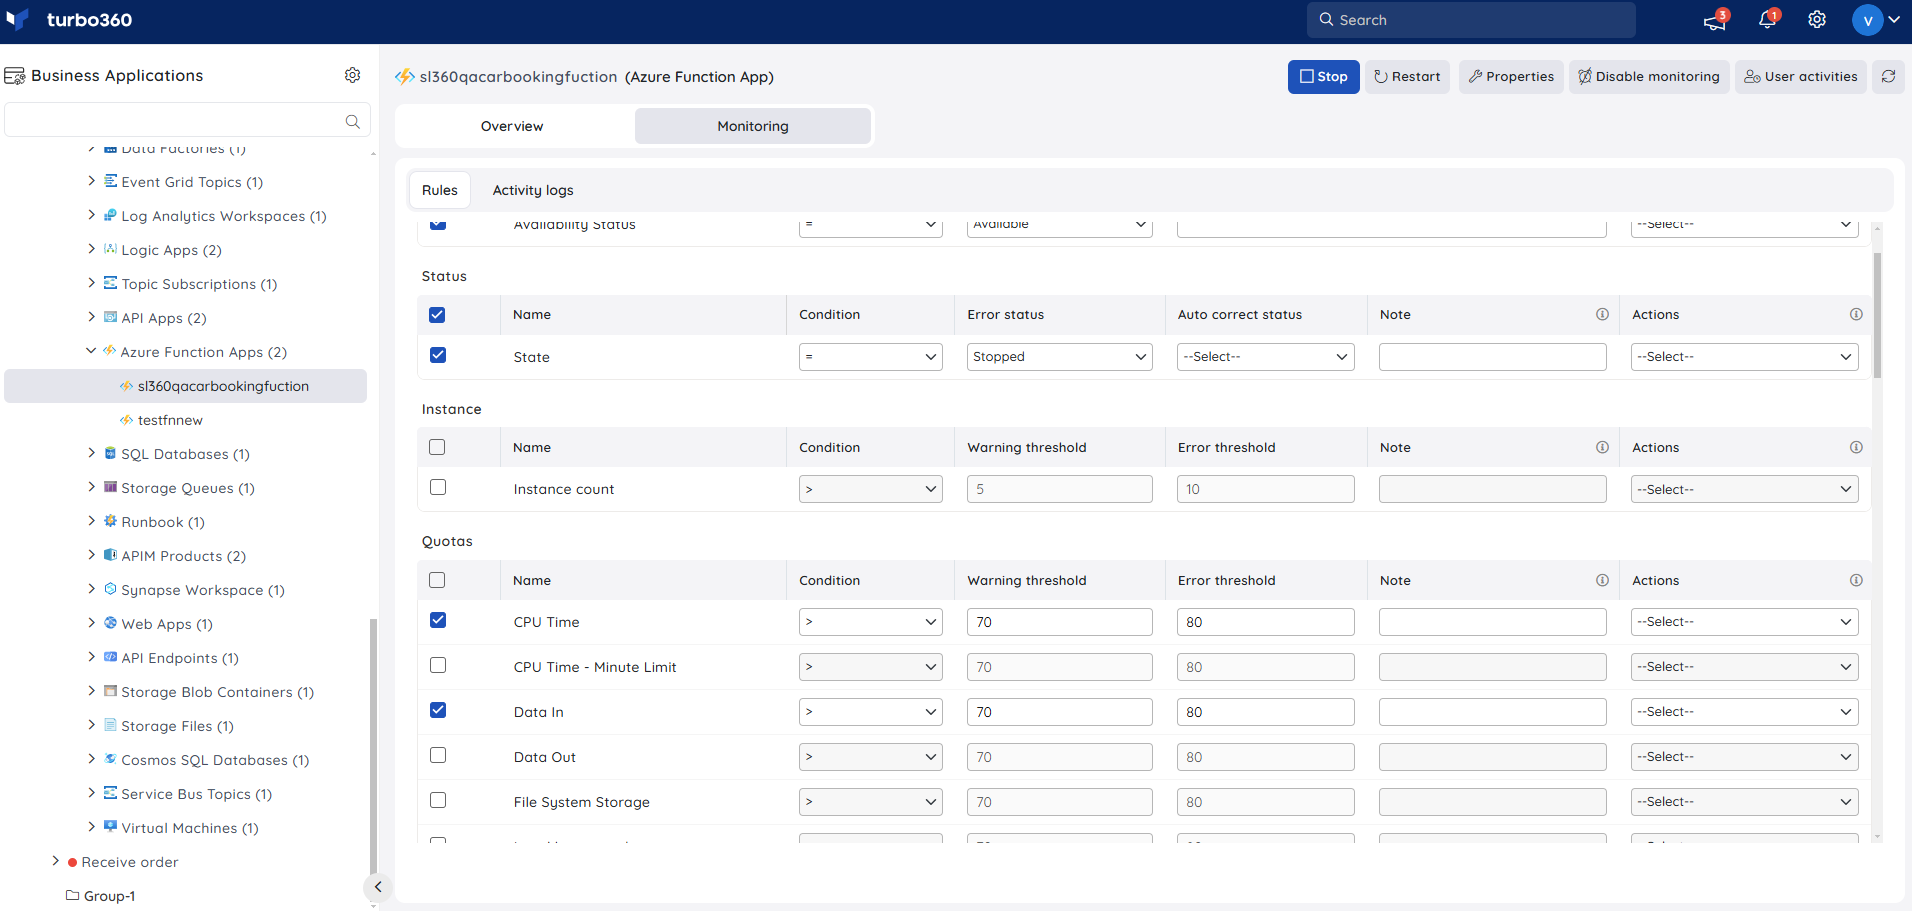
The resource health status of Azure Function Apps can be monitored by using the Availability status monitoring rule.
- Navigate to Azure Function App -> Monitoring
- Configure Availability status rule with the desired threshold
- Click Save
State Monitoring
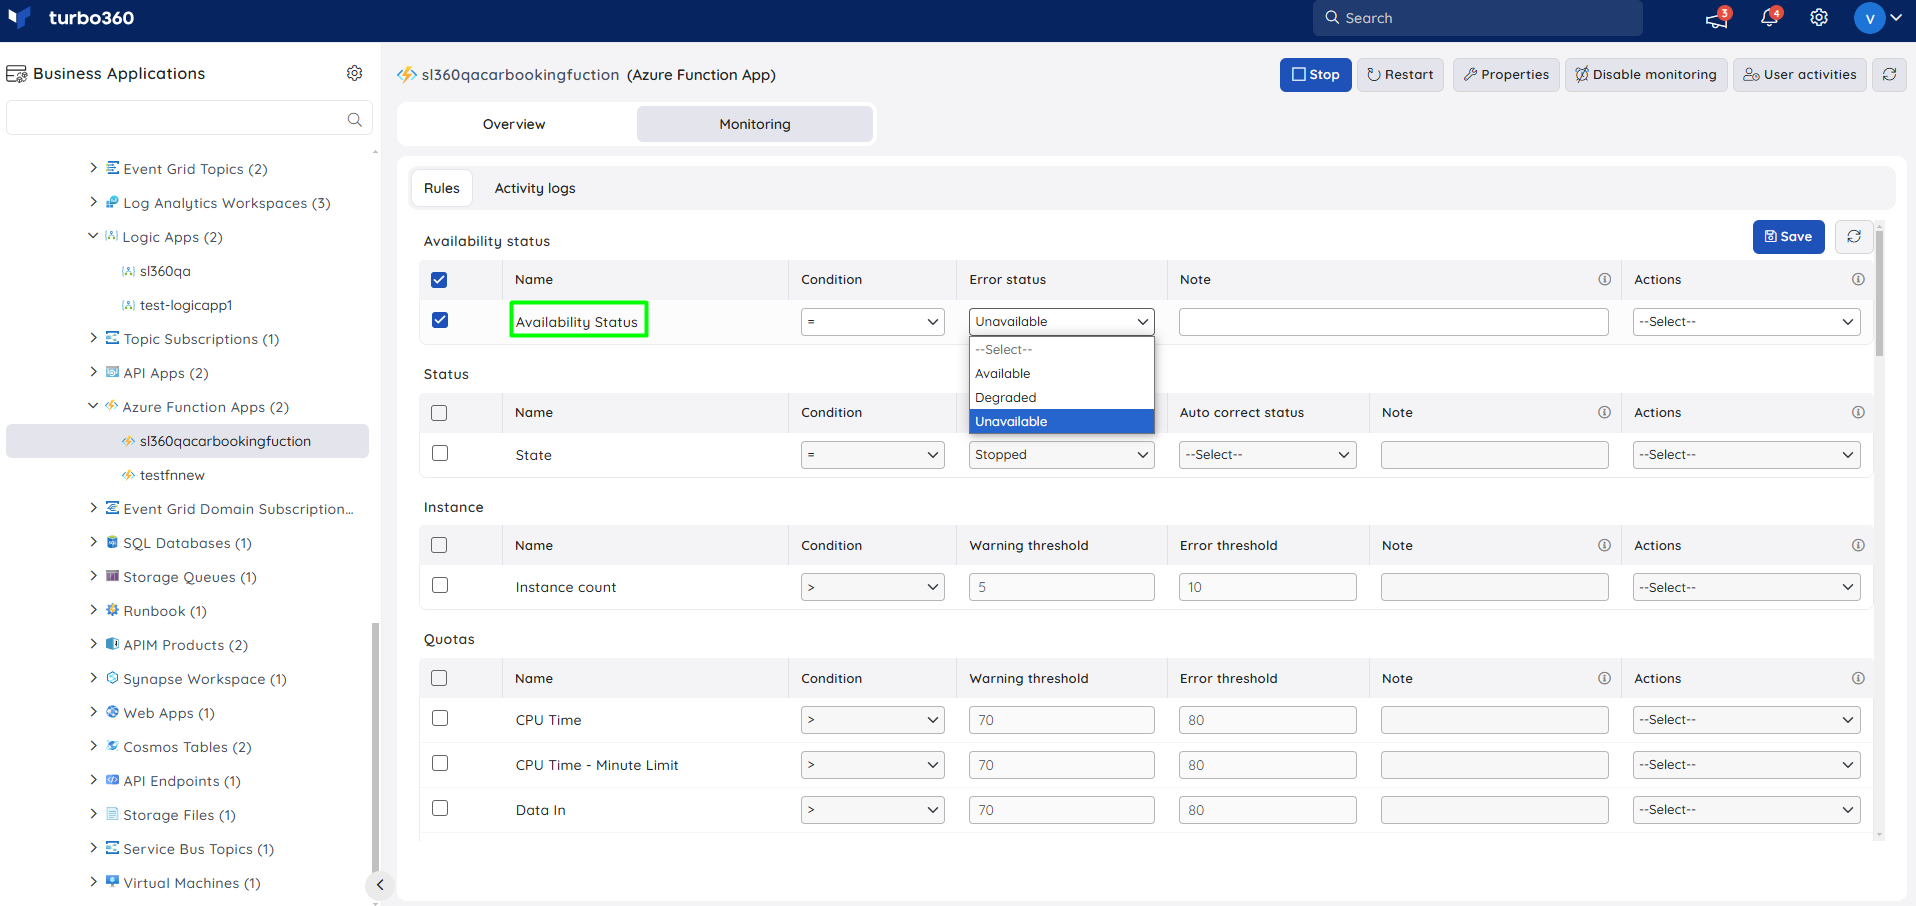
- Navigate to Azure Function App -> Monitoring
- Configure threshold value for State rule under Status category to determine the health state
- Click Save
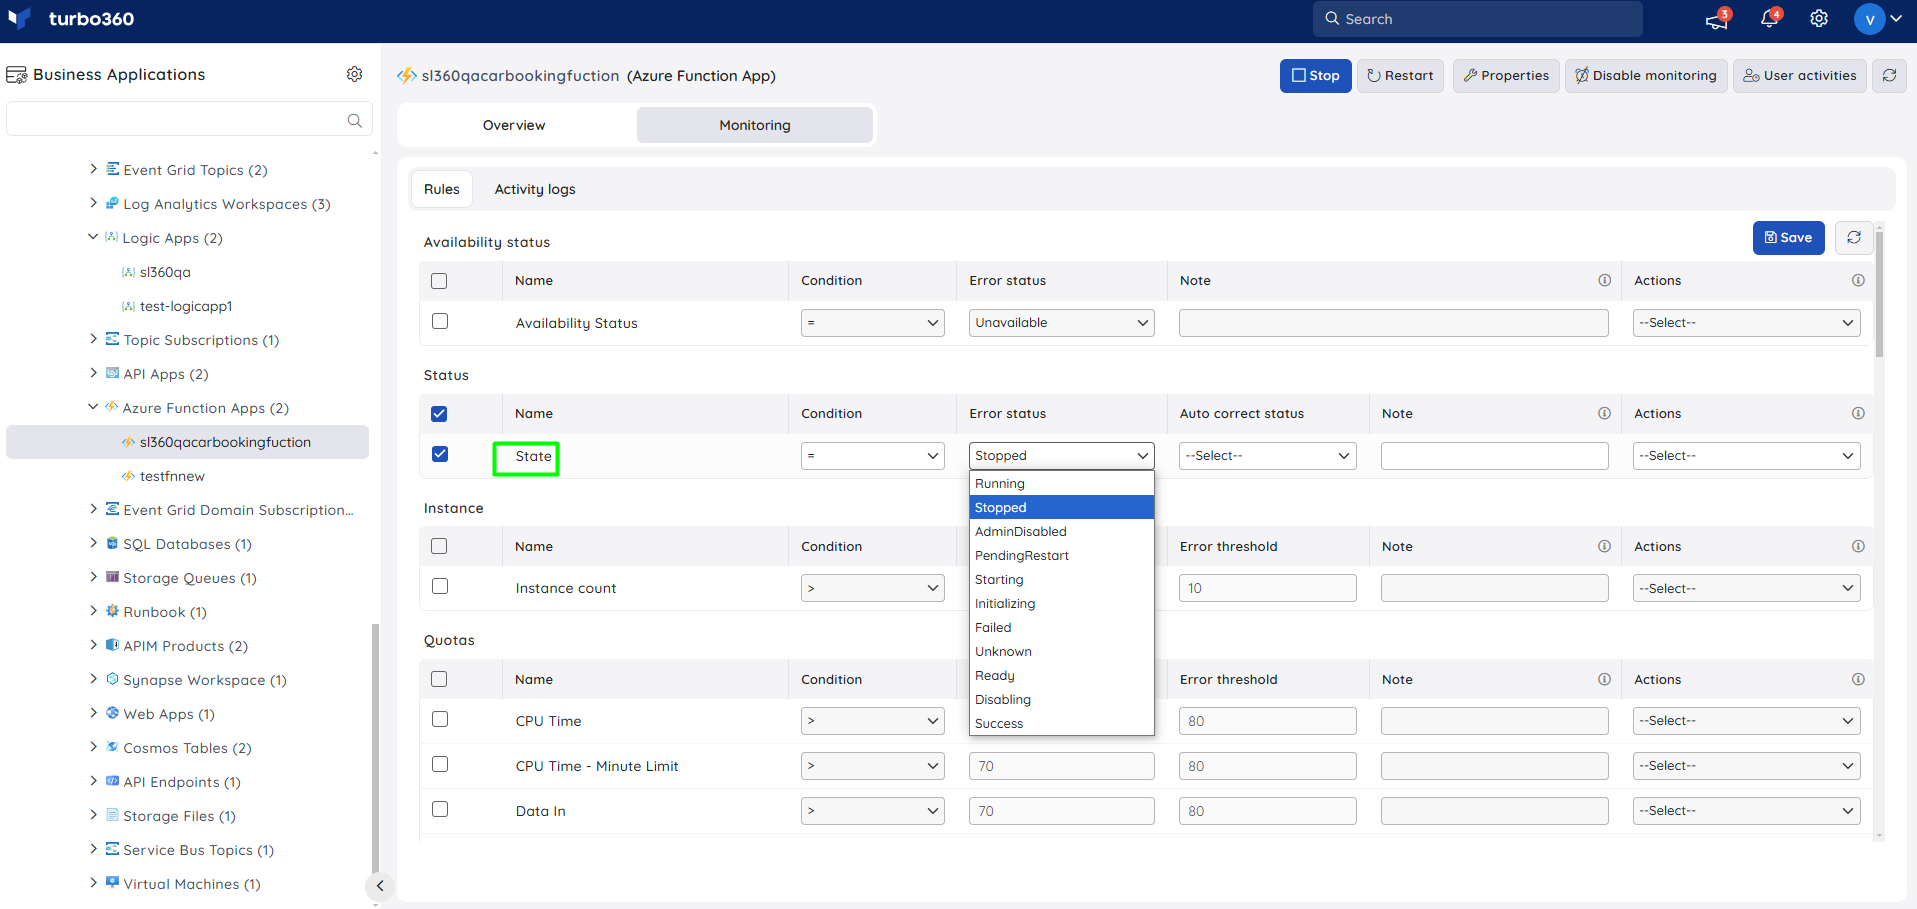
The monitoring rule will be saved for Azure Function App, and the monitoring state will be reflected after every monitoring cycle.
Instance Monitoring
- Navigate to Azure Function App -> Monitoring
- Configure threshold value for the Instance of the function to determine the health state
- Click Save
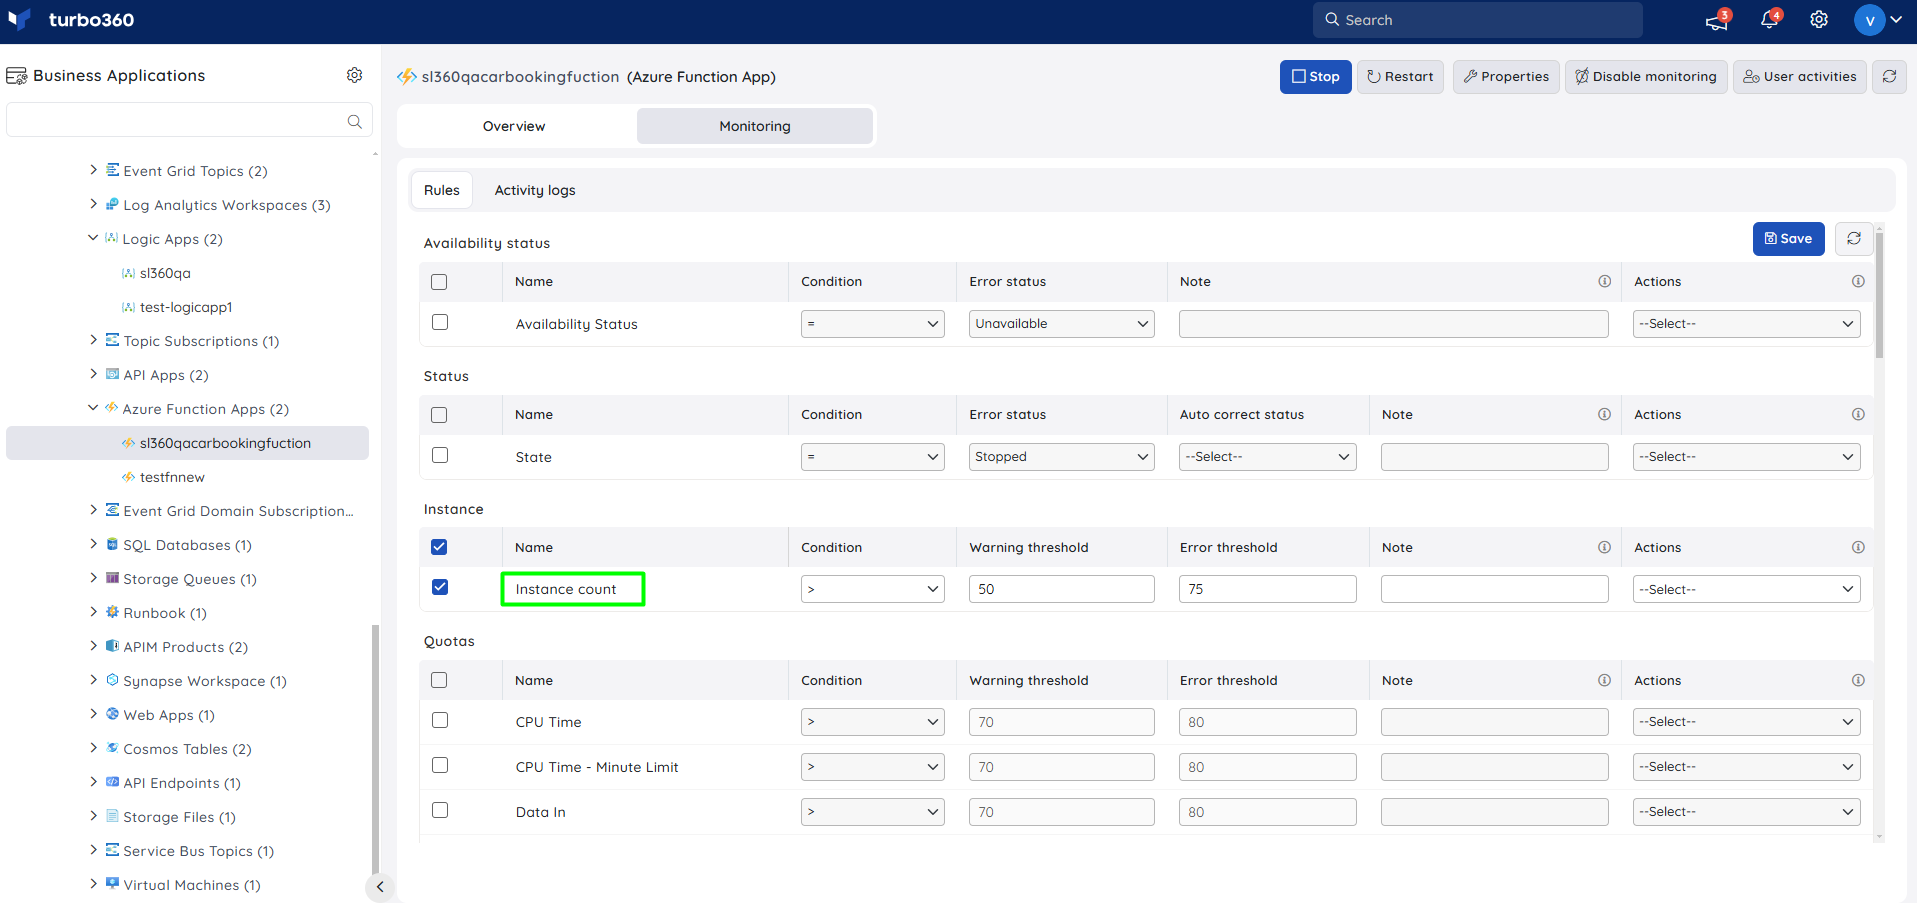
The Instance monitoring rule will be saved for Azure Function App, and the monitoring state will be reflected after every monitoring cycle.
Quotas Monitoring
- Navigate to Azure Function App -> Monitoring
- Configure threshold value for the quotas of the function to determine the health state
- Click Save
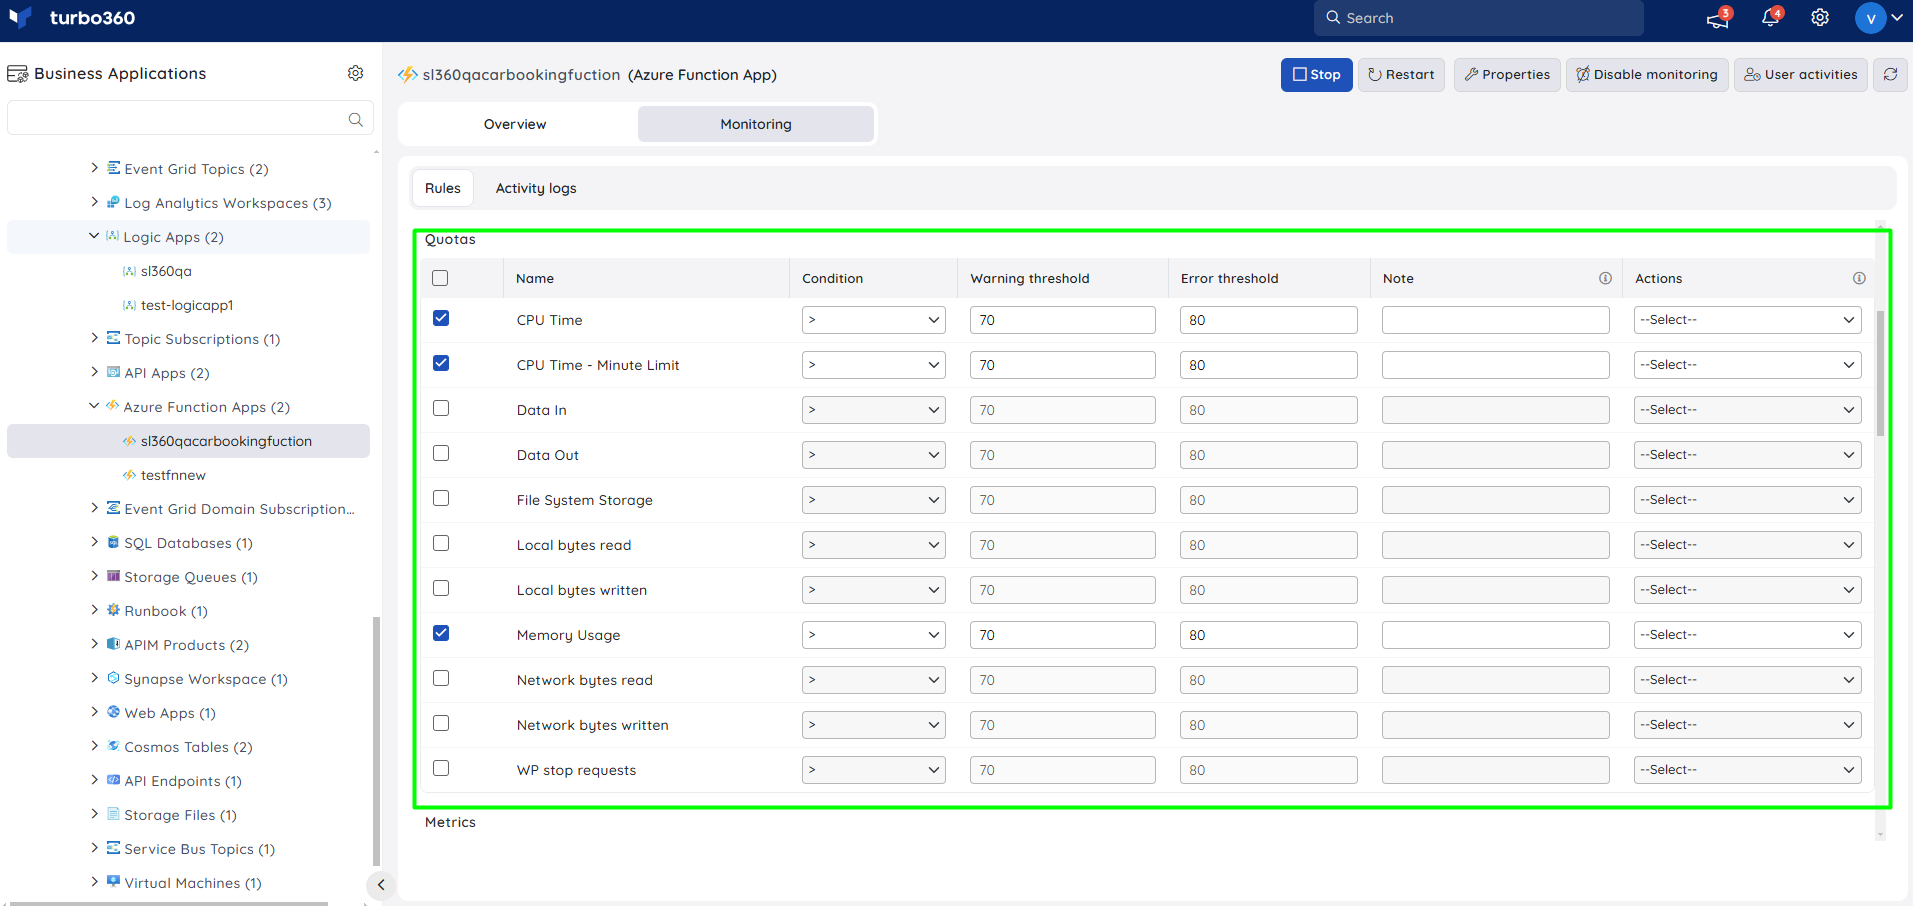
The Quotas monitoring rule will be saved for Azure Function App, and the monitoring state will be reflected after every monitoring cycle.
Metrics Monitoring
- Navigate to Azure Function App -> Monitoring
- Configure threshold value for the metrics of the function to determine the health state
- Click Save
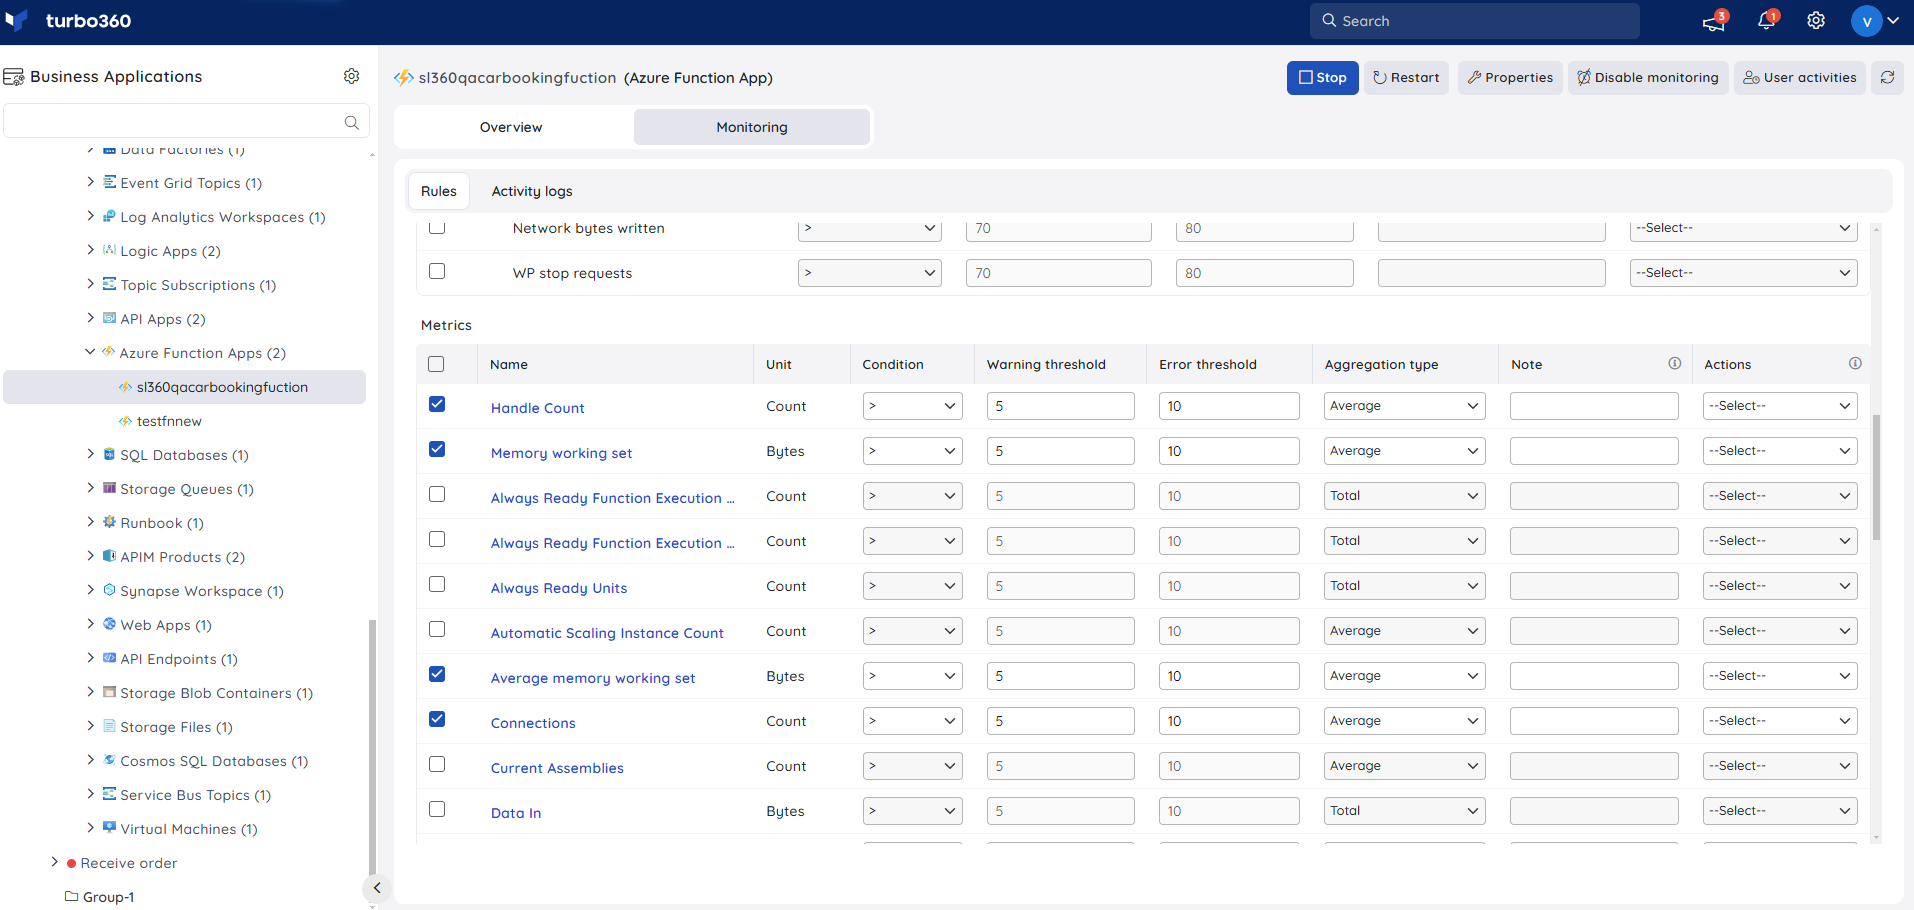
The threshold values can also be provided with any metric name, defining the monitoring rule to be violated when the metric value configured at the threshold field is met.
Monitoring rules will be saved for Azure Function App, and the monitoring state for the metrics will be reflected after every monitoring cycle.
Monitoring Recommendations
This section will outline some recommendations for monitoring your function app. For an Azure Function App you can monitor things at the app and the individual function level.
Function App
The settings that can be configured for monitoring the function app itself are covered here. Note that these settings are common to all functions within the function app.
State Monitoring
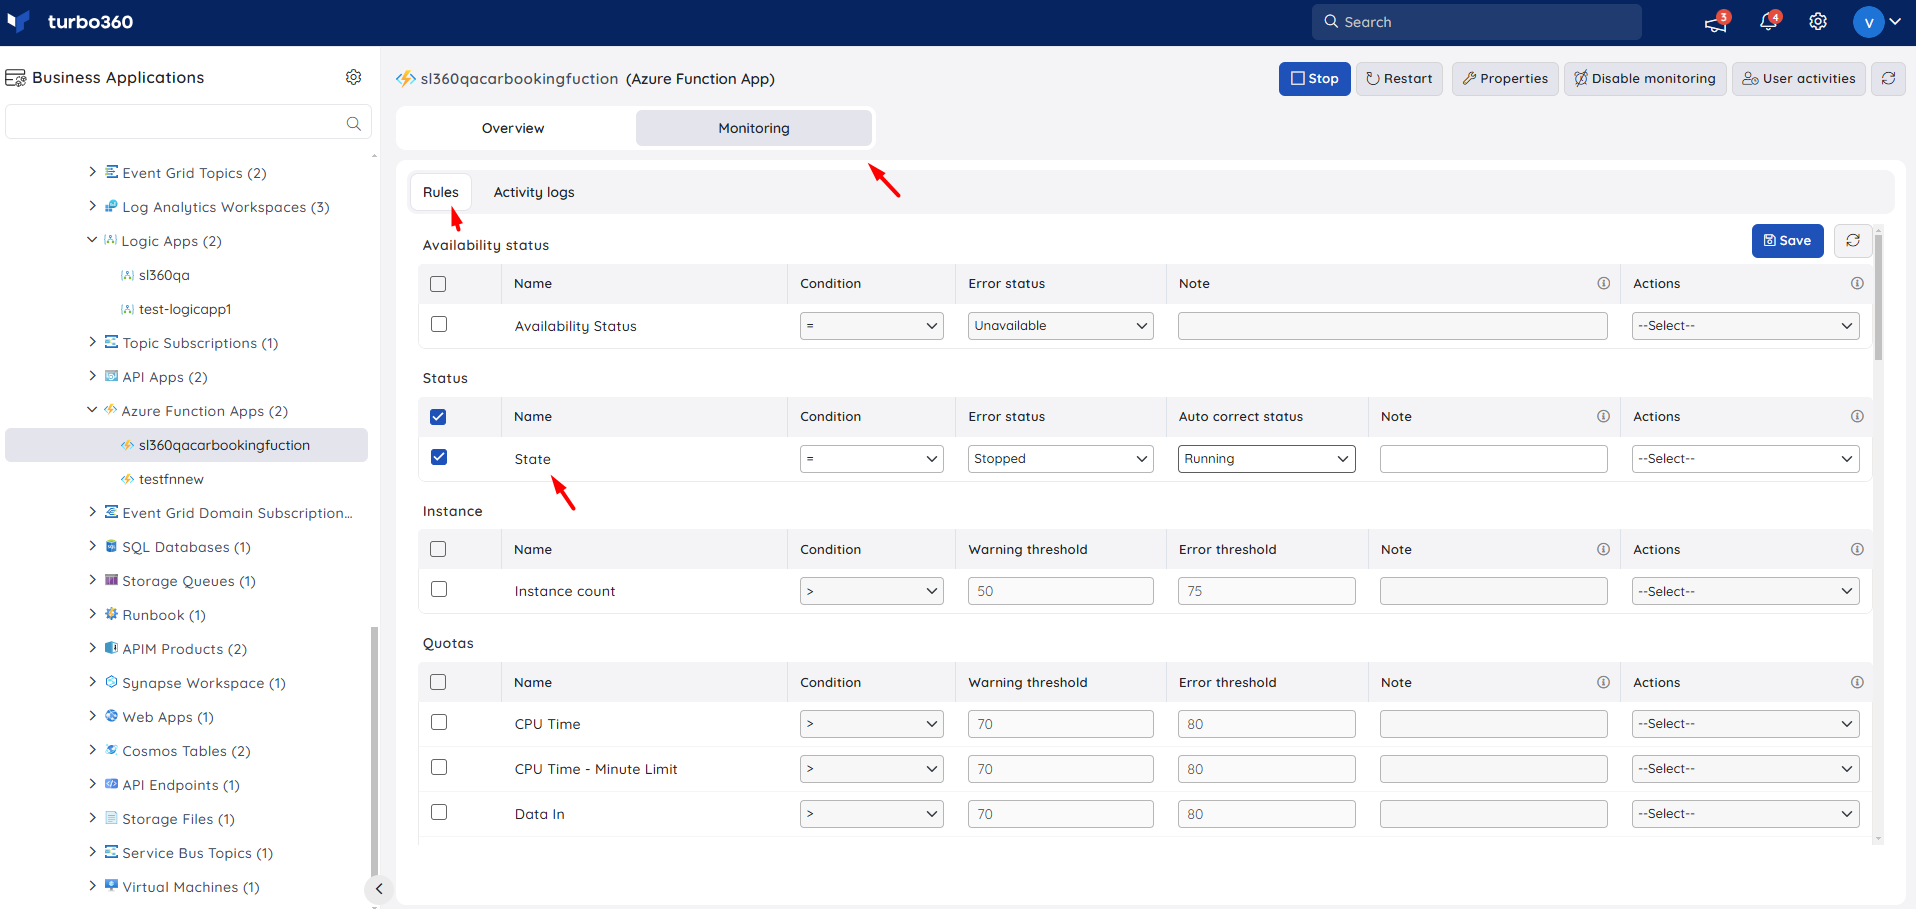
Below you can see where I can configure the monitoring to check for the state. If the function app is not in the running state then it will raise an error.
In the case below I have also configured an auto-correct rule so that it will change it back to running.
Instance Count
You may have a scenario where you want to make assertions about the number of nodes your function app should be running. In the below case my function plan is configured to scale out automatically under load but I have configured Turbo360 to raise an alert if the instance goes beyond 1.
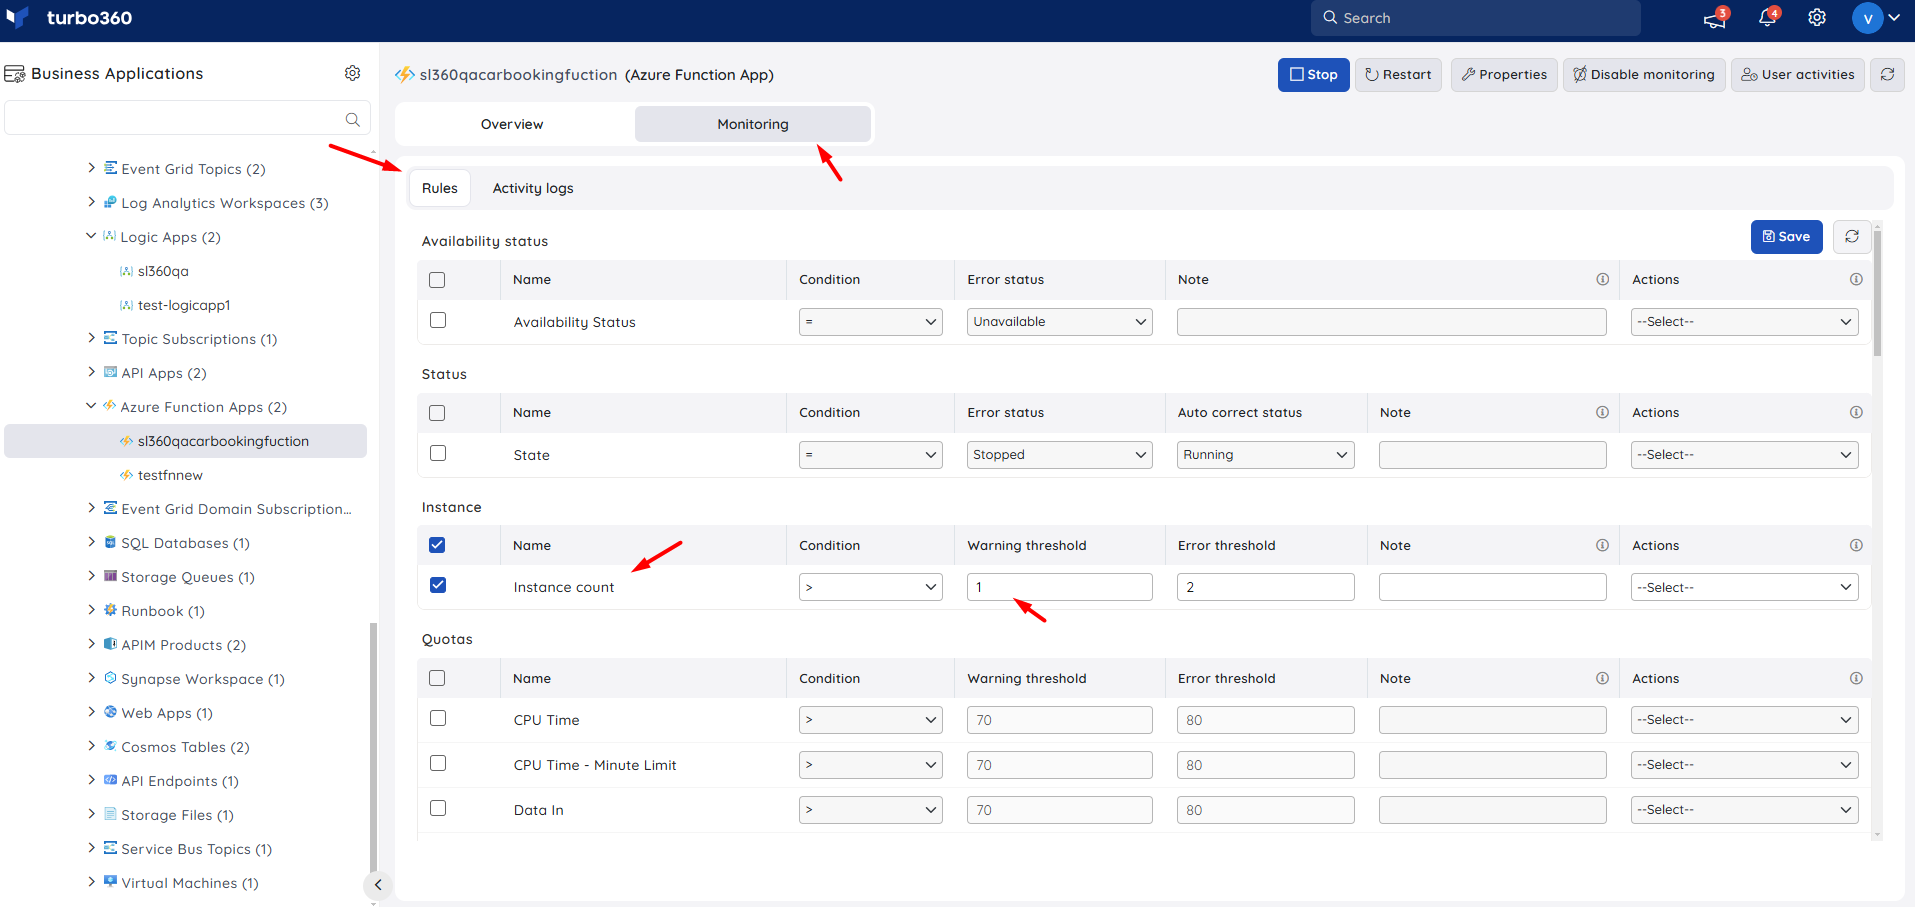
You may also use this feature to alert if your app scales in below a specific number of nodes.
Metrics
The function app provides several metrics that you may want to monitor.
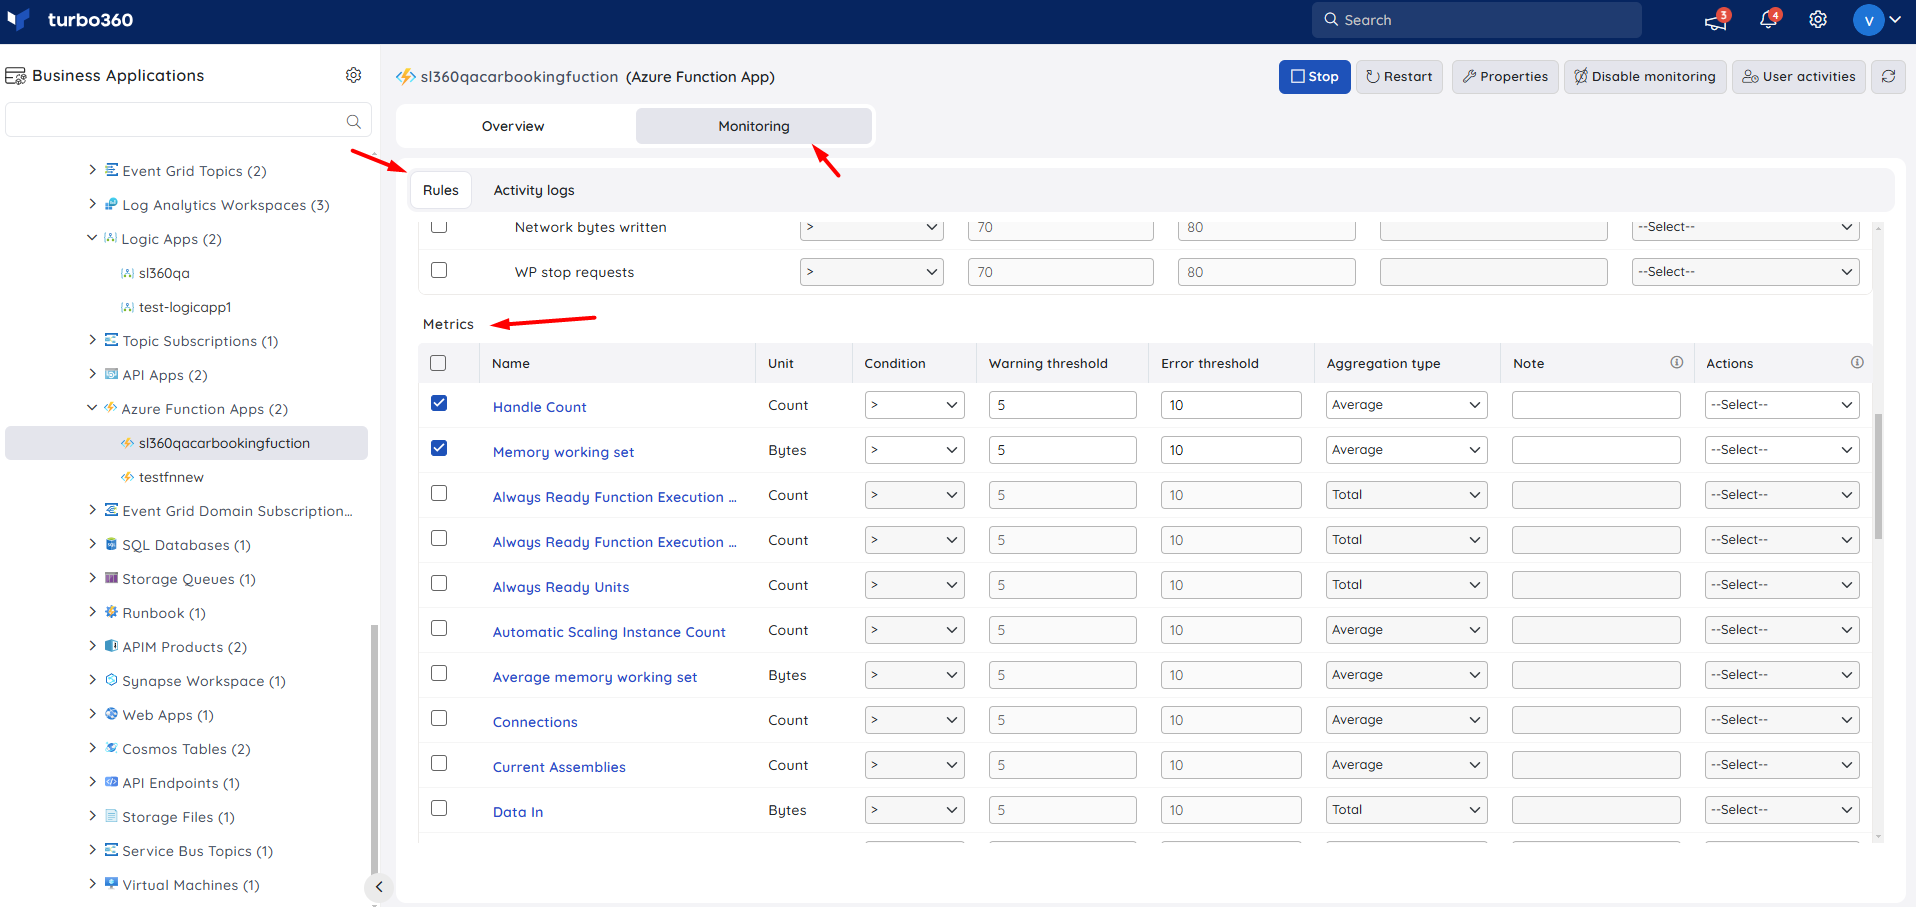
The most common metrics you are likely to want to monitor are below:
| Metric | Warning Threshold | Error threshold |
|---|---|---|
| Connections | Varies | Varies |
| Http 4xx | Varies | Varies |
| Http Server Errors | Varies | Varies |
| Requests | Varies | Varies |
| Response Time | Varies | Varies |
| Private Bytes | Varies | Varies |
The values for these metrics will vary based on the app service plan you run the function app on and the usage of your app. Its important to check the values to ensure they make sense for your application.
Individual Functions
You can also monitor individual functions within Turbo360. By adding individual functions within the Function App to your Business Appliction you can do the monitoring discussed below.
State Monitoring
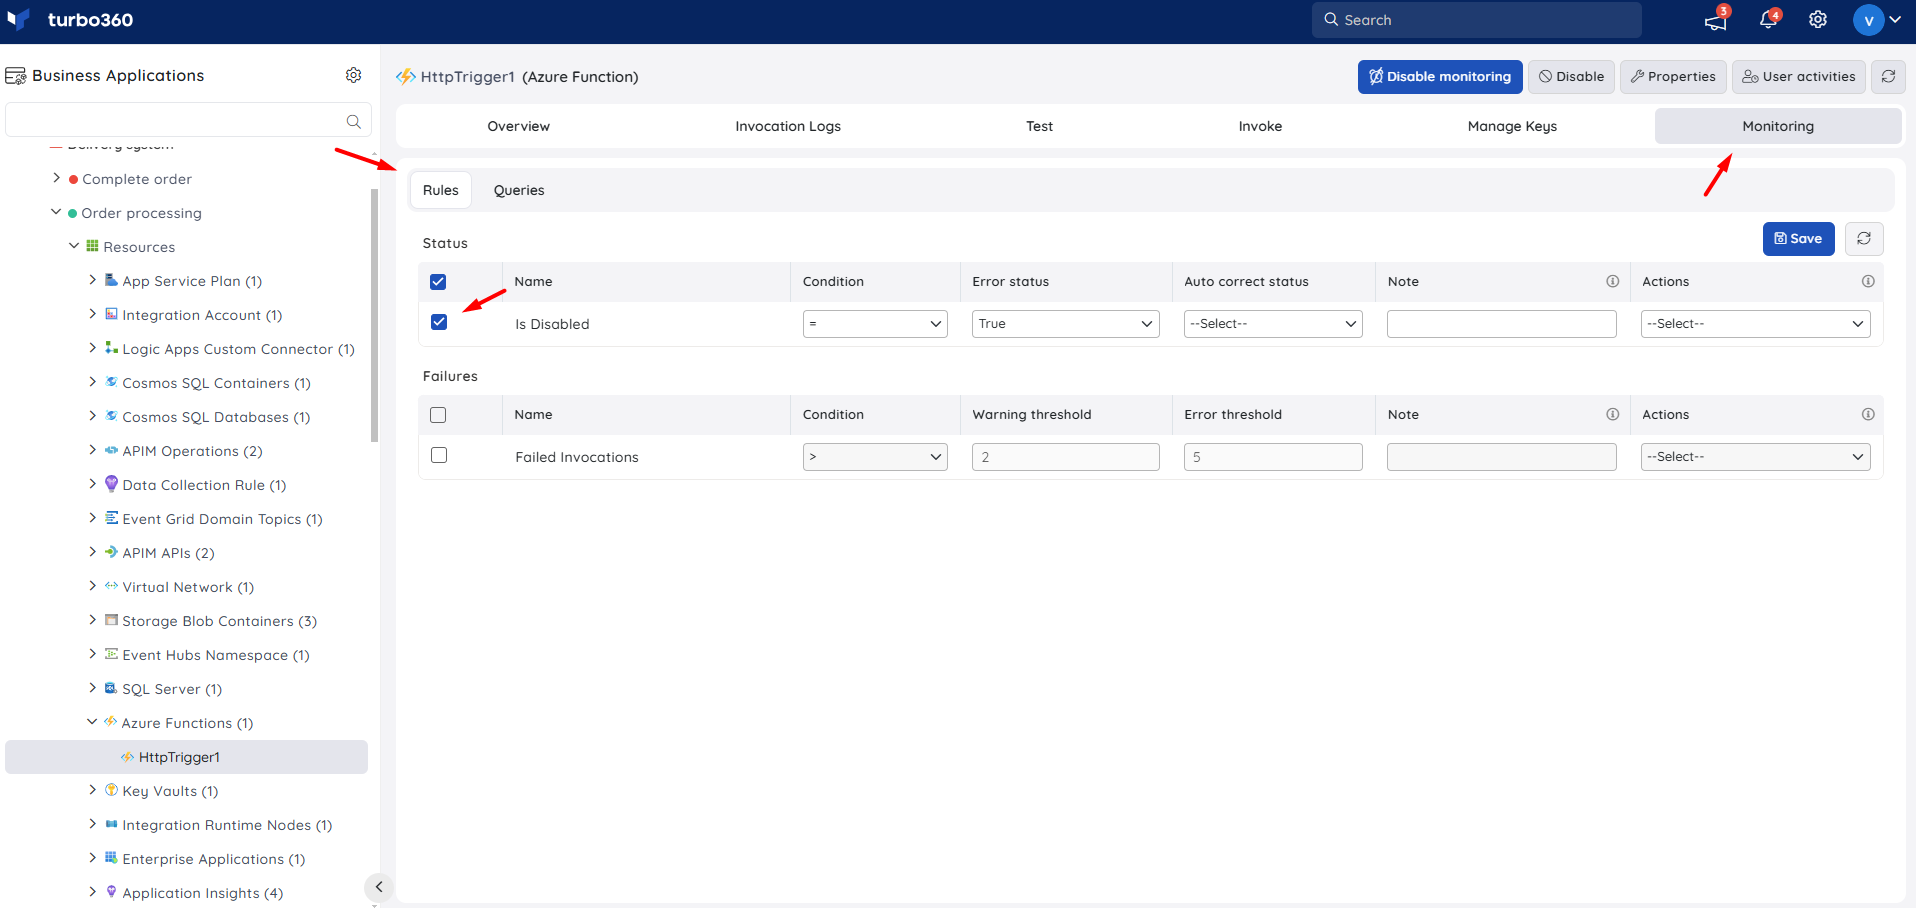
The state monitoring allows you to test the status of the function is not disabled.
Invocation Monitoring
Invocation monitoring will check the run history for individual functions and will allow you to raise an error if you get beyond a specific number of errors.
Log Monitoring
If you add the app insights instance associated with the Function App to your Turbo360 Business Application then you can also add query monitoring. In the below query I am looking at the specific response time for the individual function and raising an alert if it is beyond expectation.
More Info
There is more info on the various metrics related to function apps on the below link:
https://learn.microsoft.com/en-us/azure/azure-functions/monitor-functions-reference

