Budget planner
- 19 Feb 2026
- 3 Minutes to read
- Print
- DarkLight
- Download PDF
Budget planner
- Updated on 19 Feb 2026
- 3 Minutes to read
- Print
- DarkLight
- Download PDF
Article summary
Did you find this summary helpful?
Thank you for your feedback!
Introduction
The Budget planner in Cost Analyzer enables analysis of historical Azure cost trends and supports forecasting future spend based on projected estimates or defined growth percentages. This allows users to model anticipated cost changes and improve budgeting accuracy.
For example, if Azure spending has increased by 10% month-over-month due to workload growth, the Budget planner can project future costs based on that trend. Alternatively, users can apply a custom growth rate such as a 25% expected increase from onboarding new services to estimate future budget impact.
Budget planner
The Budget planner provides a visual representation of cost trends to help users evaluate spending patterns and plan effectively. The analysis time range is fully customizable, allowing users to align projections with monthly, quarterly, or yearly financial planning cycles.
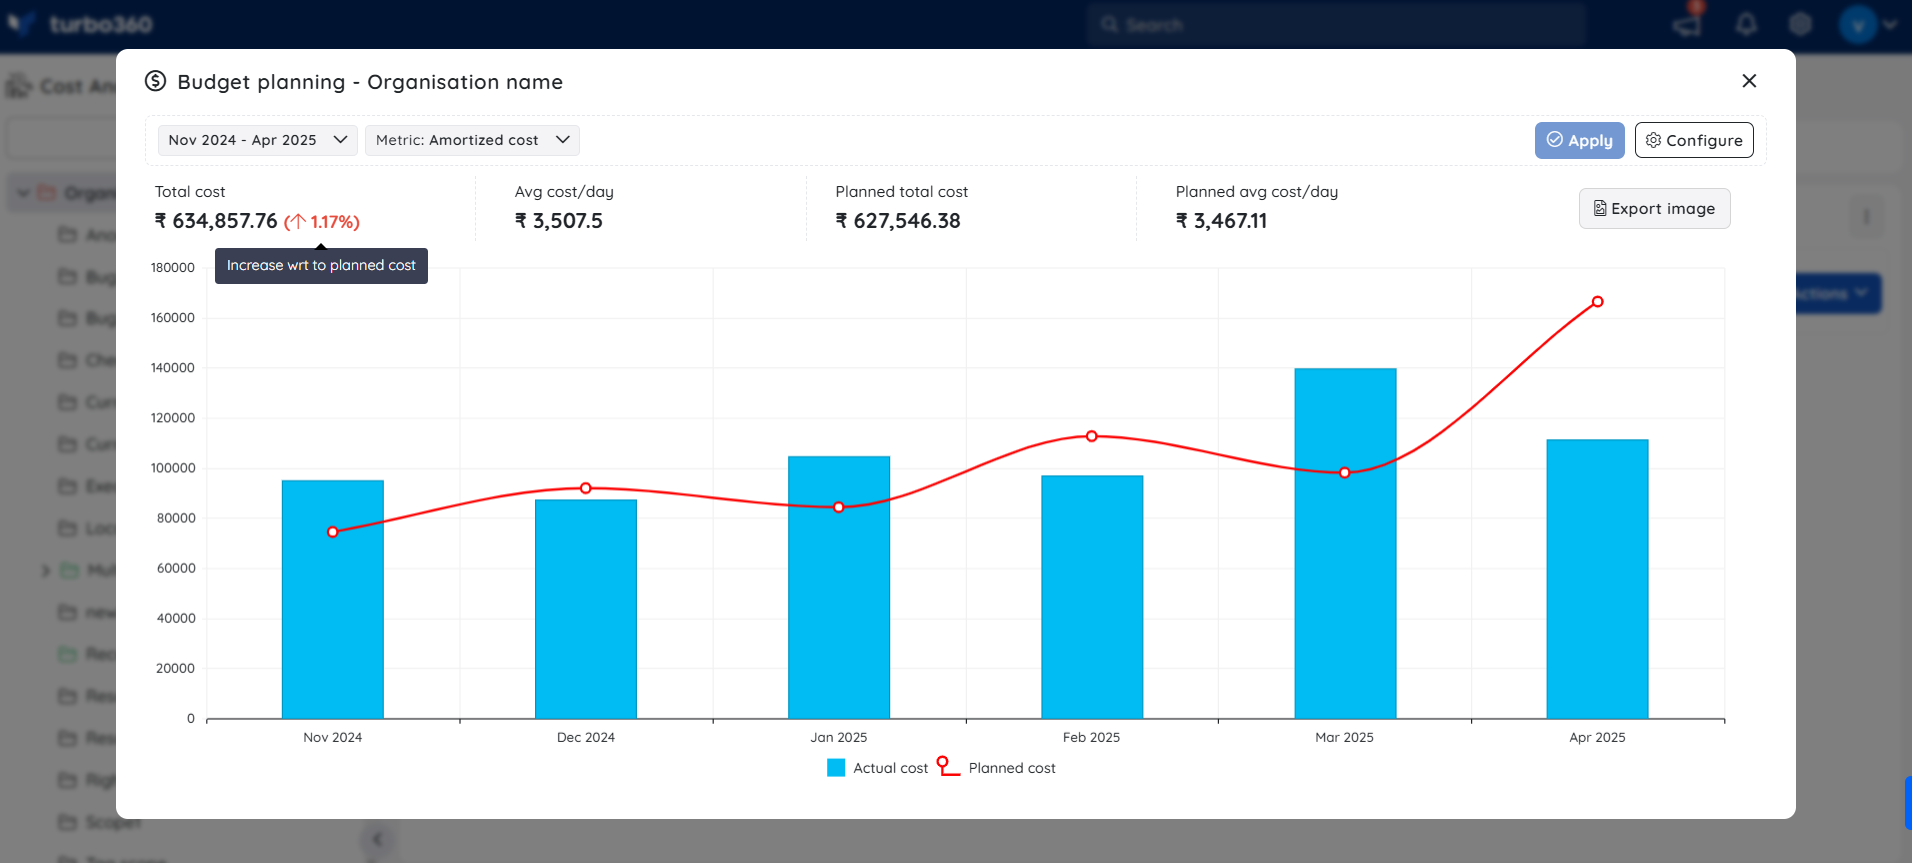
At a glance, the budget planner offers a concise summary of key financial metrics, including:
- Total cost for the selected period
- Planned (forecasted) cost based on user-defined targets
- Average daily cost, providing insight into the pace of expenditure
- Percentage change, showing how current spending compares to previous periods or projections
To support proactive budgeting, the tool overlays red dotted lines on the cost trend chart. These lines visually represent projected costs, which can be calculated using either a specific anticipated value or a growth rate defined by the user. This allows teams to compare actual spending against forecasted trends and adjust their budgets or usage accordingly.
Whether an organization is scaling their operations, staying within a defined budget, or assessing financial performance, the budget planner provides a solid, data-driven basis for informed and strategic decision-making.
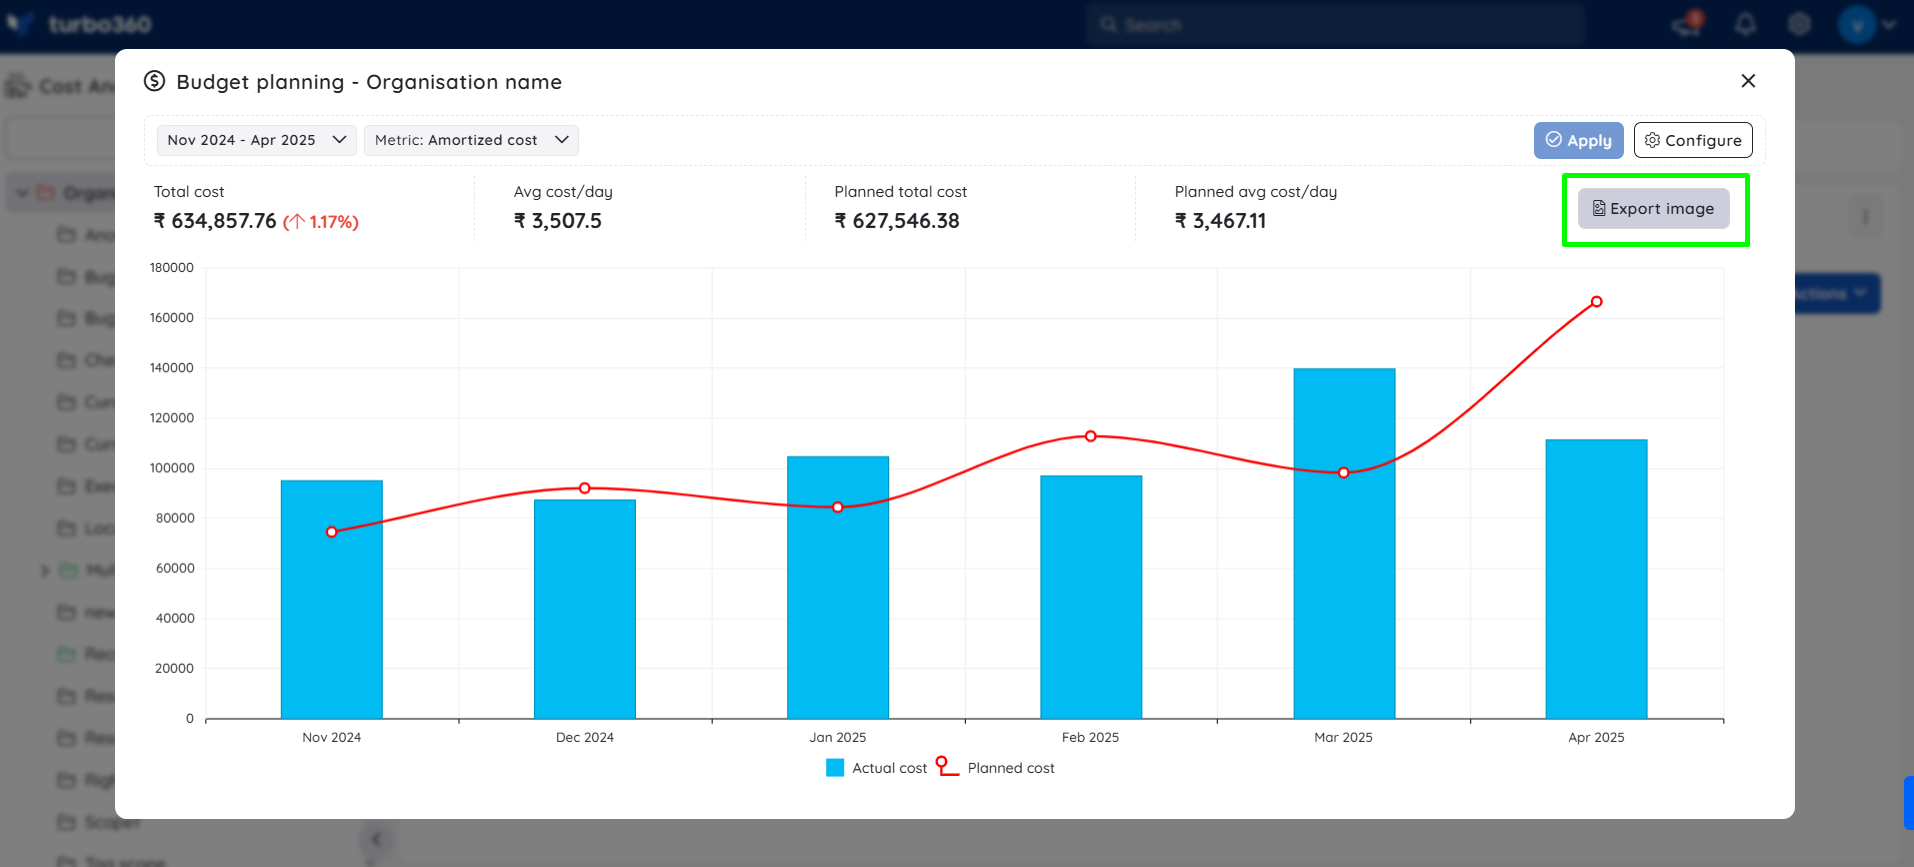
Export the cost trend visualization using the Export Image button to seamlessly integrate it into business presentations.
Planner configuration
To configure projected costs or growth rates in the Budget Planner:
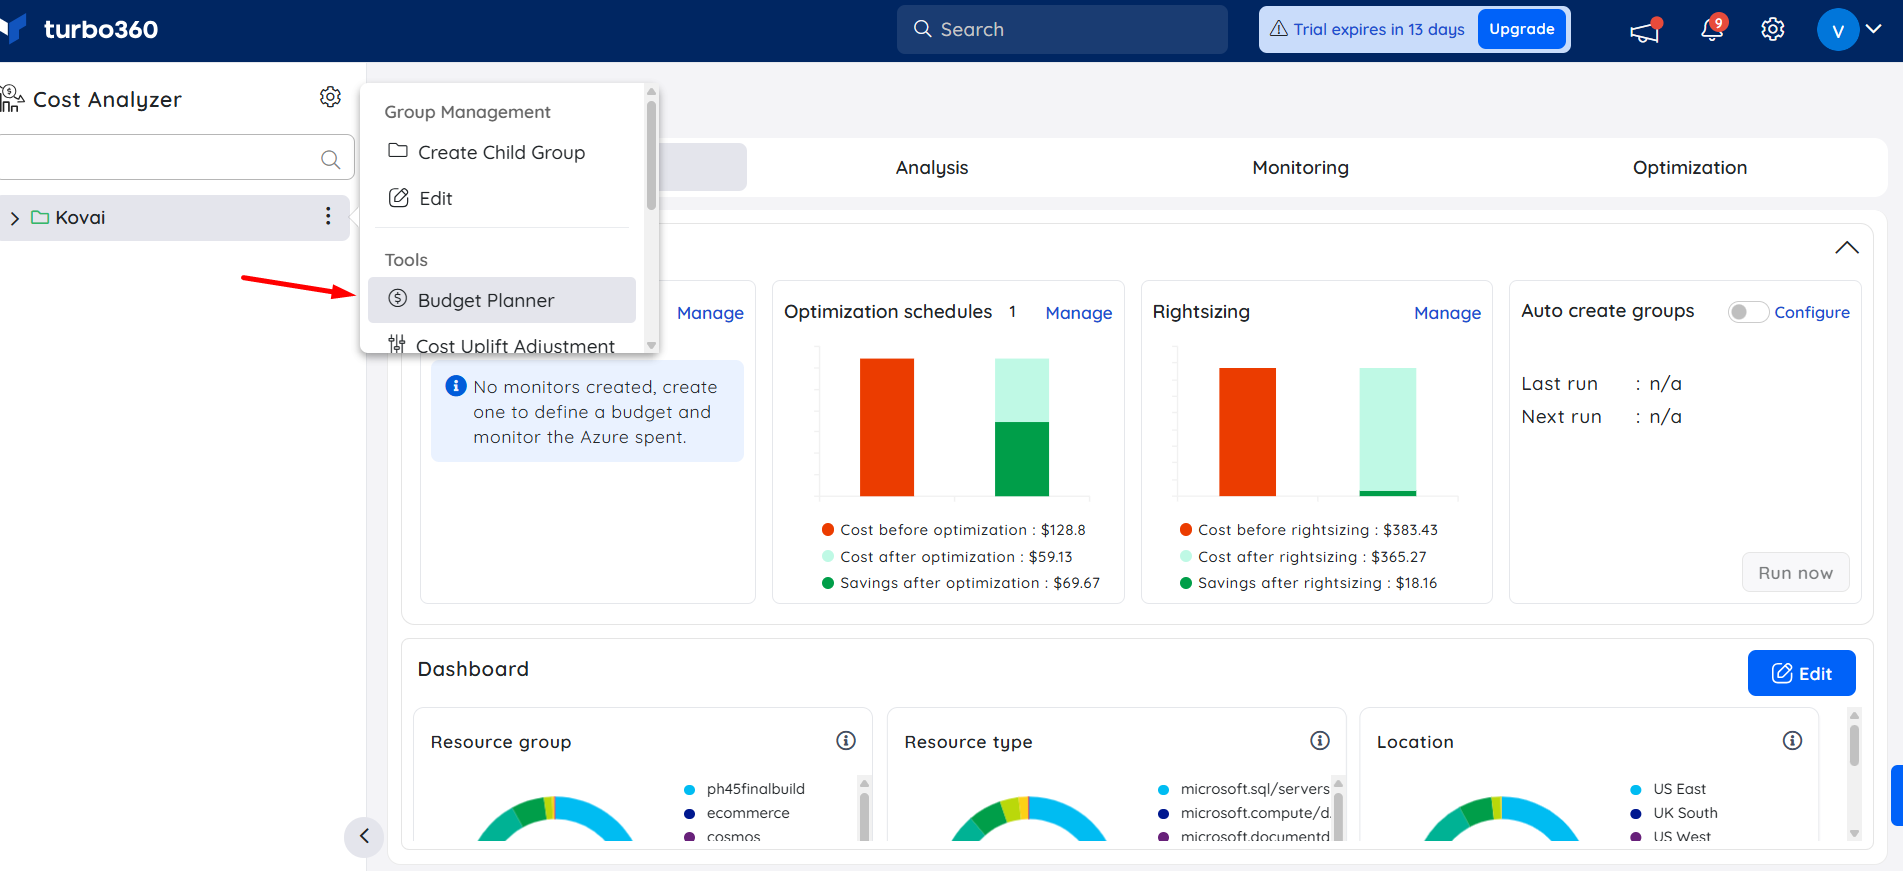
- In the tree view, select the** three-dot menu** next to the required cost group and navigate to Tools -> Budget planner.
- Click Configure -> Add config, choose the target month, and enter either a planned cost amount or a growth percentage.
- (Optional) Add a note for context or justification.
- Enable the toggle in the Actions menu to apply the same planned value to upcoming months, if required.
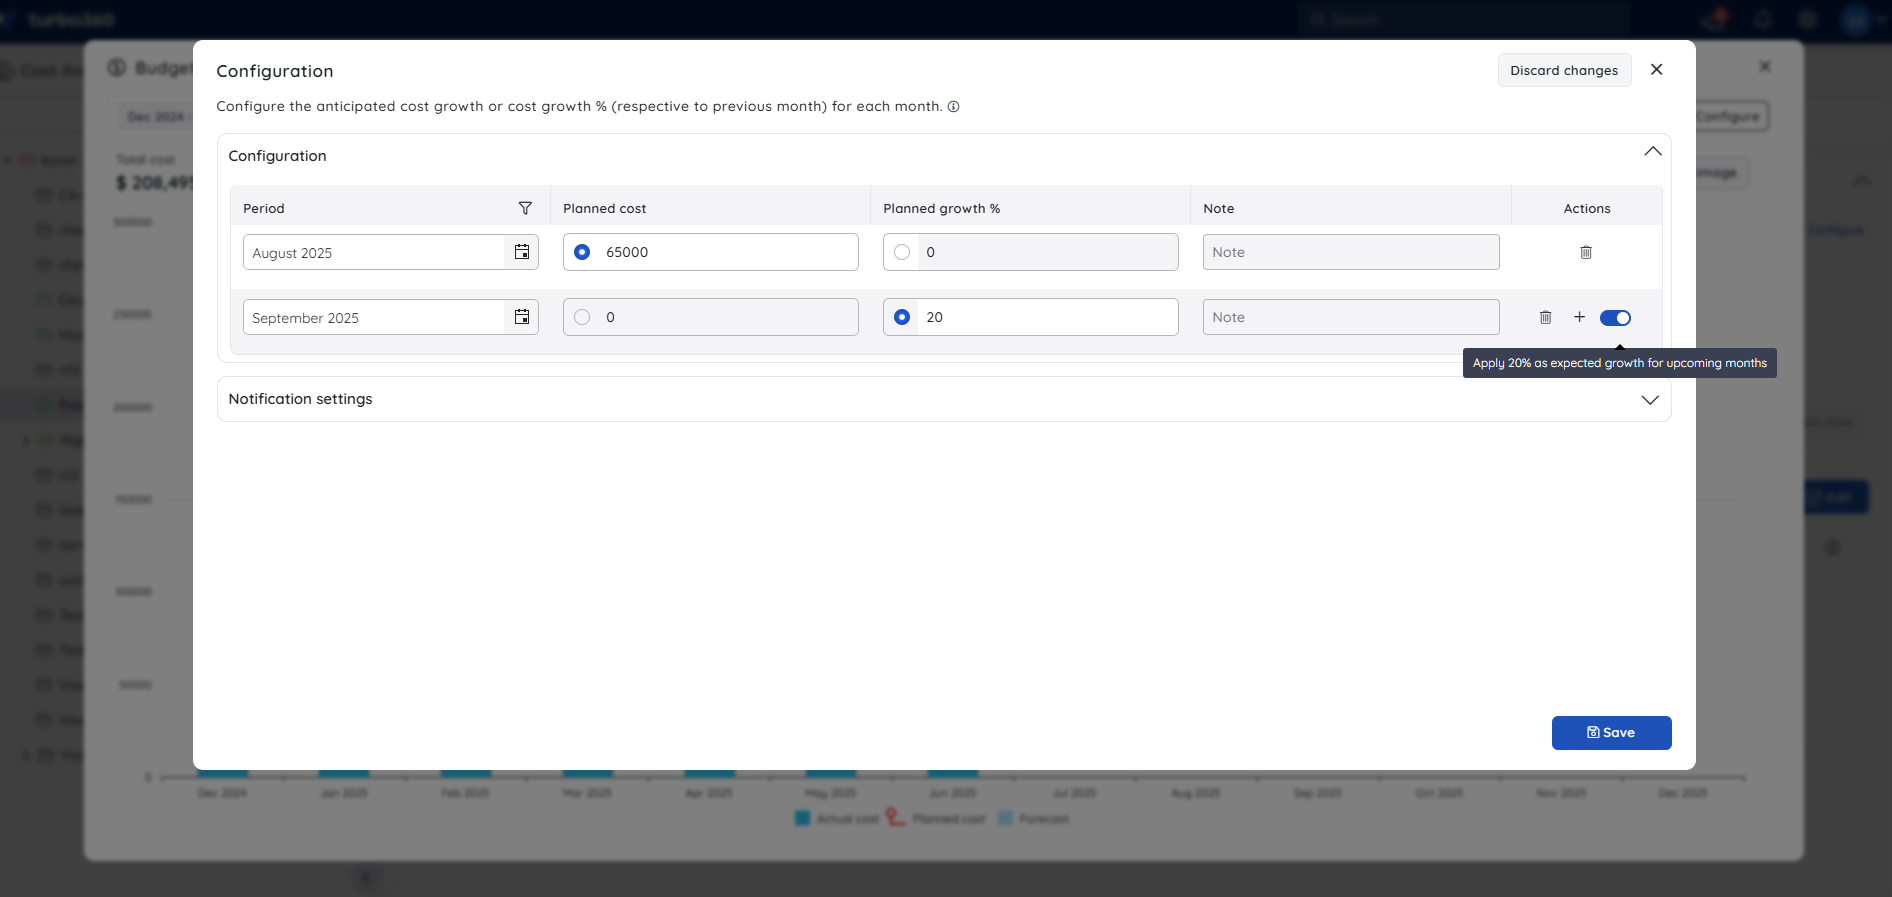
Amortized cost is considered for budget calculations. Actual cost can be used for reviewing trends without impacting budget calculations.
Monitoring alerts
The Budget planner includes automated alerts that compare actual Azure spending with planned costs or growth percentages. Notifications are triggered when monthly spend exceeds the configured plan, helping teams stay informed and take prompt action.
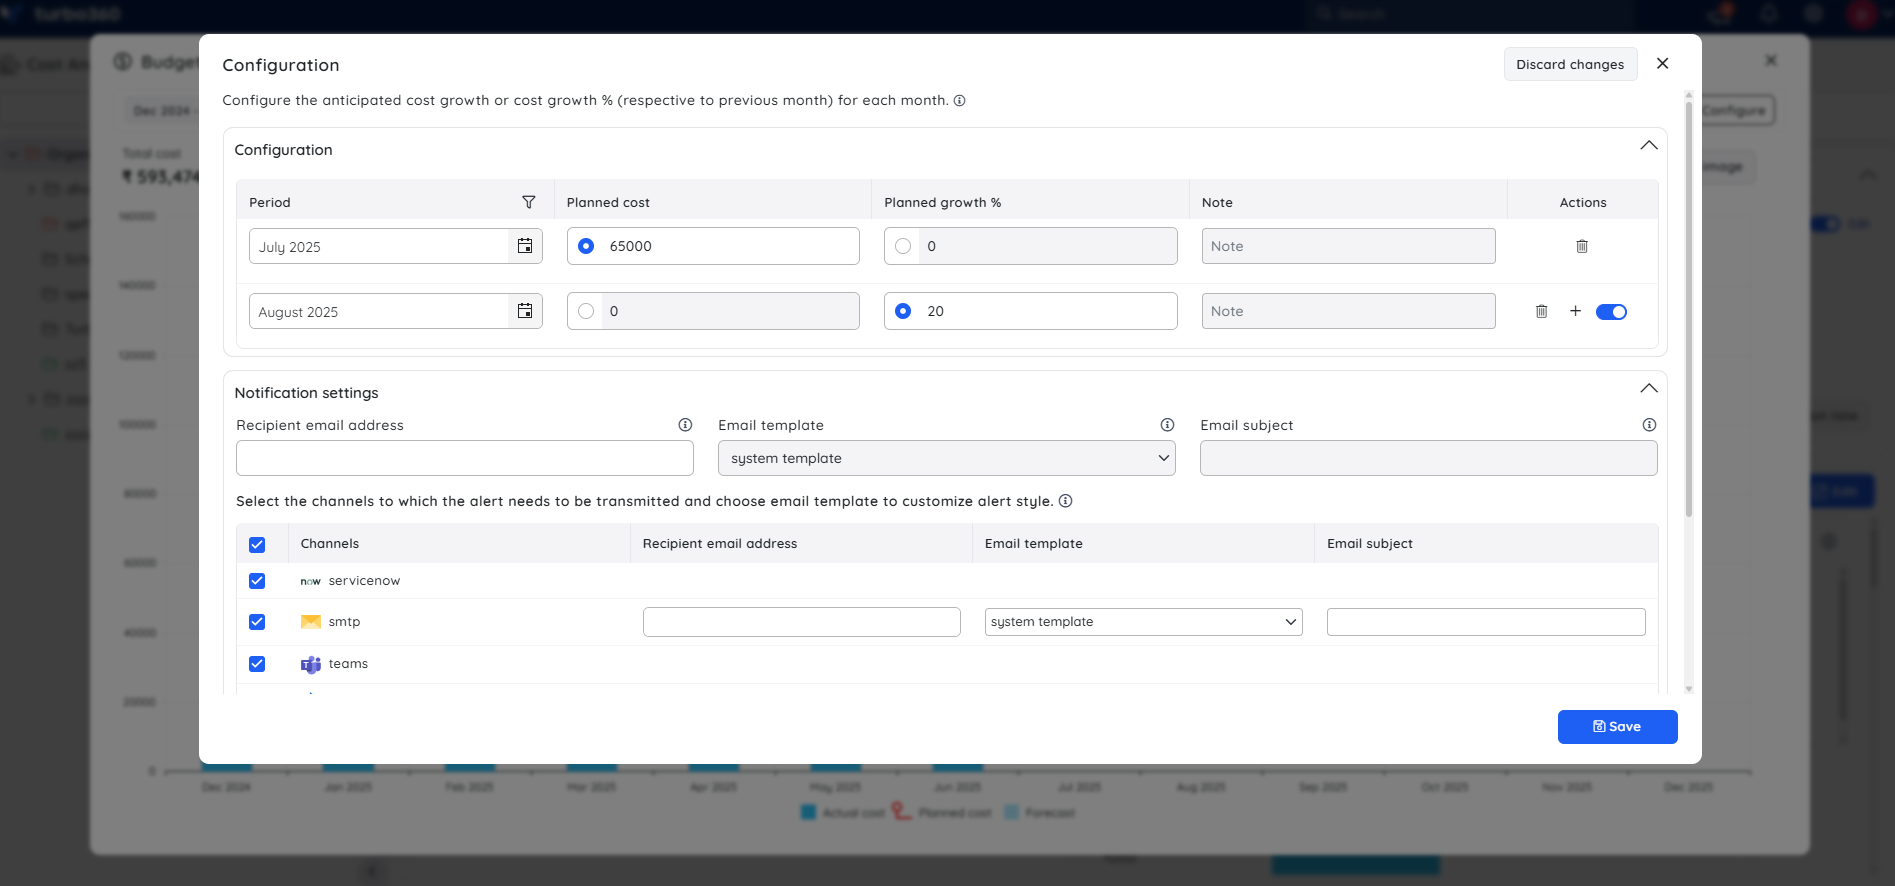
Steps to configure monitoring for Budget planner:
- Navigate to the Budget planner configuration for a cost management group as mentioned above.
- Choose the desired notification services and click Save.
Alerts will be triggered to the configured channels once the thresholds are breached.
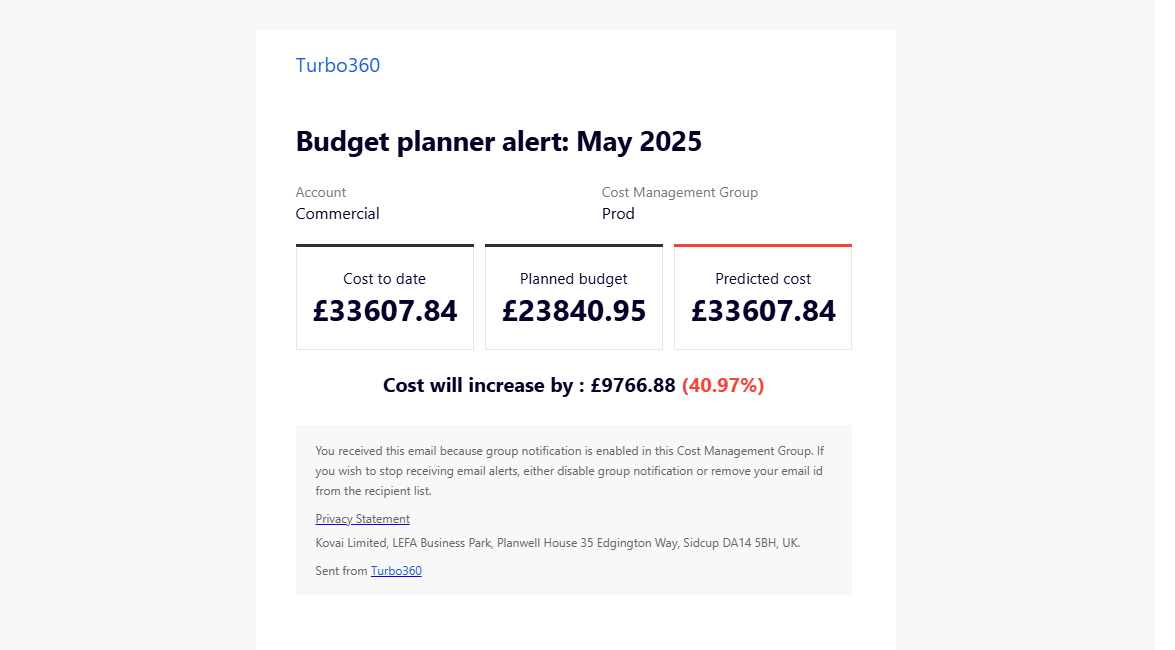
Sample alert
The image below displays a Budget planner alert email received via email, summarizing actual spend, planned budget, projected costs, and forecast deviations.
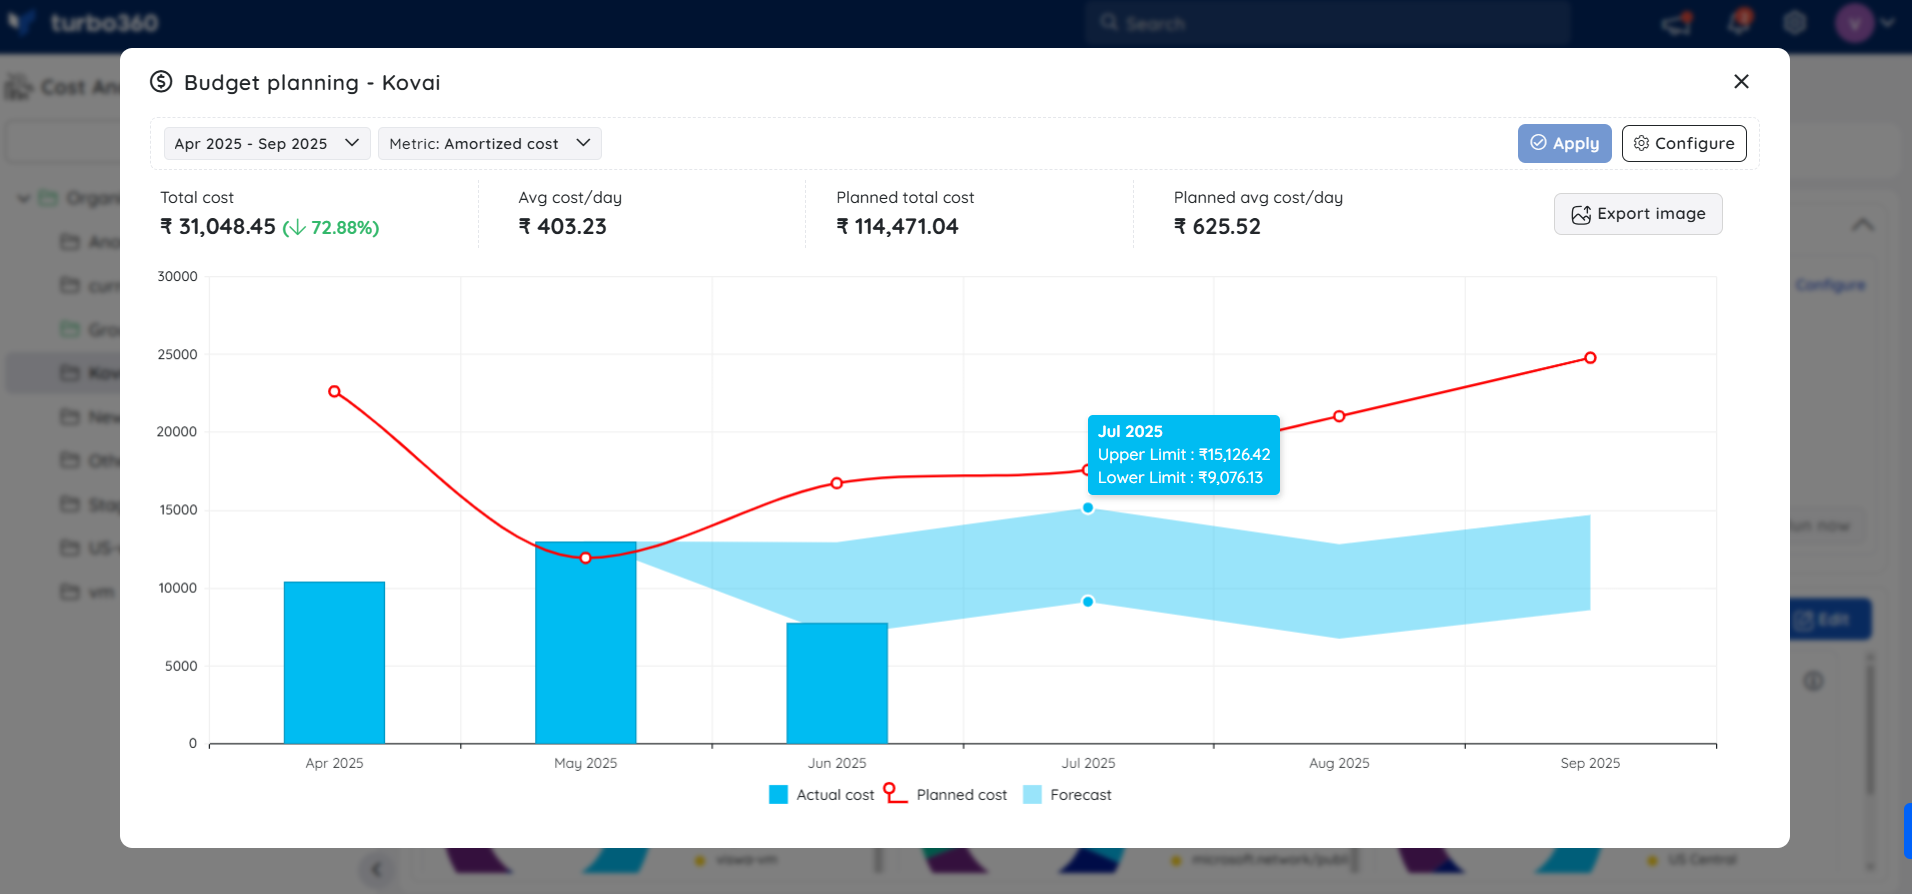
ML-powered forecasting
Forecasting in the Budget planner provides users with a predictive view of their future cloud budget position by estimating both upper and lower limits of expenses across upcoming time intervals.
These limits are calculated using historical data patterns and trends, giving users a range of possible outcomes instead of a single estimate. This helps in identifying budget risks and planning more effectively.
Forecasting applies only to the current and future months.
Each forecasting range includes:
Upper Limit: The projected high-end estimate based on optimistic trends.
Lower Limit: The projected low-end estimate based on conservative or risk-prone trends.
Use case
Current Date: June 16, 2025
Selected Interval: April 2025 to September 2025
User access policy
Access to the Budget planner feature is governed by role-based access control (RBAC) within the cost management group.
The Budget planner toggle must be enabled before providing access during role management.
Access levels include:
Read - Allows users to view historical spending and forecasted cost data.
Manage - Allows users to set planned costs or growth rates and manage alerts.
.png)
Was this article helpful?