- 13 Nov 2024
- 11 Minutes to read
- Print
- DarkLight
- PDF
Monitoring a Business Application
- Updated on 13 Nov 2024
- 11 Minutes to read
- Print
- DarkLight
- PDF
Introduction
Turbo360 understands problems faced by enterprises and offers an out-of-the-box monitoring solution that helps users to monitor the distributed Azure Services grouped in an integrated solution.
An enterprise-integrated solution may contain multiple Azure services being used, and these resources from various subscriptions can be grouped in a Turbo360's Business Application to make more meaningful monitoring.
Business Application monitor allows users to monitor the state and metrics of their Azure resources, assisting in the improvement of overall performance and Azure resource usage.
Types of rules
The rule of a resource can be of any of the following types:
- Property
- Metric
- Status
- Availability Status
Property indicates the current value of the selected rule.
Metric indicates the value that is obtained based on the aggregation period (set in the monitoring settings at Business Application level (or) Monitoring profile level).
Status indicates one of the available values (specific to each rule).
Availability Status indicates the availability of the resource.
For a rule of type Property or Metric, threshold values can be any positive number.
For a rule of type Metric, threshold values not only can be a number but can also be any metric belonging to the chosen resource type, whose value will be evaluated based on the aggregation period set in the Business Application's monitor settings when the monitor starts its evaluation process based upon the rules evaluation frequency.
Types of Thresholds
Users can set two types of threshold values for one rule:
- Warning threshold
- Error threshold
Monitor evaluation determines that a rule has been violated when its current value exceeds one of the threshold values.
Error threshold is given priority upon alert generation when both threshold values are met during monitoring.
Rules configuration
Monitoring rules can be configured in the Monitoring section of each associated resource and through the use of monitoring profiles.
Each resource metric supports multiple aggregation types. Choose the right one to match the needs.
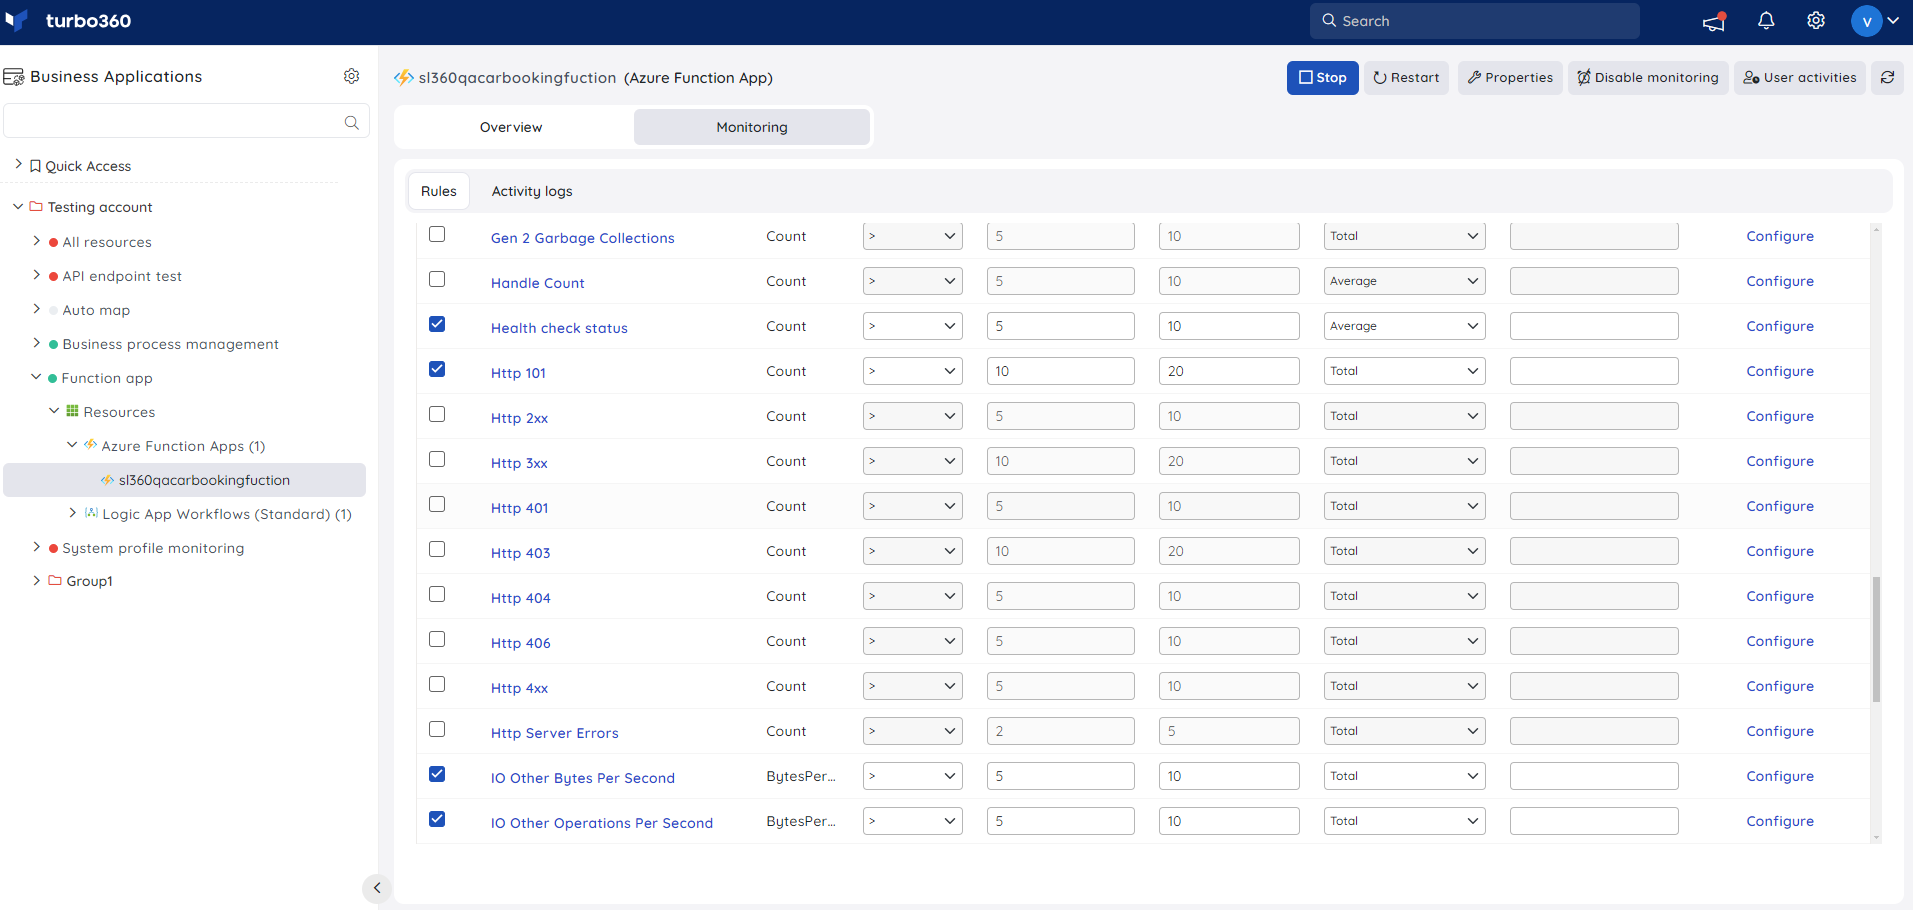
The image shown below depicts the monitoring section of a Function App resource:
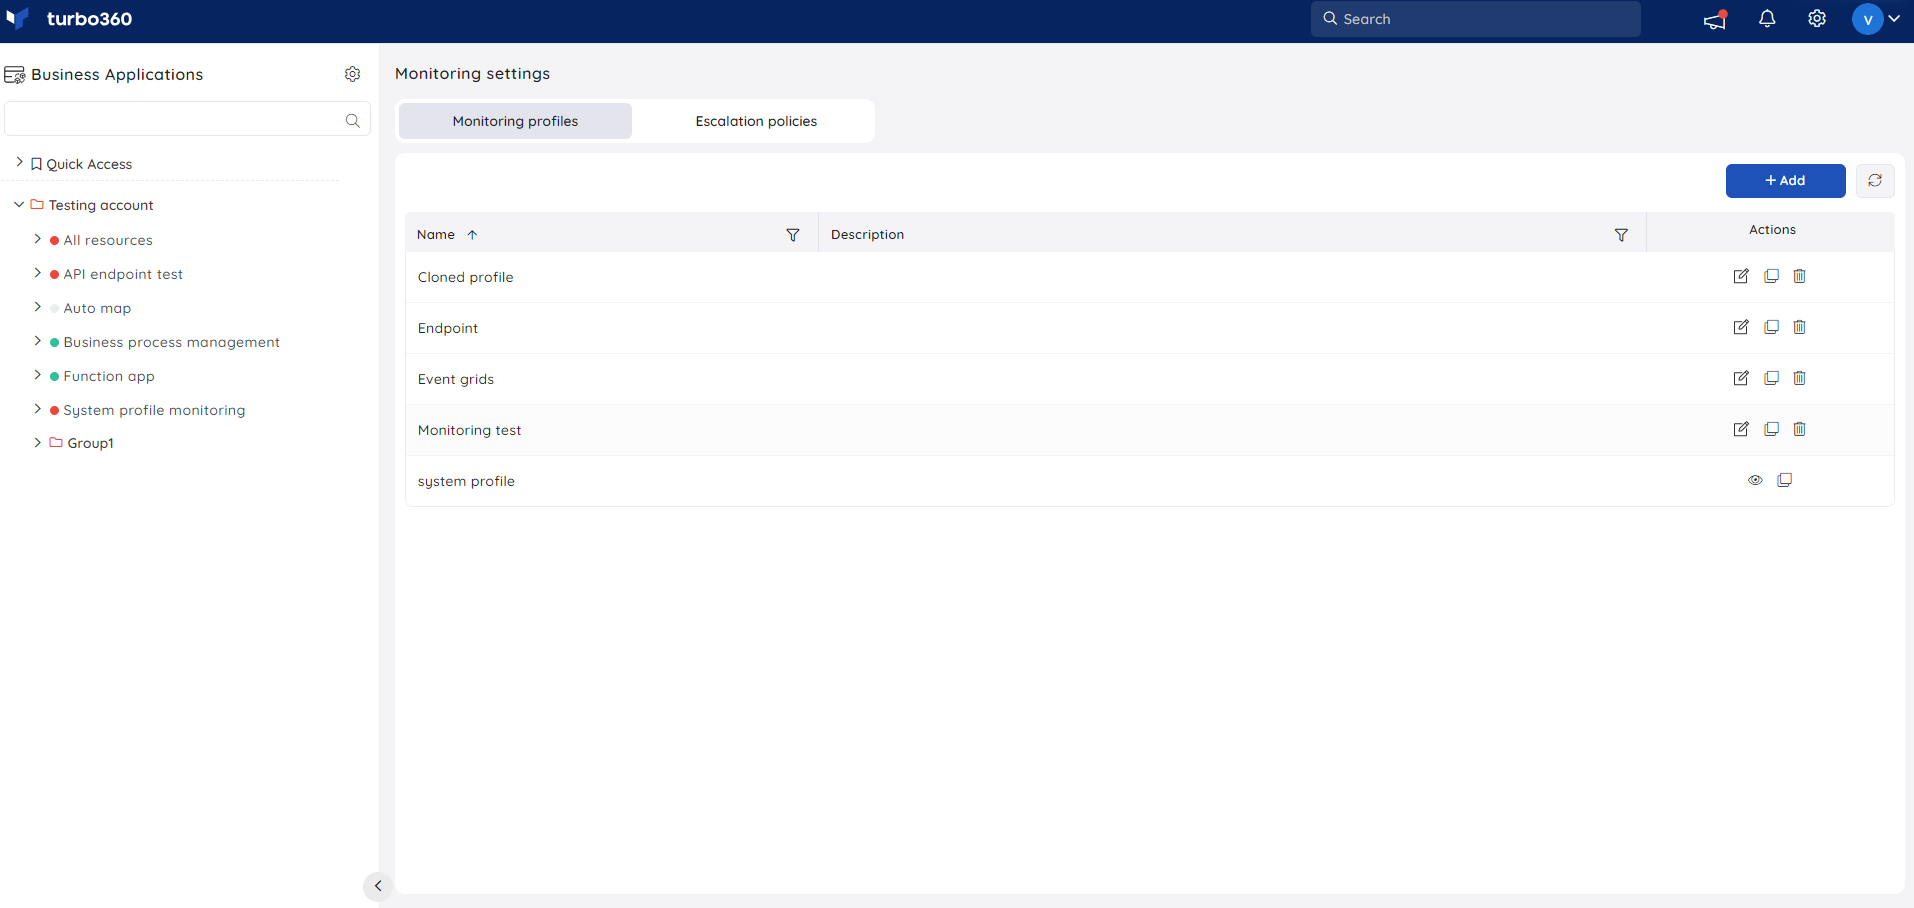
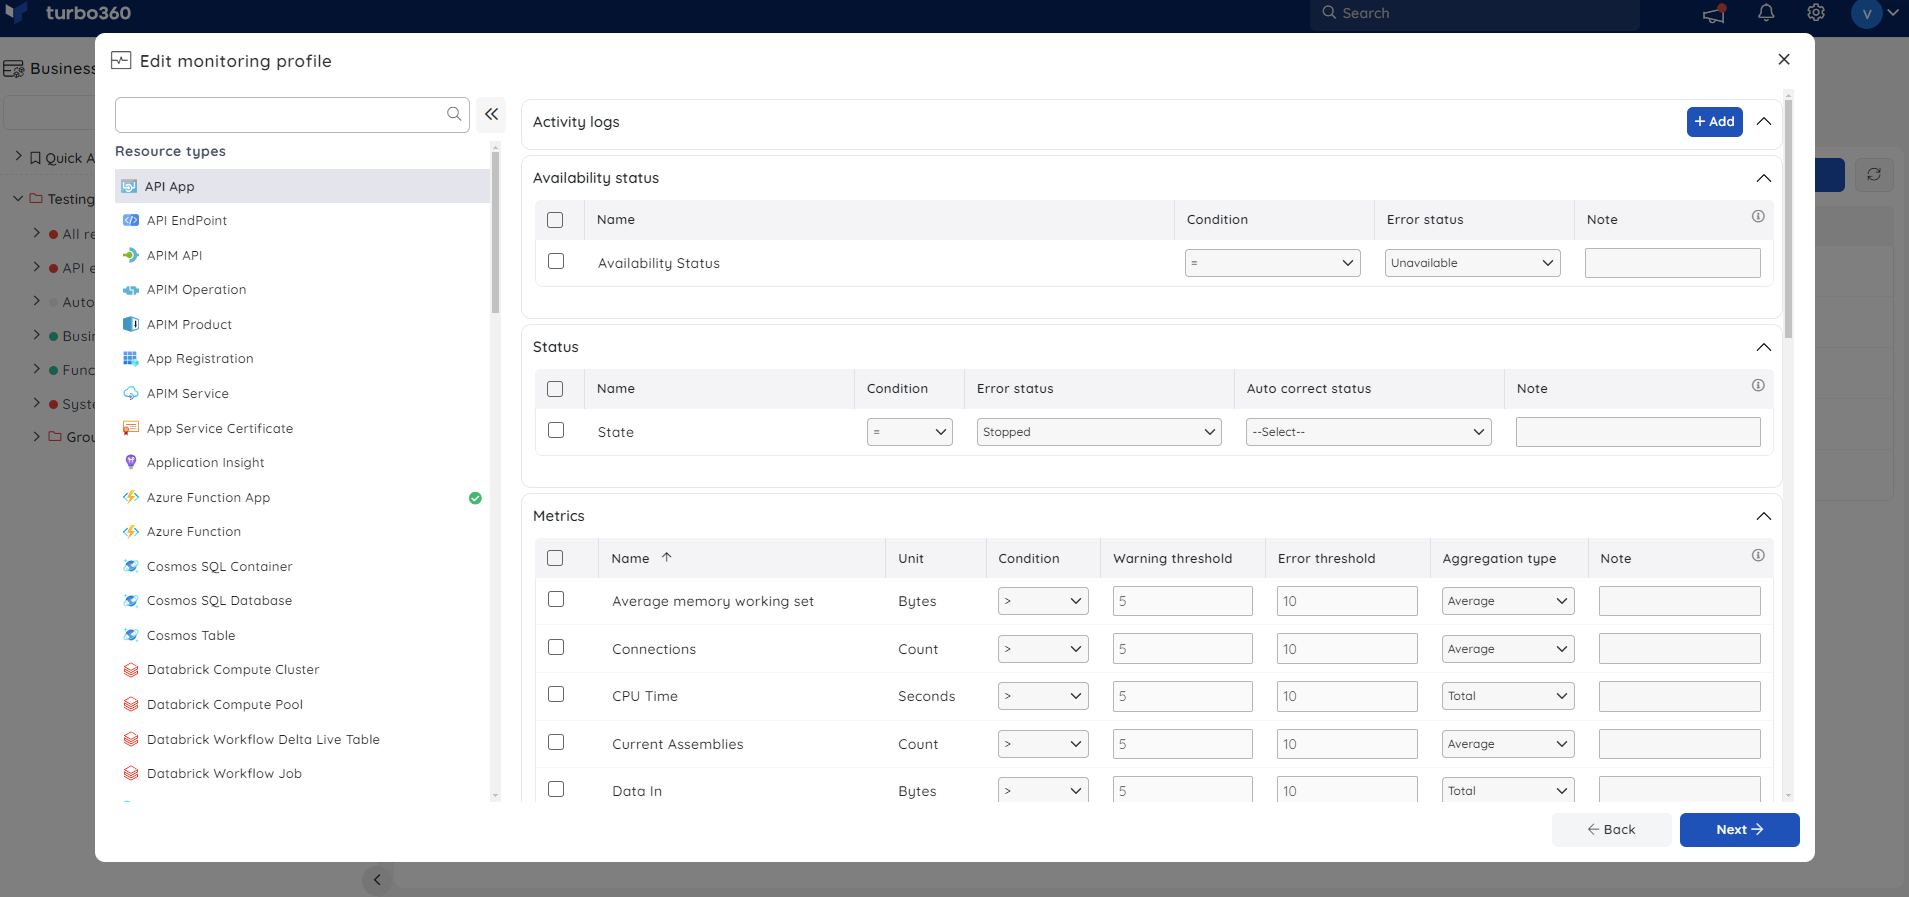
Monitoring profiles can be accessed from Settings -> Monitoring settings -> Monitoring profiles.
Metric Usage Visualization
The usage patterns of parent resource metrics can be visualized through a chart, accessible when clicking upon the relevant metric in the monitoring section of the corresponding resource.
The blue hue in the metrics highlights the availability of data visualization.
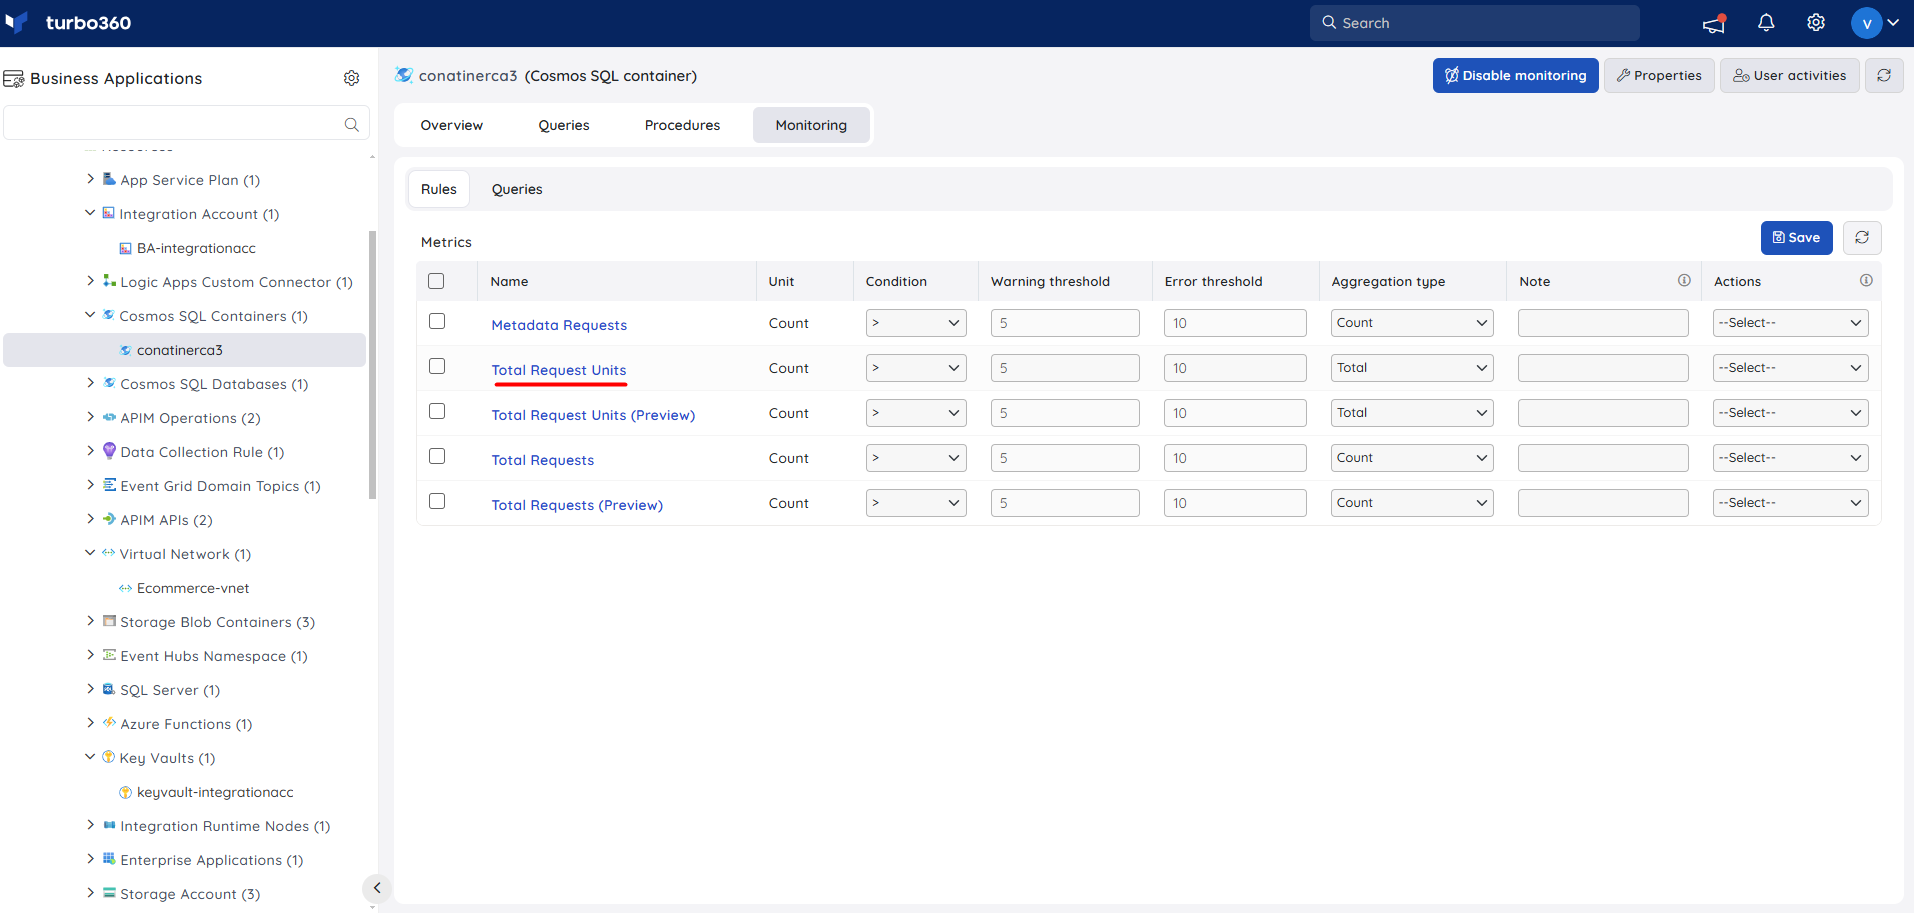
- To focus the metric usage on a specific period, use the Settings option to customize the time interval.
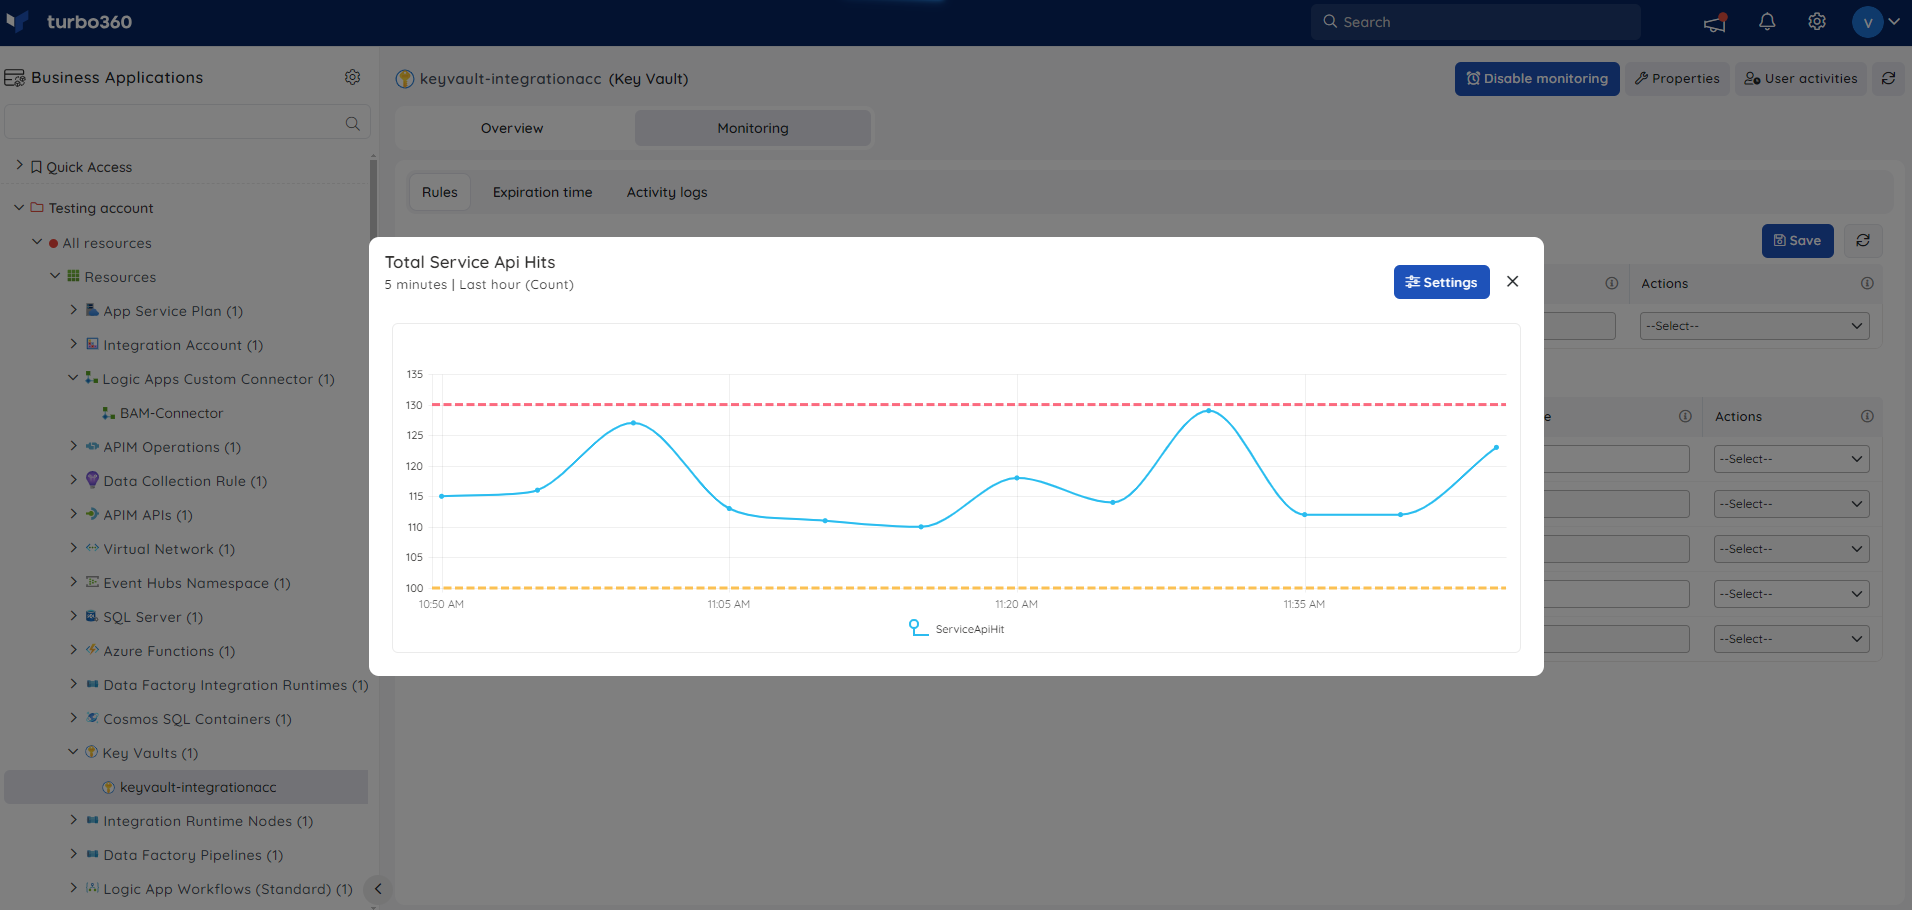
Yellow and red lines represent the threshold values for warnings and errors associated with a resource metric.
This visualization helps users understand the metric's usage patterns and also assists users in adjusting or configuring the threshold values more accurately for monitoring purposes, ensuring effective tracking and alerts when usage approaches or exceeds the limits.
This is not possible through monitoring profiles.
Monitoring configuration
Monitoring rules and settings can be managed from the following path: Monitoring -> Settings, within a Business Application. This includes monitoring rules available at each resource level and those available in a profile mapped to the Business Application.
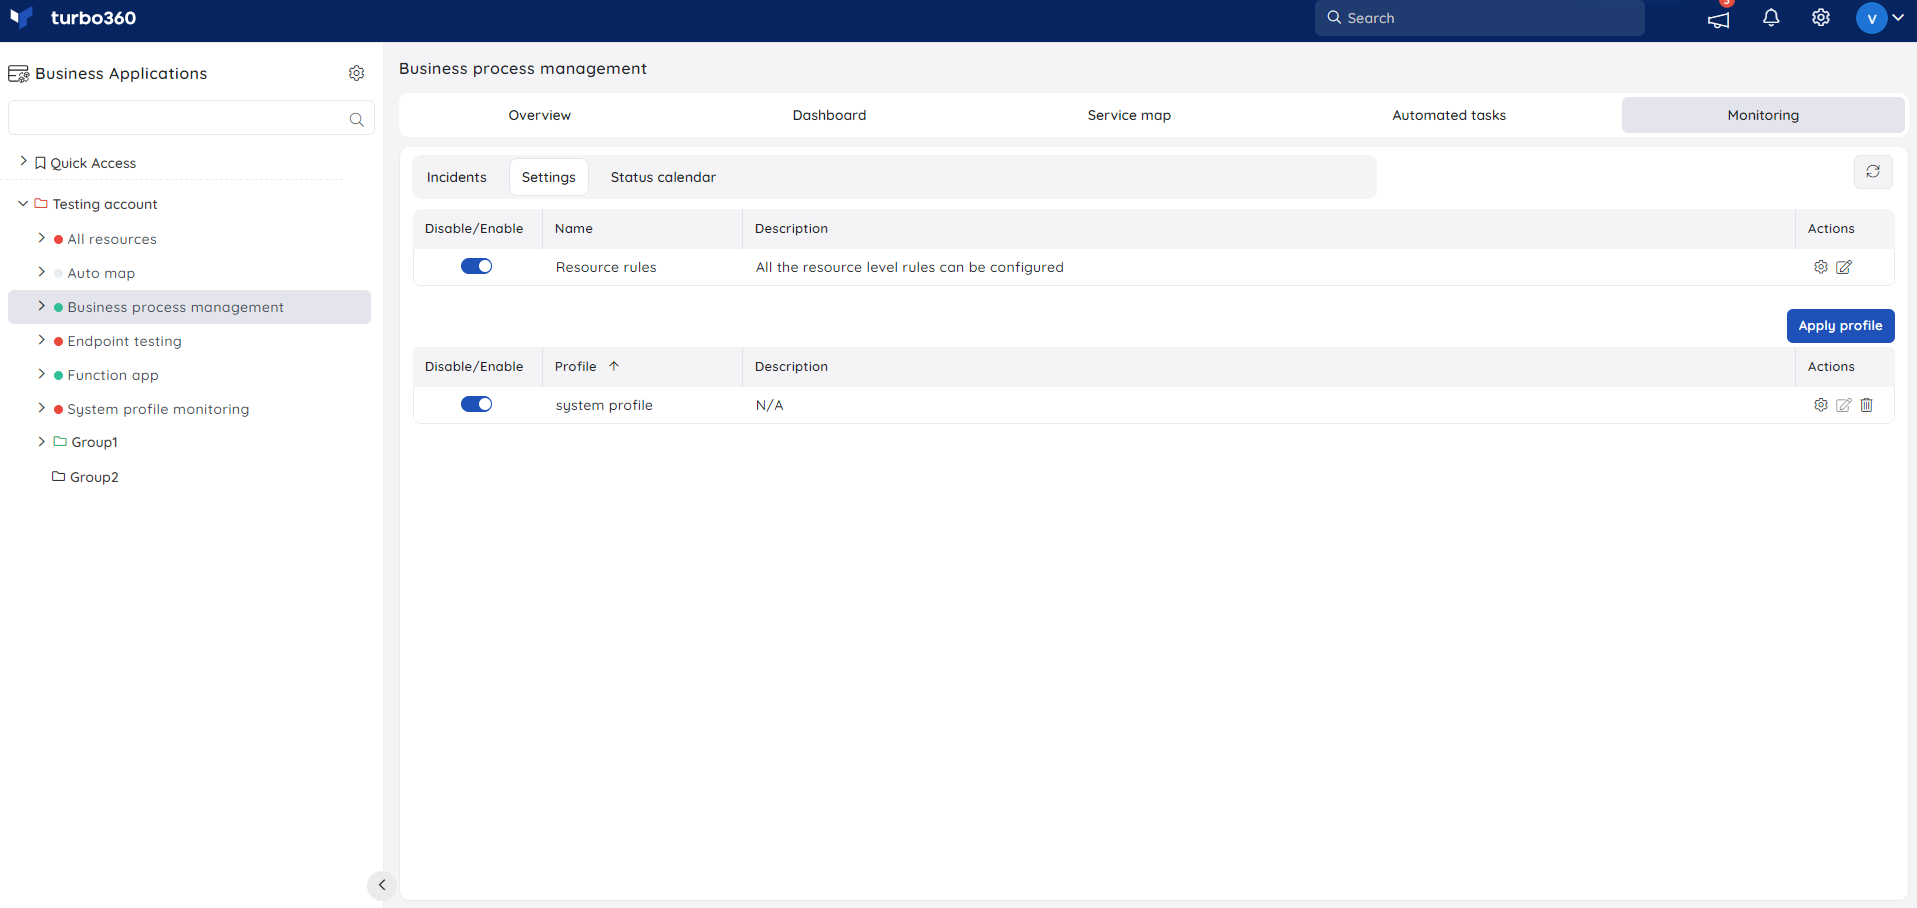
1. Resource rules
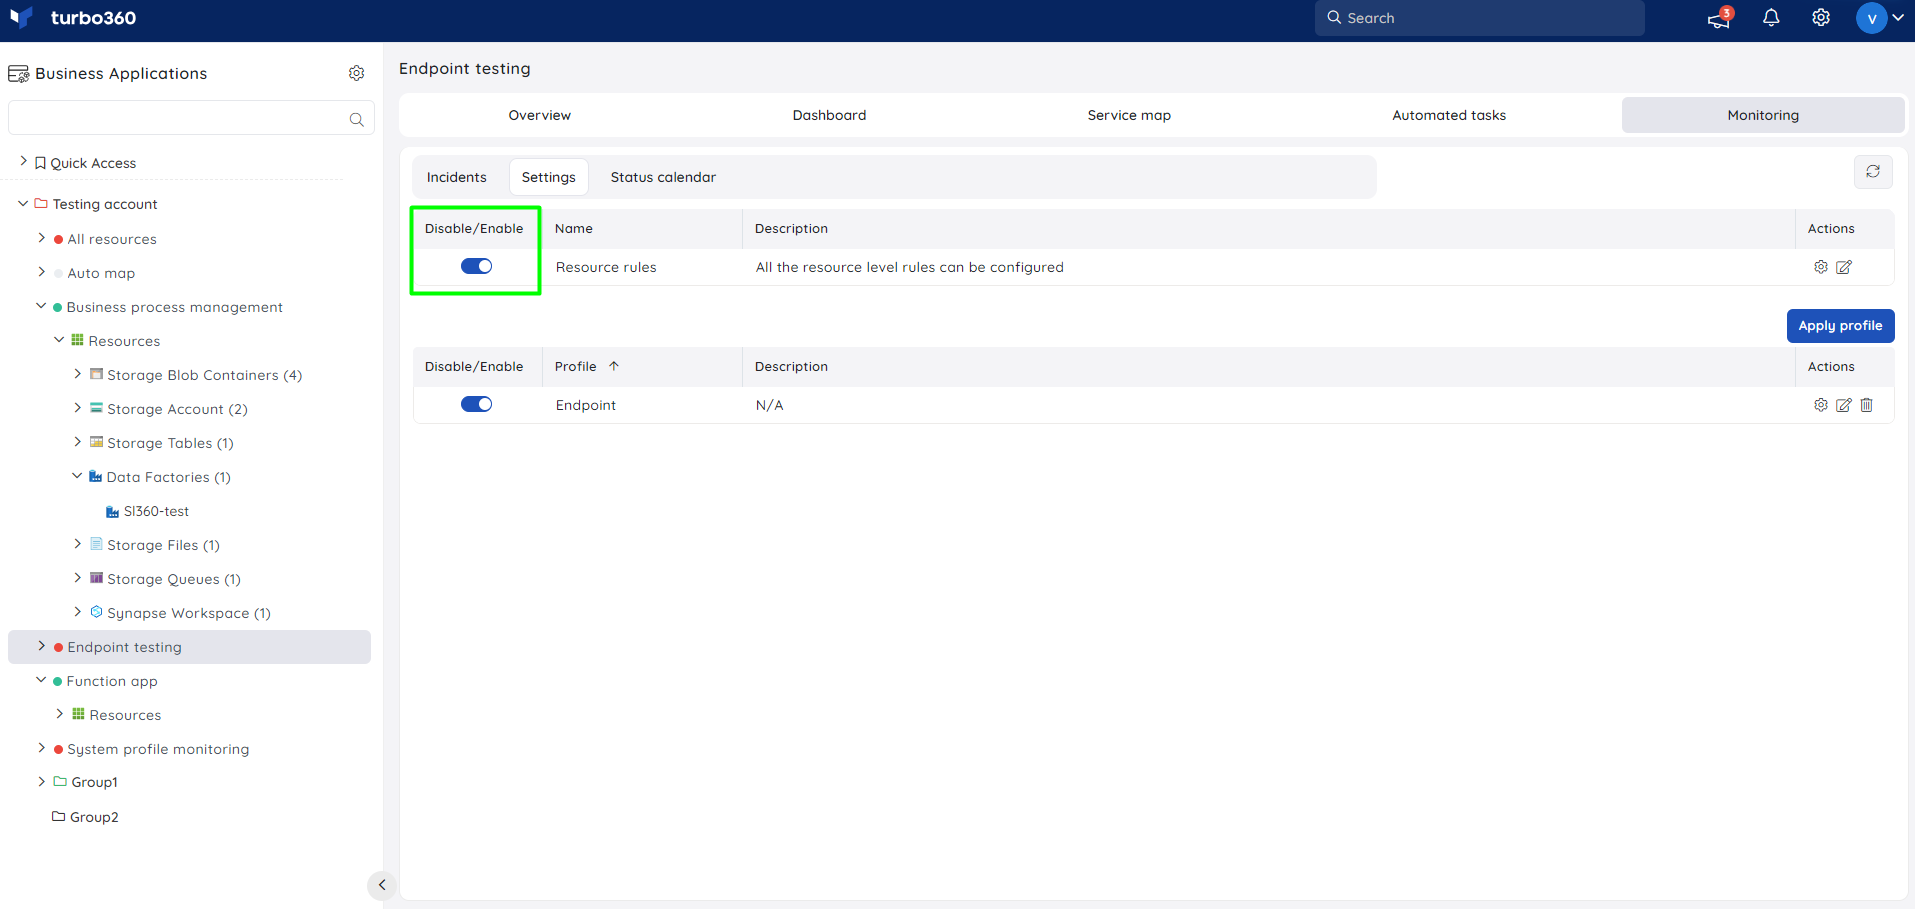
Monitoring toggle
Enabling/Disabling monitoring for Resource rules will enable/disable resource monitoring for which the rules are configured at each resource level.
Manage resource rules
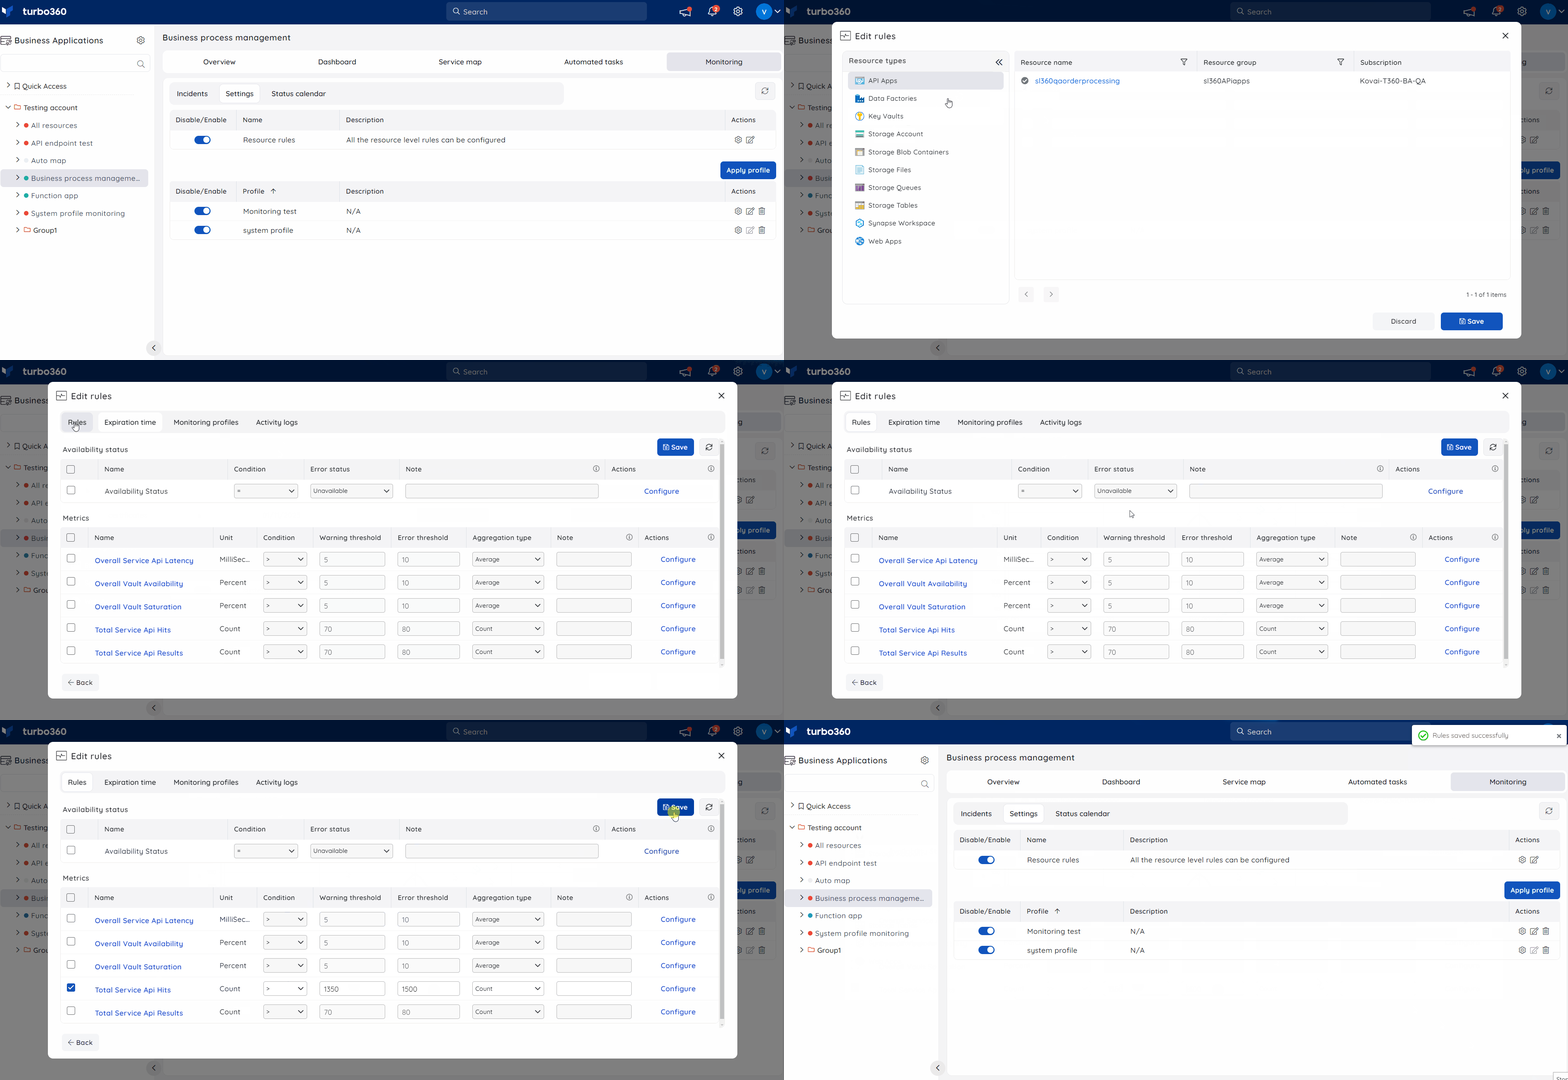
Monitoring rules for associated resources can be managed collectively from a single location by navigating to the following path: BA -> Monitoring -> Settings and clicking the Edit option next to Resource rules.
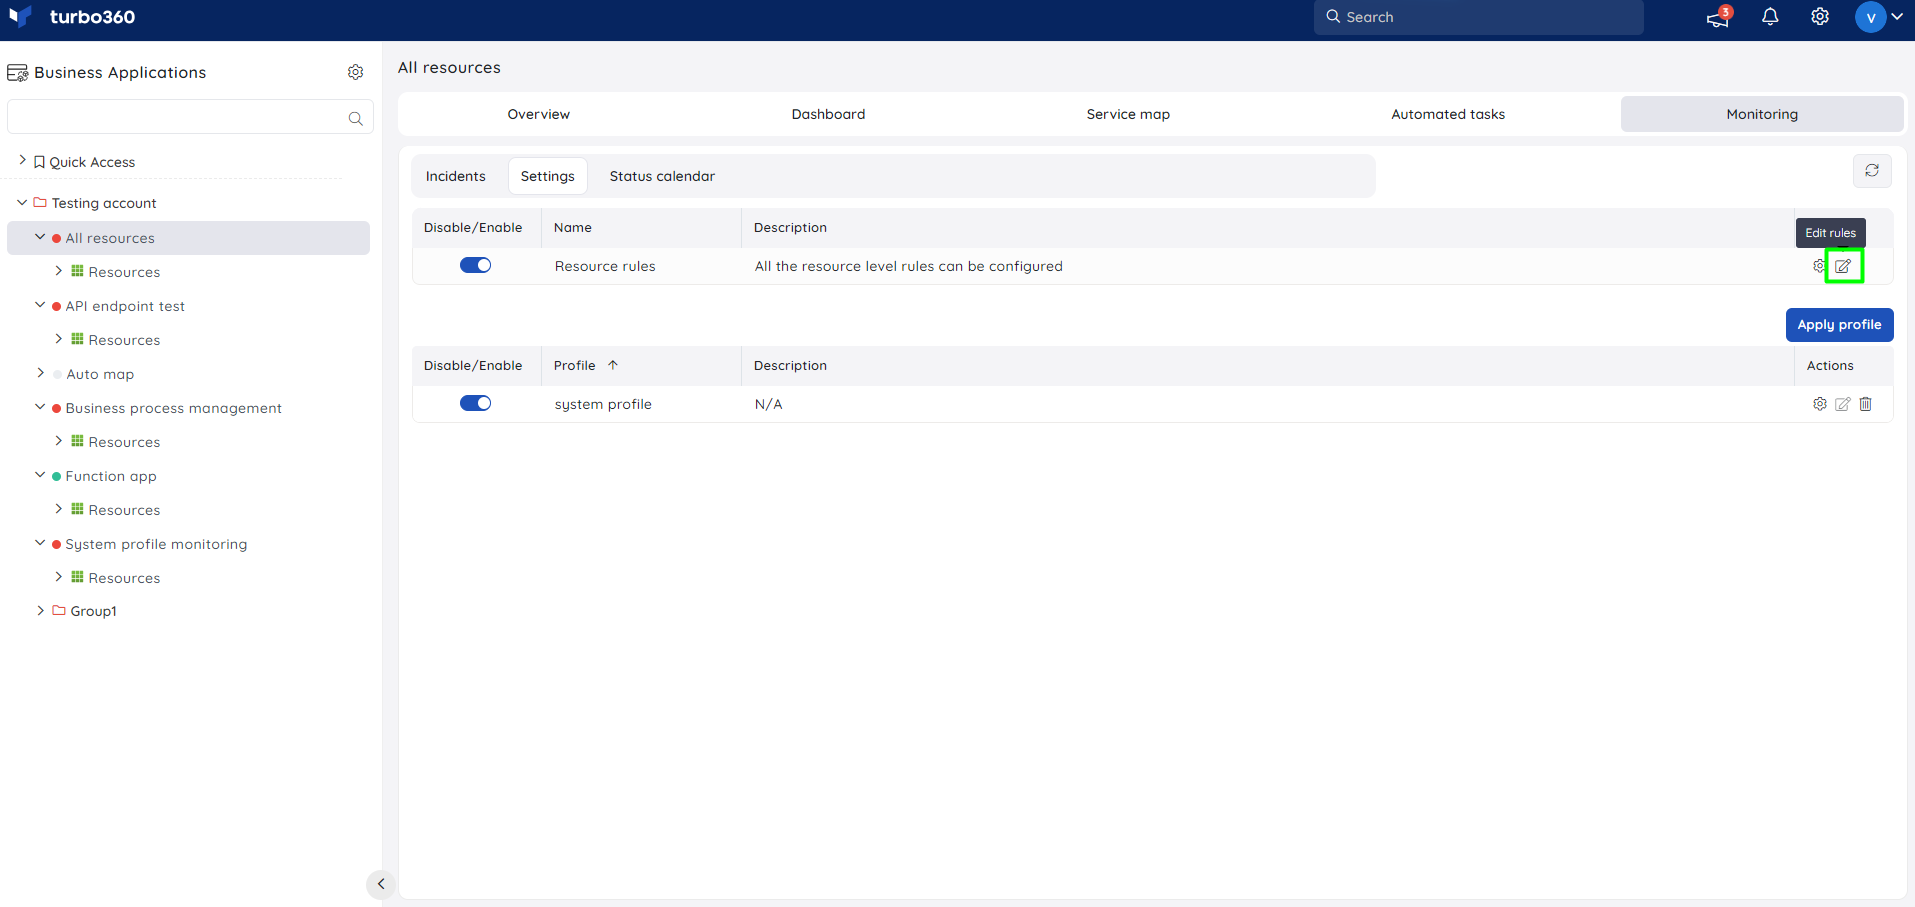
Resources with rules configured will be marked in green. Clicking on a resource will display its resource rules and profiles mapped to the resource.
The green marking will be based only on the resource level rules.
2. Monitoring profiles
Profiles assigned to a specific Business Application will be visible in the Monitoring section of that Business Application.
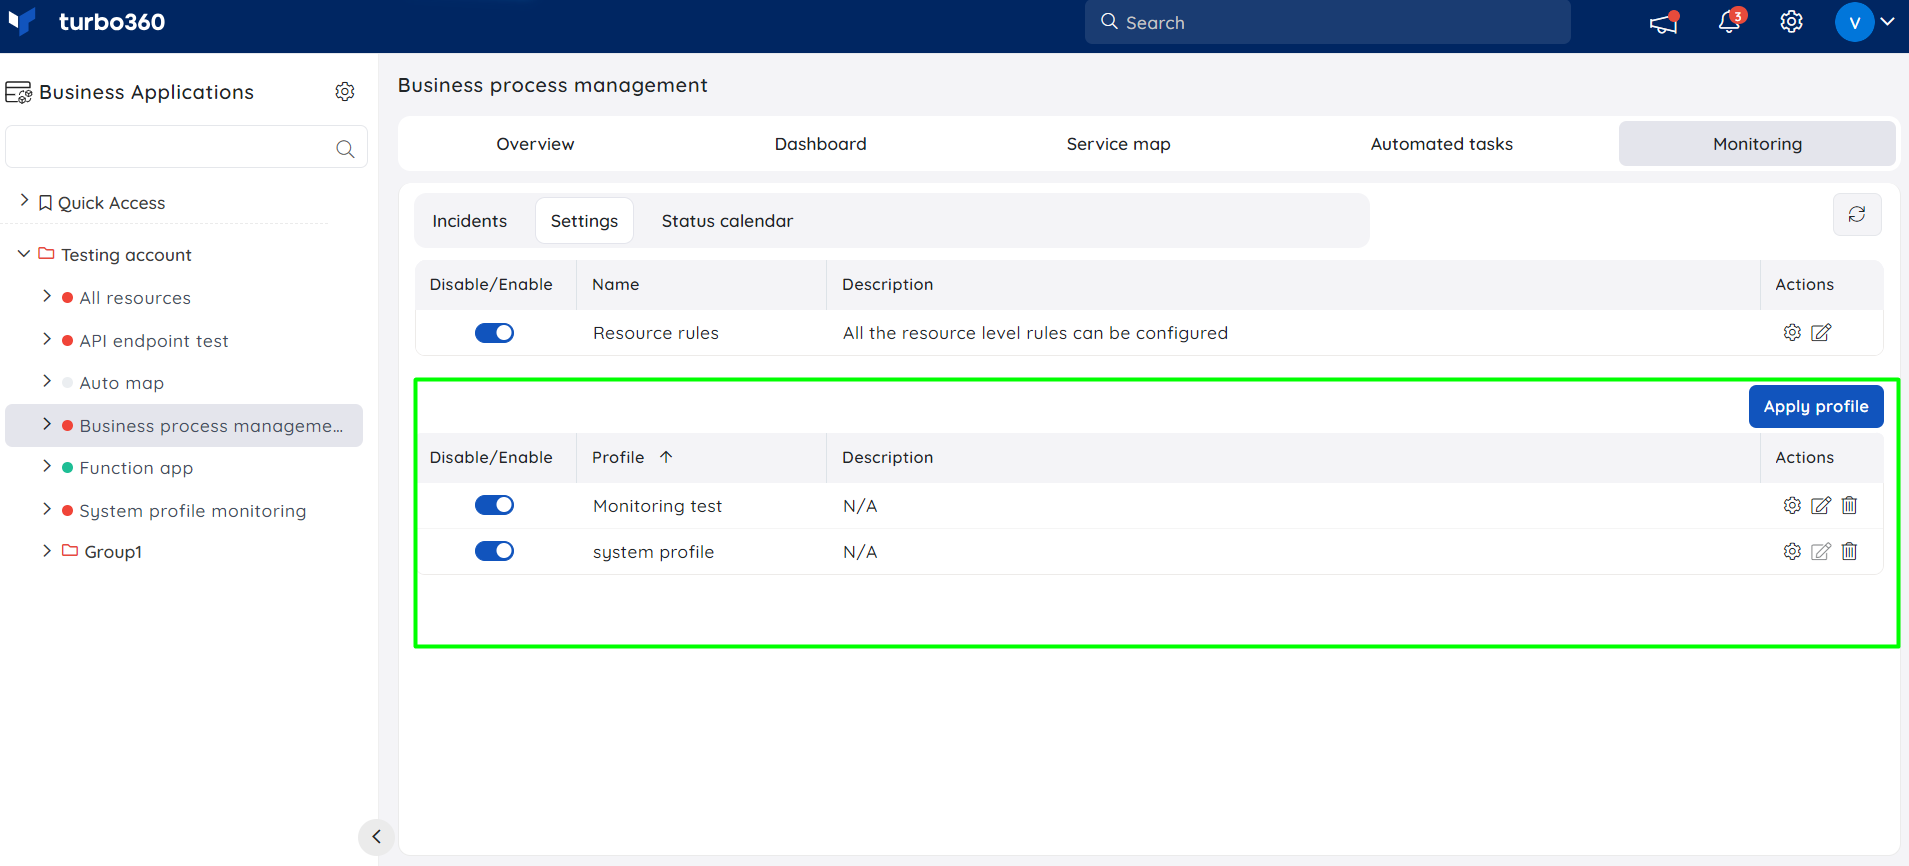
Click here to know more about monitoring profiles.
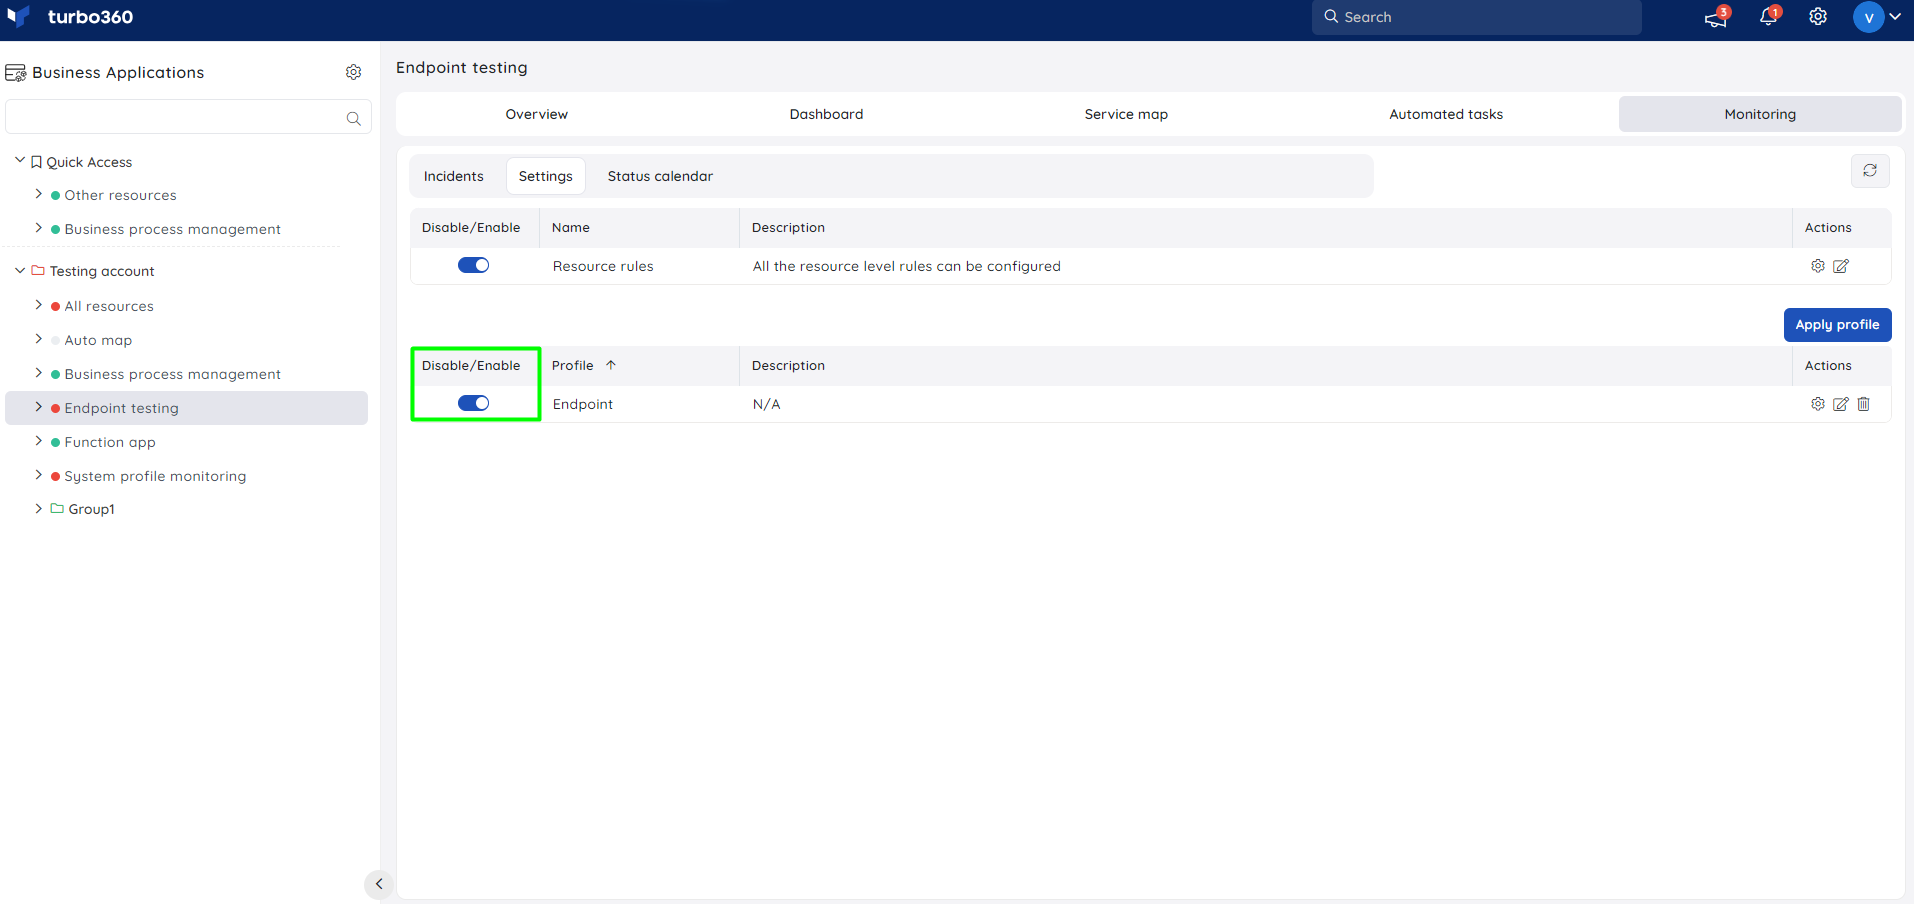
Monitoring toggle
Enabling or disabling monitoring for a profile will only affect the monitoring based on the rules configured within that profile.
Manage profile rules
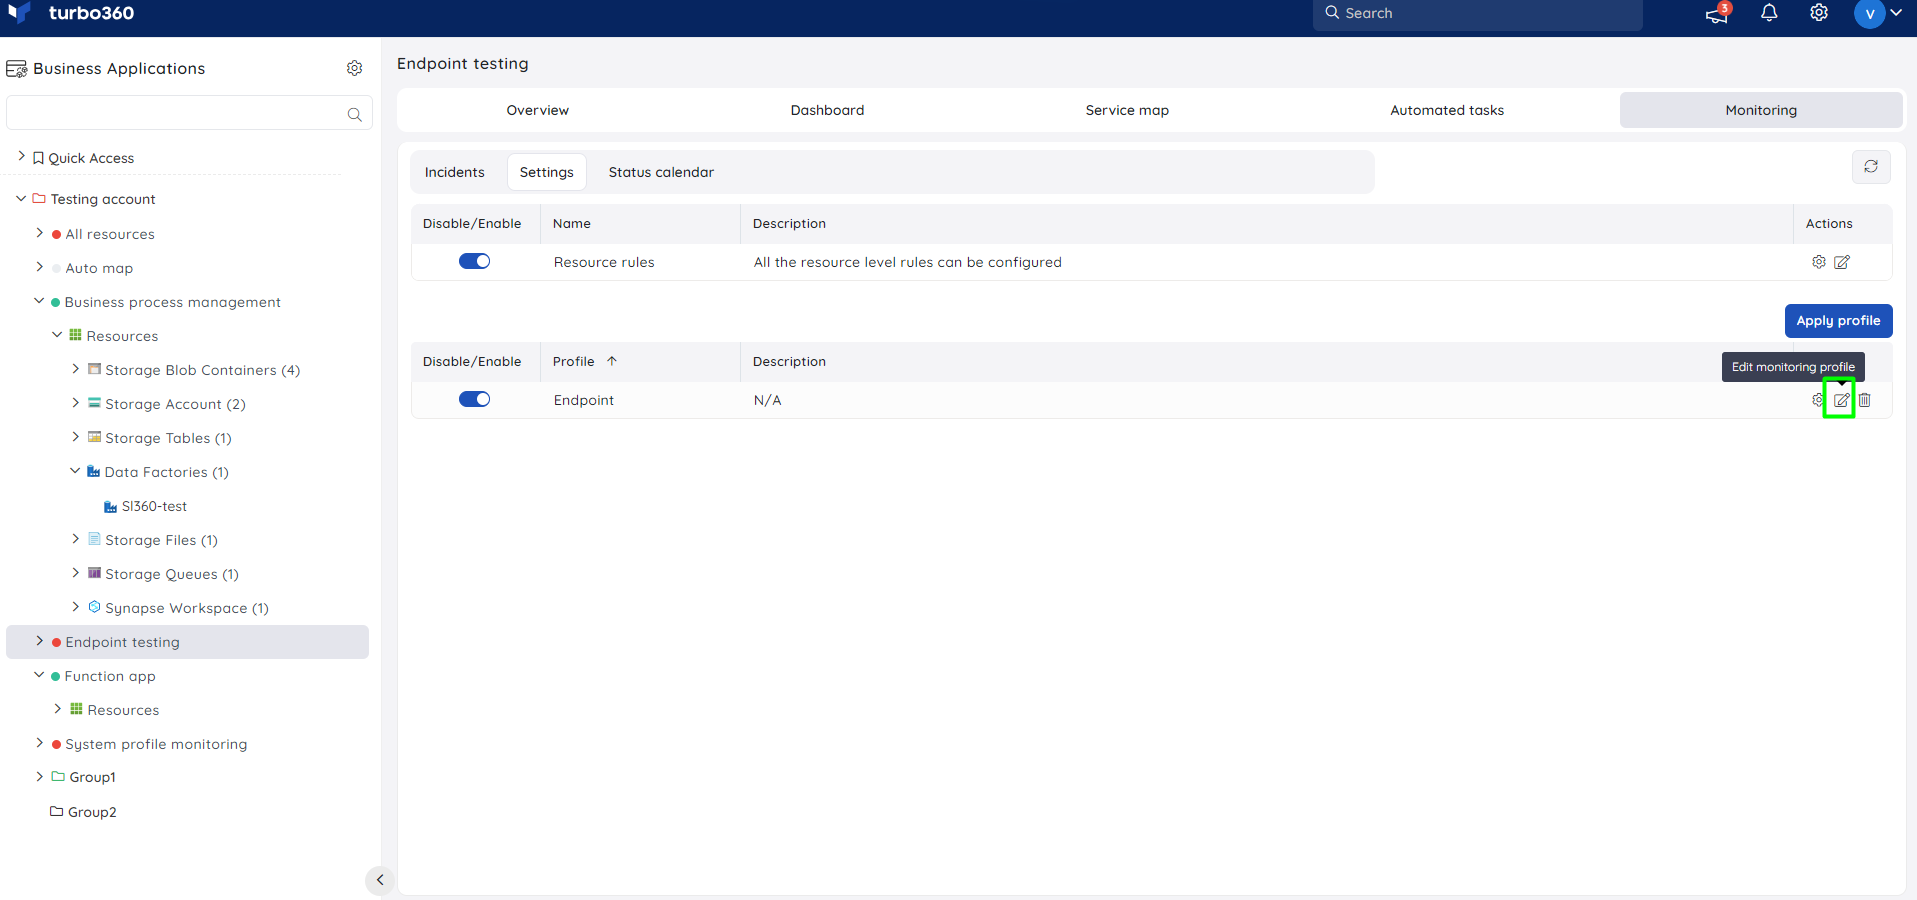
Monitoring profile rules can be managed either from Settings -> Monitoring Settings -> Monitoring profiles.
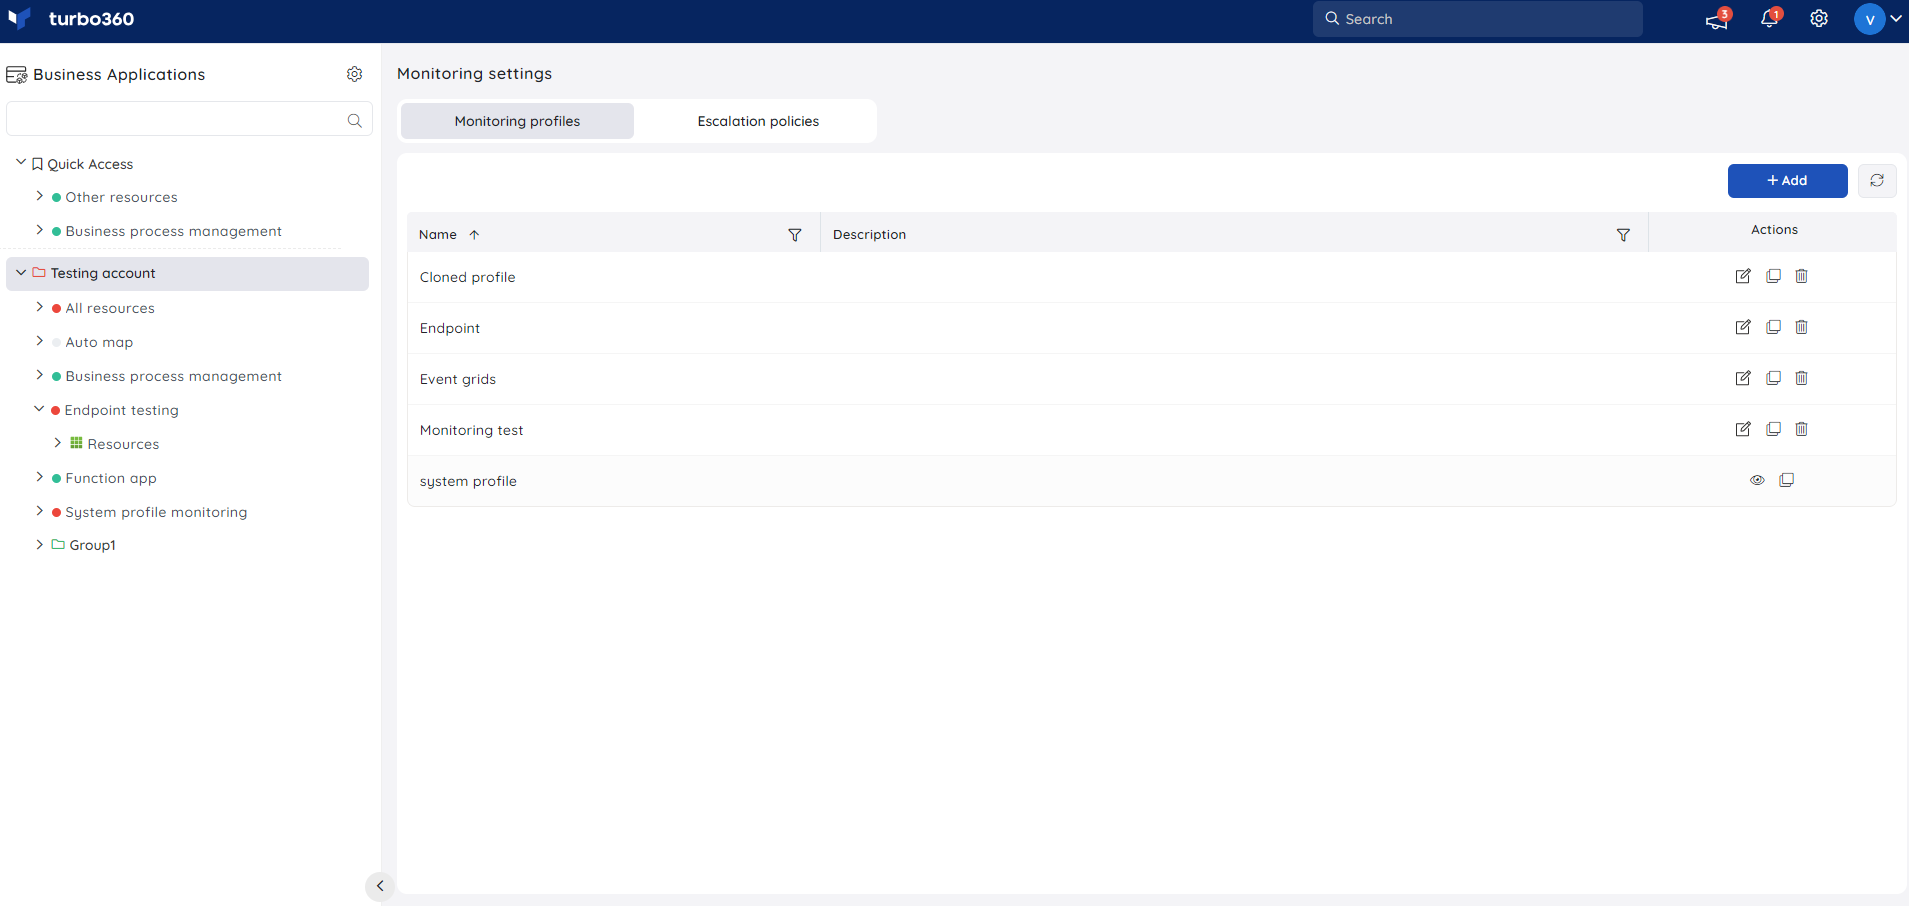
(or) from the Monitoring section within a Business Application to which it is mapped.
Click the Edit icon to update changes to the monitoring profile. The changes will be applied to the original profile and the same will be reflected in all the business applications configured with this profile.
Monitoring settings
The overall functioning of Business Application monitoring via Resource rules (or) monitoring profiles can be controlled by clicking the Settings icon next to the Resource rules (or) or the mapped profile respectively.
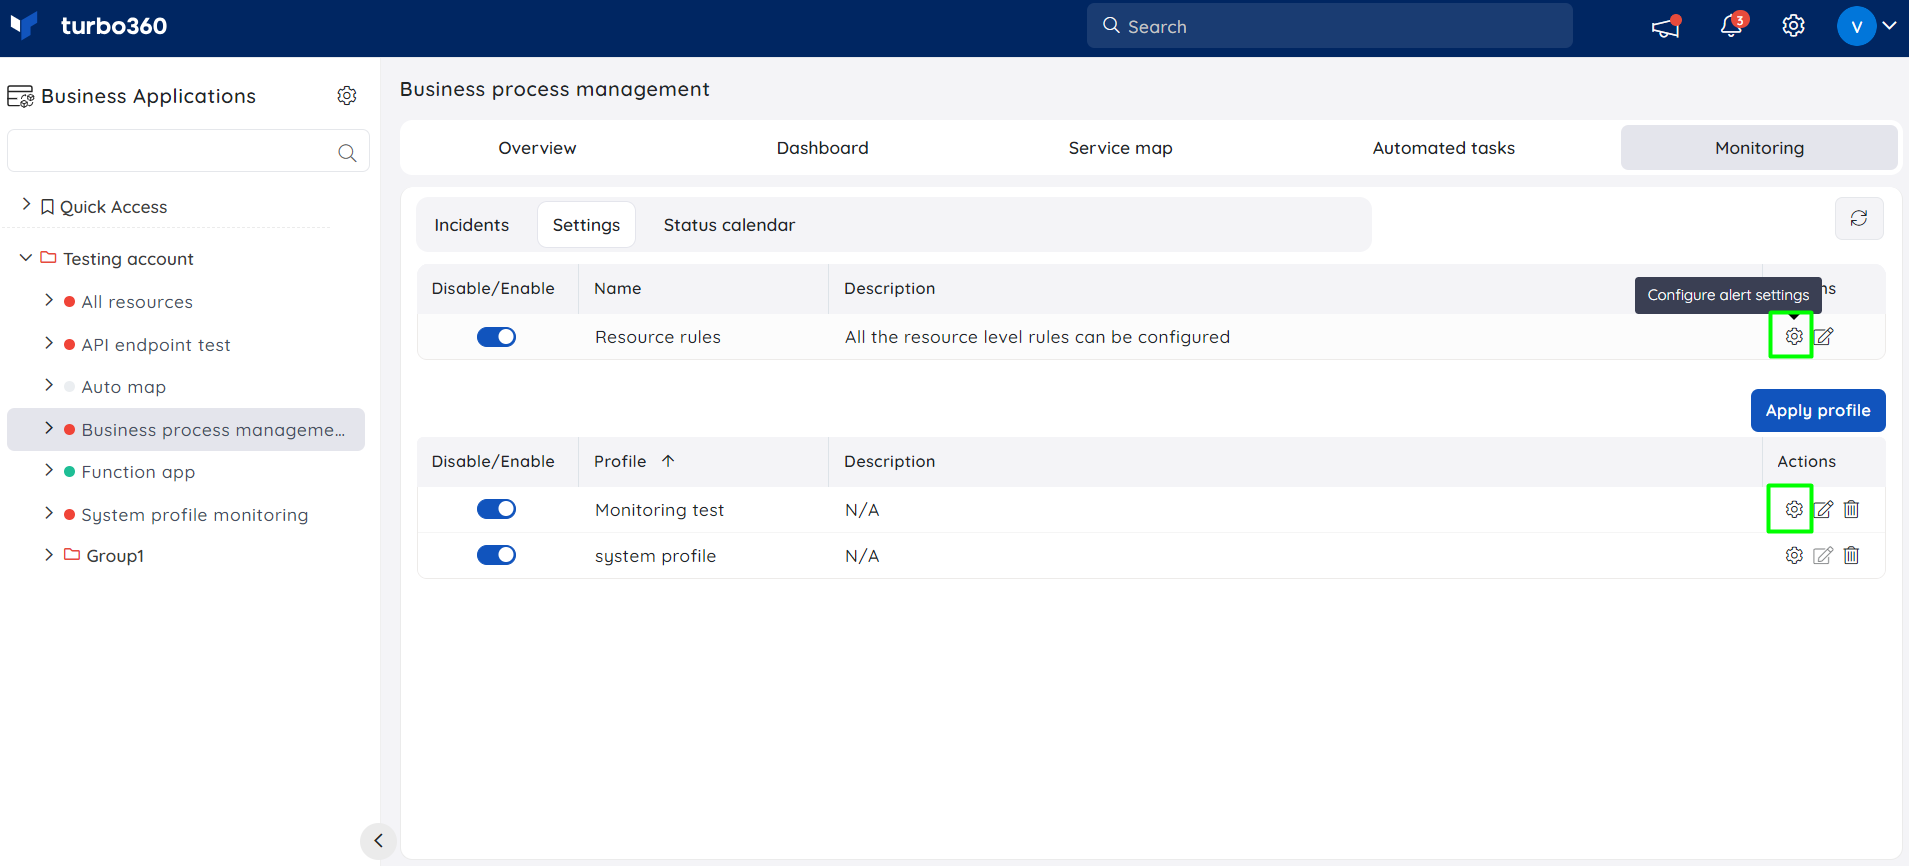
The settings include a variety of categories that determines the monitoring functioning:
i) Timezone

Set the timezone based on which resource monitoring should be performed for a particular Business Application.
ii) Rule settings
In terms of monitoring frequency, the following options are available in the monitoring configuration:

Rules evaluation frequency - All the resources associated with the chosen Business Application will be monitored based on this frequency.
Aggregation period - All the metrics of the resources associated with the chosen Business application will be aggregated using the metric's Primary Aggregation Type, based on the Aggregation Period provided.
Auto resolve incidents - With this checkbox enabled, alert incidents will automatically close when all resources within the Business Application move from error to healthy state in the next monitoring cycle. An up alert will be sent to all configured channels indicating that the Business Application has become healthy.
Monitor scaled app service instances - The scaled instances as well as the default instances for Web apps, Function apps, and App service plans are monitored when this checkbox is enabled.
iii) Violation report settings
The following settings should be configured in the monitor settings to specify when monitoring should be carried out:

Days - All the monitoring alerts for the provided frequency and aggregation period will be generated only on the mentioned days of the week.
Hours - All the monitoring alerts for the provided frequency and aggregation period will be generated only on the mentioned hours in a day.
Include healthy rules in the report - Violation reports of a Business Application can be configured to include the healthy rules along with the violated rules of the monitored resources.
Include all identified issues - By default, issues reported already will be ignored in the consecutive alerts. Enabling this option will include all the identified issues in the alert.
iv) Status report settings

A status report provides a detailed report on the status of a user's Azure resources for aggregated data over the specified aggregation period in the selected hours. The status report for a Business Application will be generated only on the mentioned hours in a day for the provided frequency and aggregation period.
Users can configure to receive status reports only when there is any error status on the monitored rules by enabling the provided checkbox.
The status alert time period is completely independent of the rules evaluation frequency.
v) Monitoring alert settings
Choose the desired escalation policy to customize the notification service preferences.
- Email address - Alerts are generally sent to mentioned email addresses. Users can configure more than one email address and can also choose if the alerts can be sent to all the email addresses in a single go or as separate emails.
Recipients can be configured in two ways:
Comma-separated(,) Emails - Send separate alerts to all email addresses. Each email delivered to a recipient is counted as a separate email count.
Semicolon-separated(;) Emails - Send a single alert to all email addresses in one go. A single email count is considered here.
- Notification channels - Besides email alerts, third-party Notification channels can also be configured to receive alerts from Turbo360. Notification channels that are already configured in the Settings section, can be chosen from the displayed list.
- When both the Recipients and Notification channels are not configured, the resources will be monitored without any notifications being sent.
- The status of the resources that are monitored will be reflected in the Business Application card, Resources section, and Service Map section.
Monitoring toggle in BA Overview
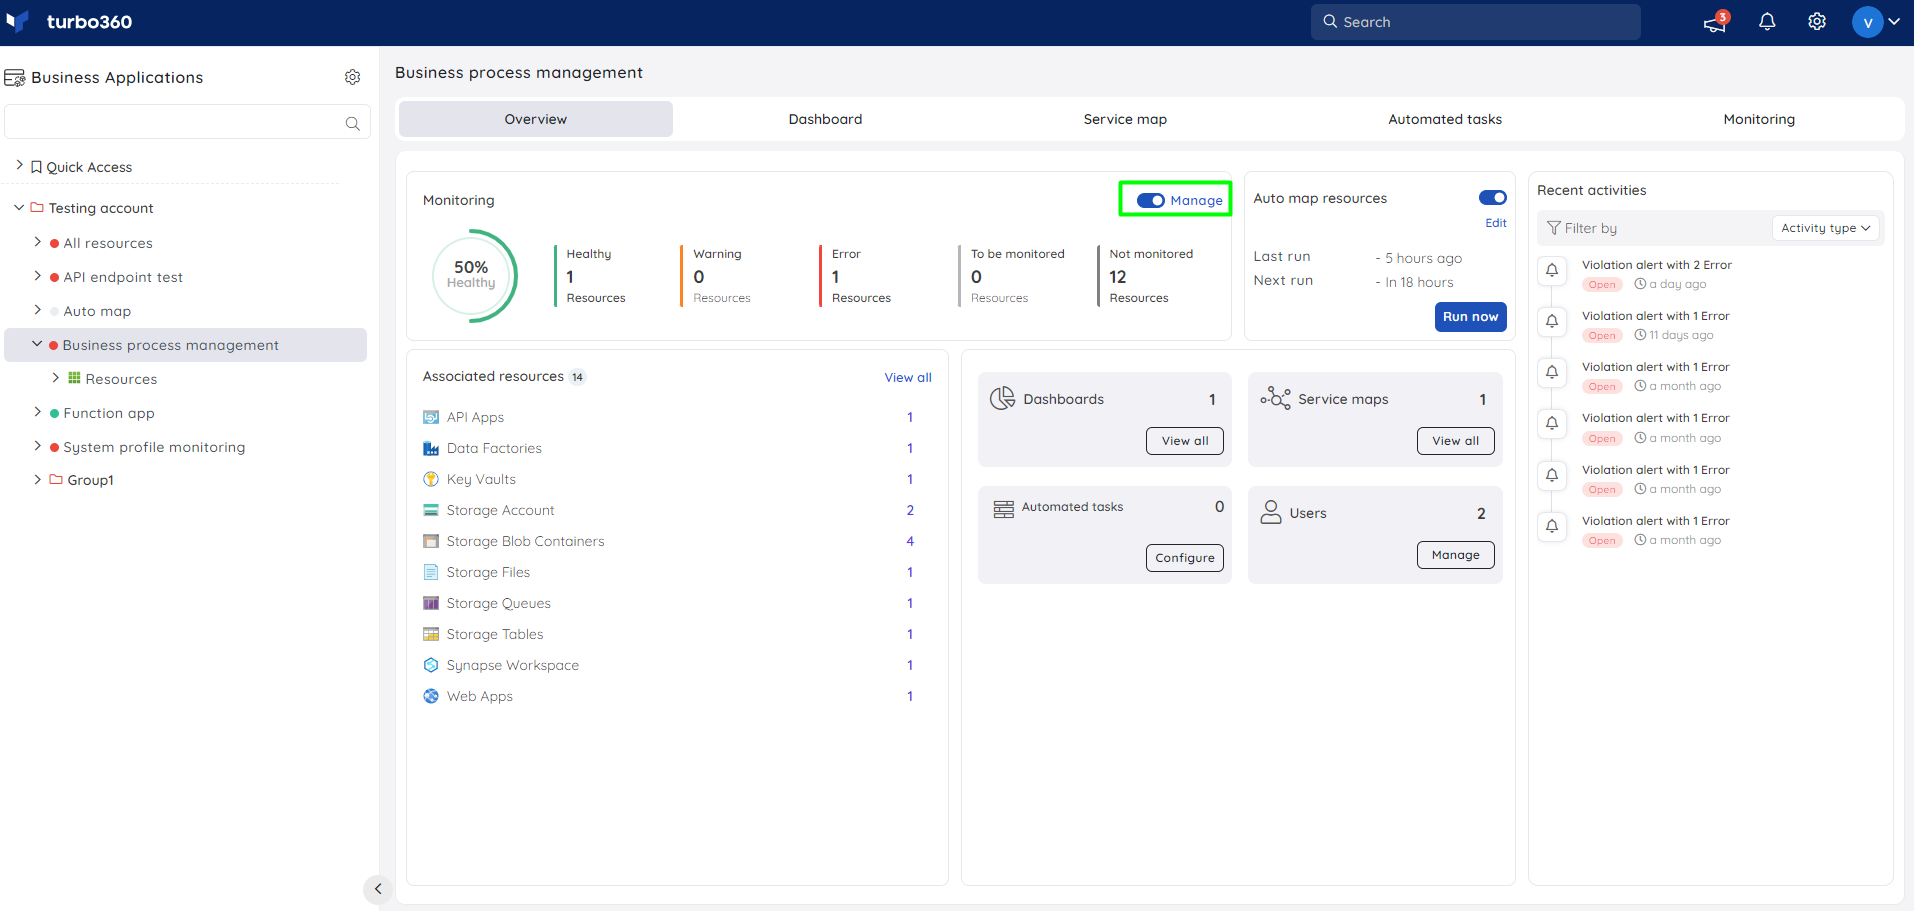
Enabling/Disabling monitoring from the Business Application Overview will completely enable/disable resource monitoring for the particular Business Application, regardless of the number of monitoring profiles configured.
Monitoring rule status
The monitoring status of a resource in a Business Application can be viewed from the Resources section where all associated resources are listed.
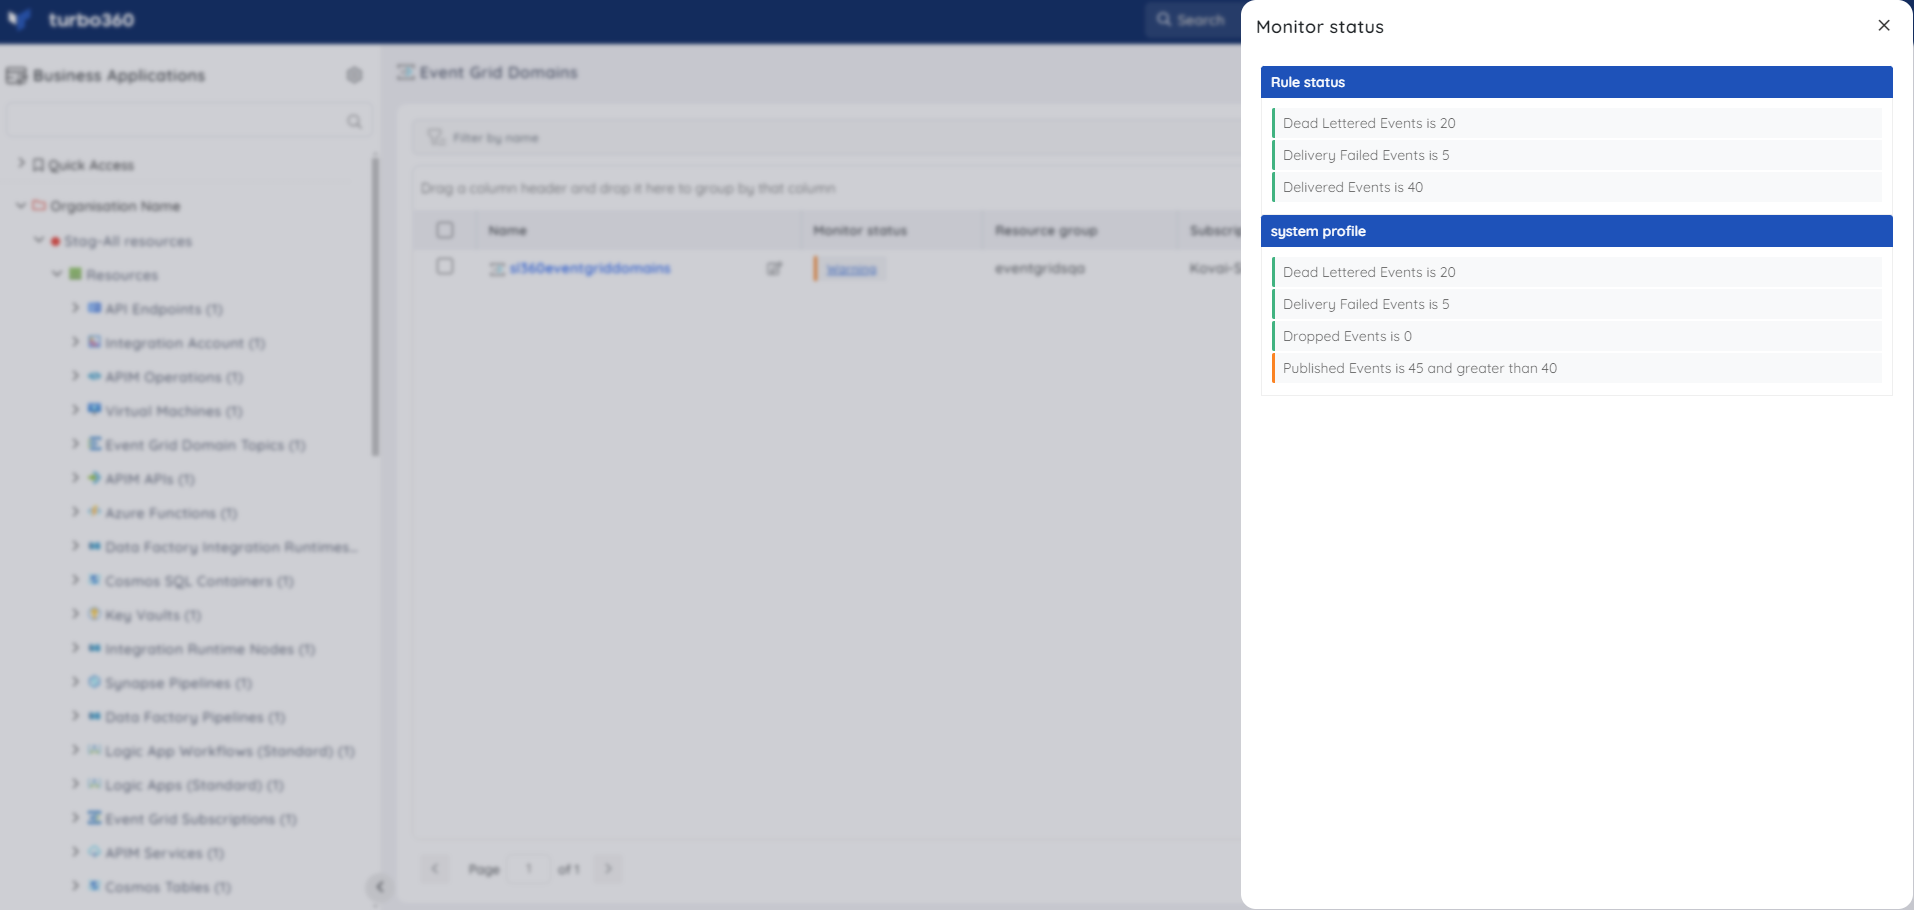
Clicking on the monitoring status of a resource will display the status of the configured rules.
The monitoring status from various profiles will have a Header as the name of the respective profile whereas the status from individual rules configuration will have a Header as Rule status.
The image shown below displays the monitor status of an Event Grid Domain resource for which the monitoring rules are configured at resource level and by using system profile:
Update resource monitoring state
The monitoring state of a resource can be updated by navigating onto the resource.
Enable monitoring option enables monitoring for the respective resource with the help of configured monitoring rules or via applied Monitoring profiles.
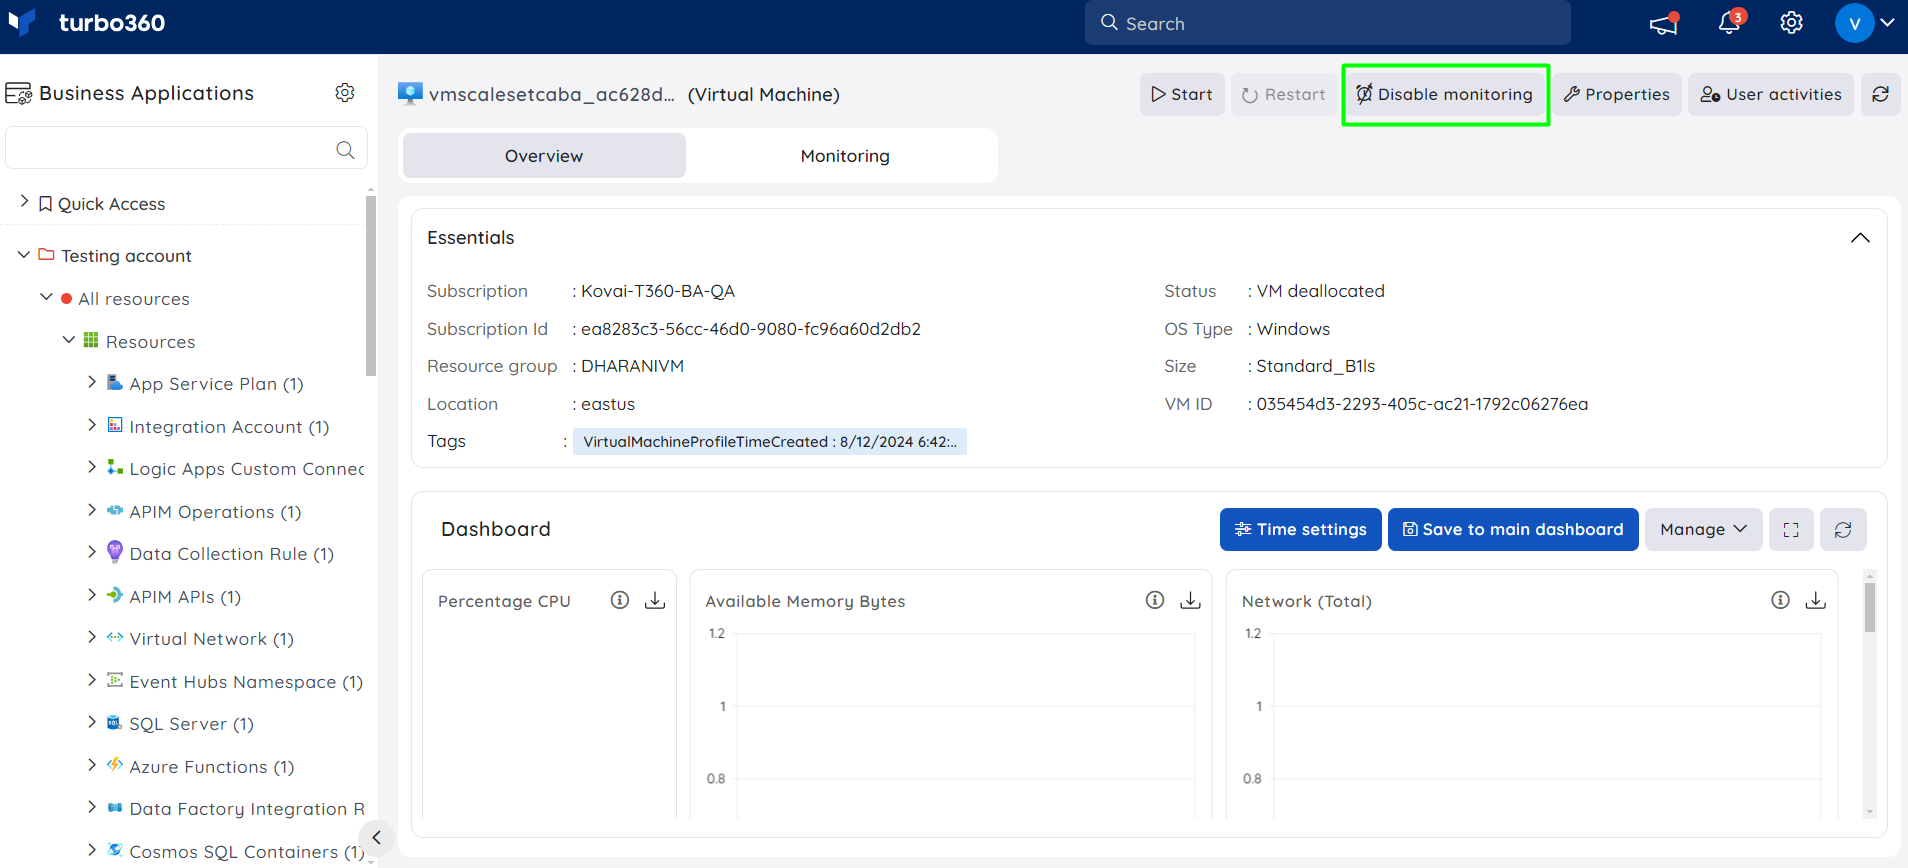
Disable monitoring option completely disables monitoring for the respective resource, irrespective of the rules configured using the Monitoring profile or by individual rules configuration.
The image shown below depicts the button allowing the user to disable monitoring for a particular Virtual machine resource which is currently being monitored.
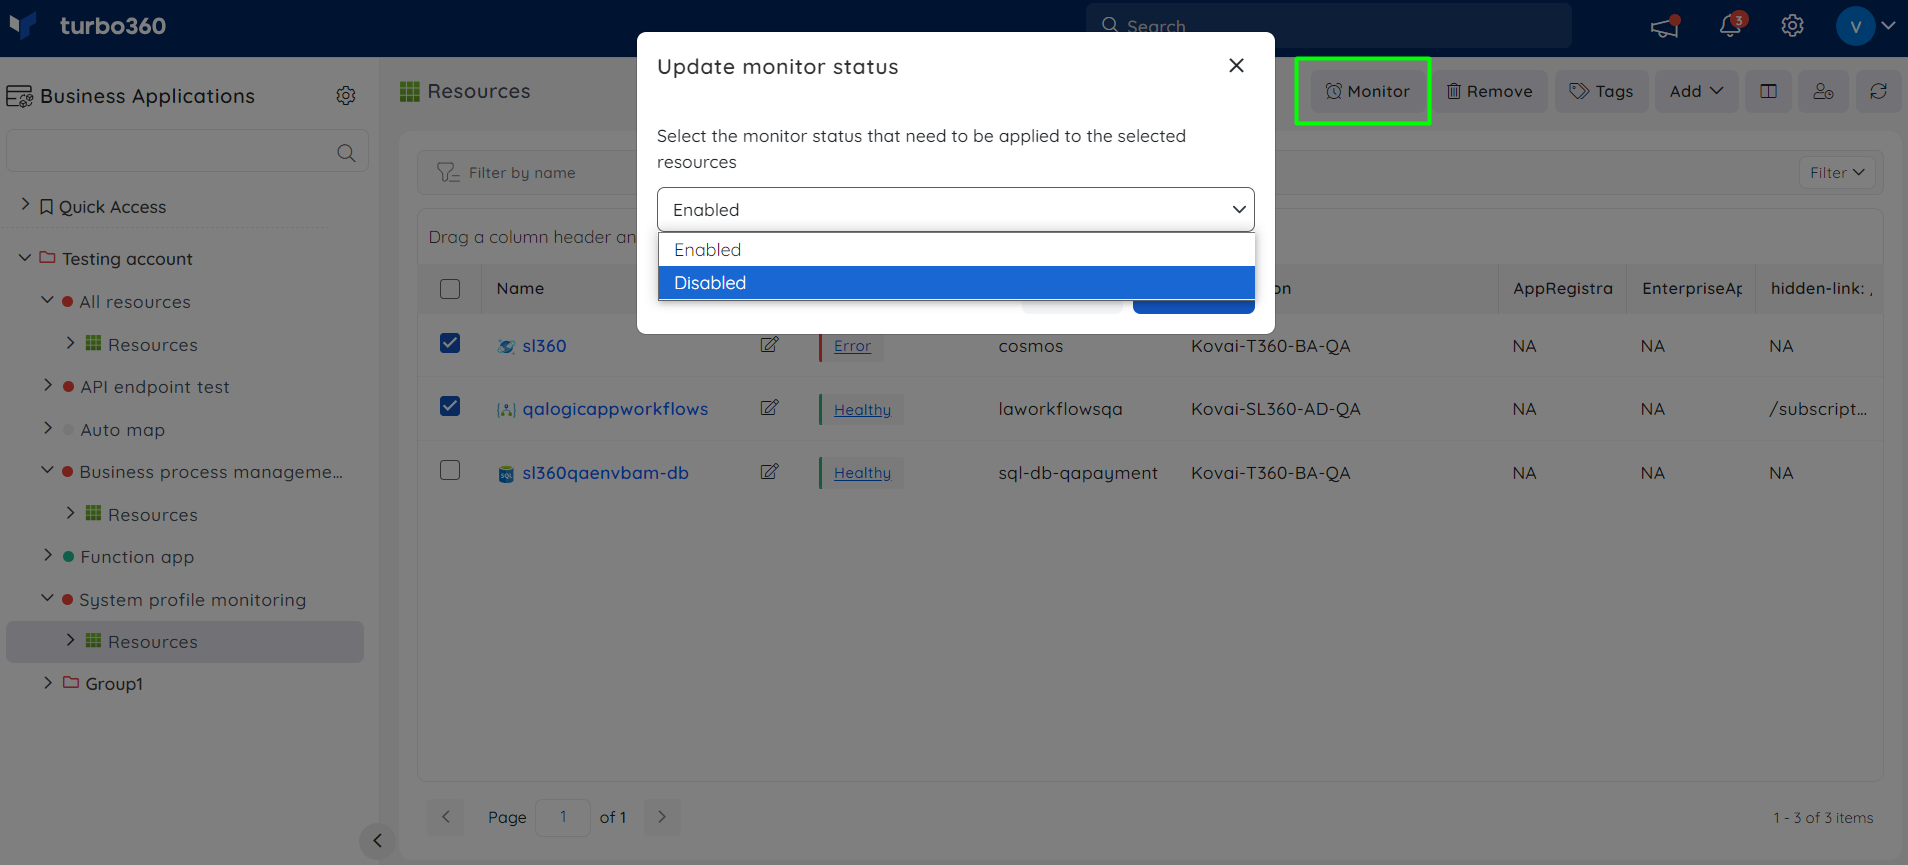
The monitoring state of resources can be updated for multiple resources simultaneously, regardless of the resource types.
- Select multiple resources from the Resources section of a Business Application
- Click Monitor
- Choose the required monitoring state for the selected resources
- Click Update
Auto correct resource status
Business Applications product allows users to automatically correct resource status without navigating to the Azure portal. This new feature relieves users with the need to check the status of resources regularly and manually modify them.
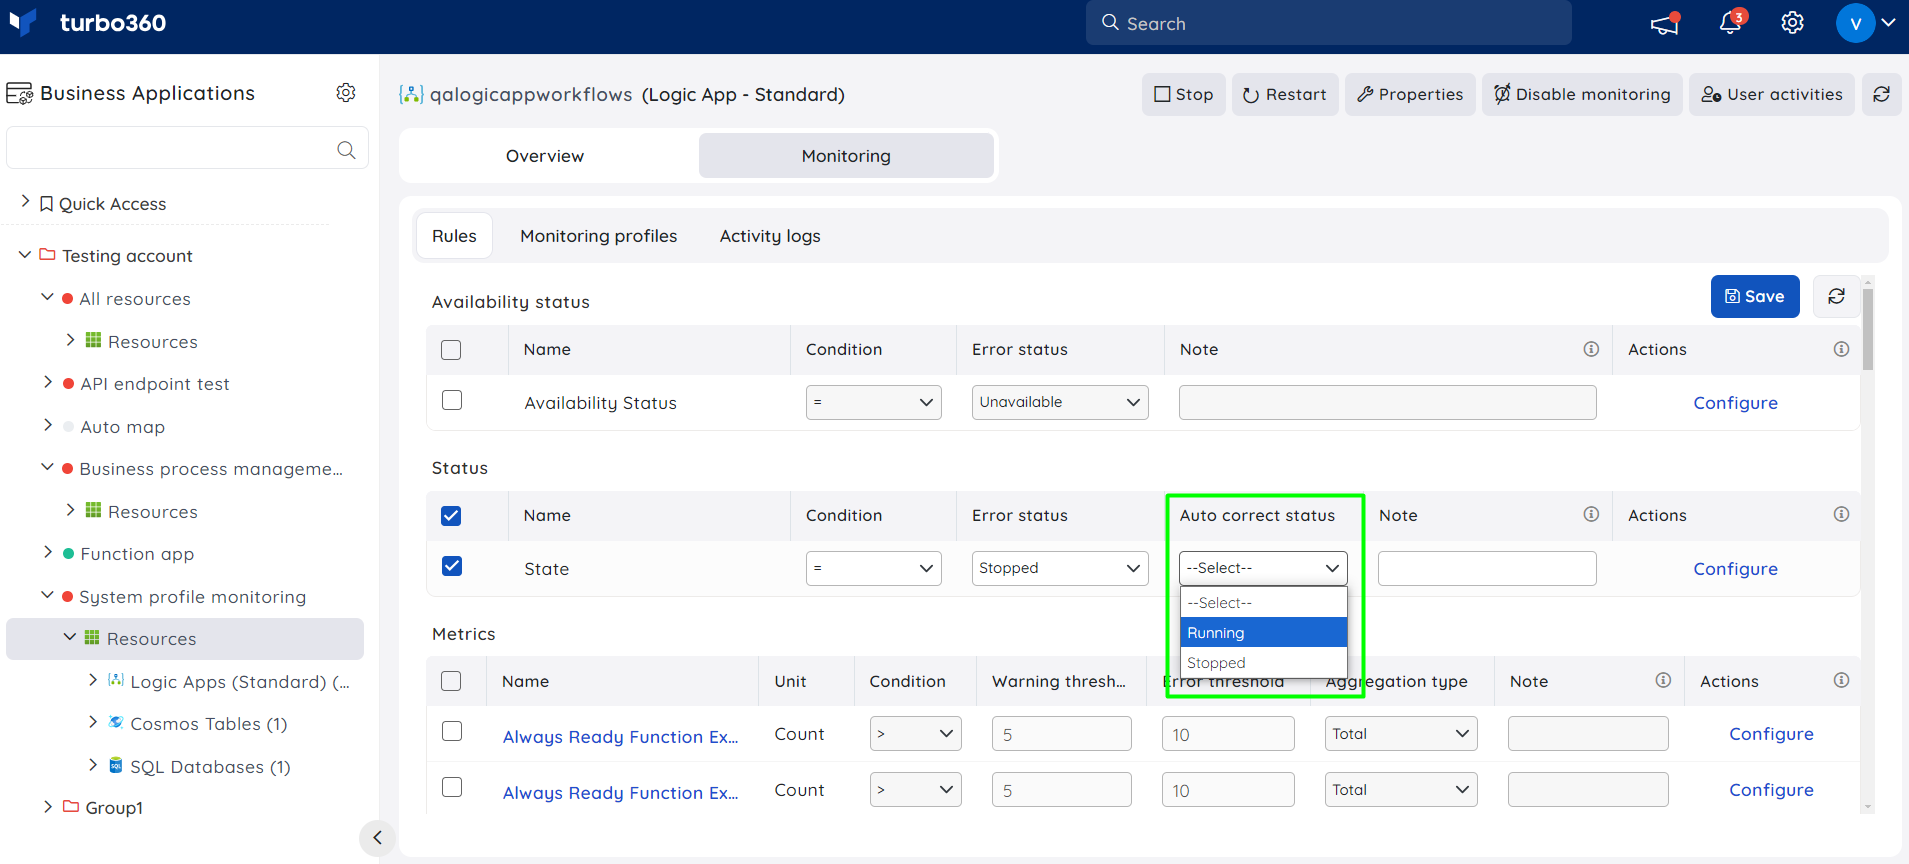
Users can set the Auto-correct status of compatible resources by configuring it when navigating to the Monitoring section of the compatible resources.
The image shown below displays the auto correct status option available within a Logic App (Standard) resource:
The list of resources that support the monitoring rule of Auto correct status includes:
- API App
- APIM Product
- Azure Function
- Azure Function App
- Databricks Compute Cluster
- Databricks Delta Live Table
- Event Hub
- Logic App
- Logic App - Standard
- Logic App Workflow Standard
- Service Bus Queue
- Service Bus Topic
- Service Bus Topic Subscription
- Virtual Machine
- Web App
- Web Job
When the Auto correct status rule is configured, the auto-correction operation will be performed using the provided status value in the specified monitoring time interval if an error status is detected.
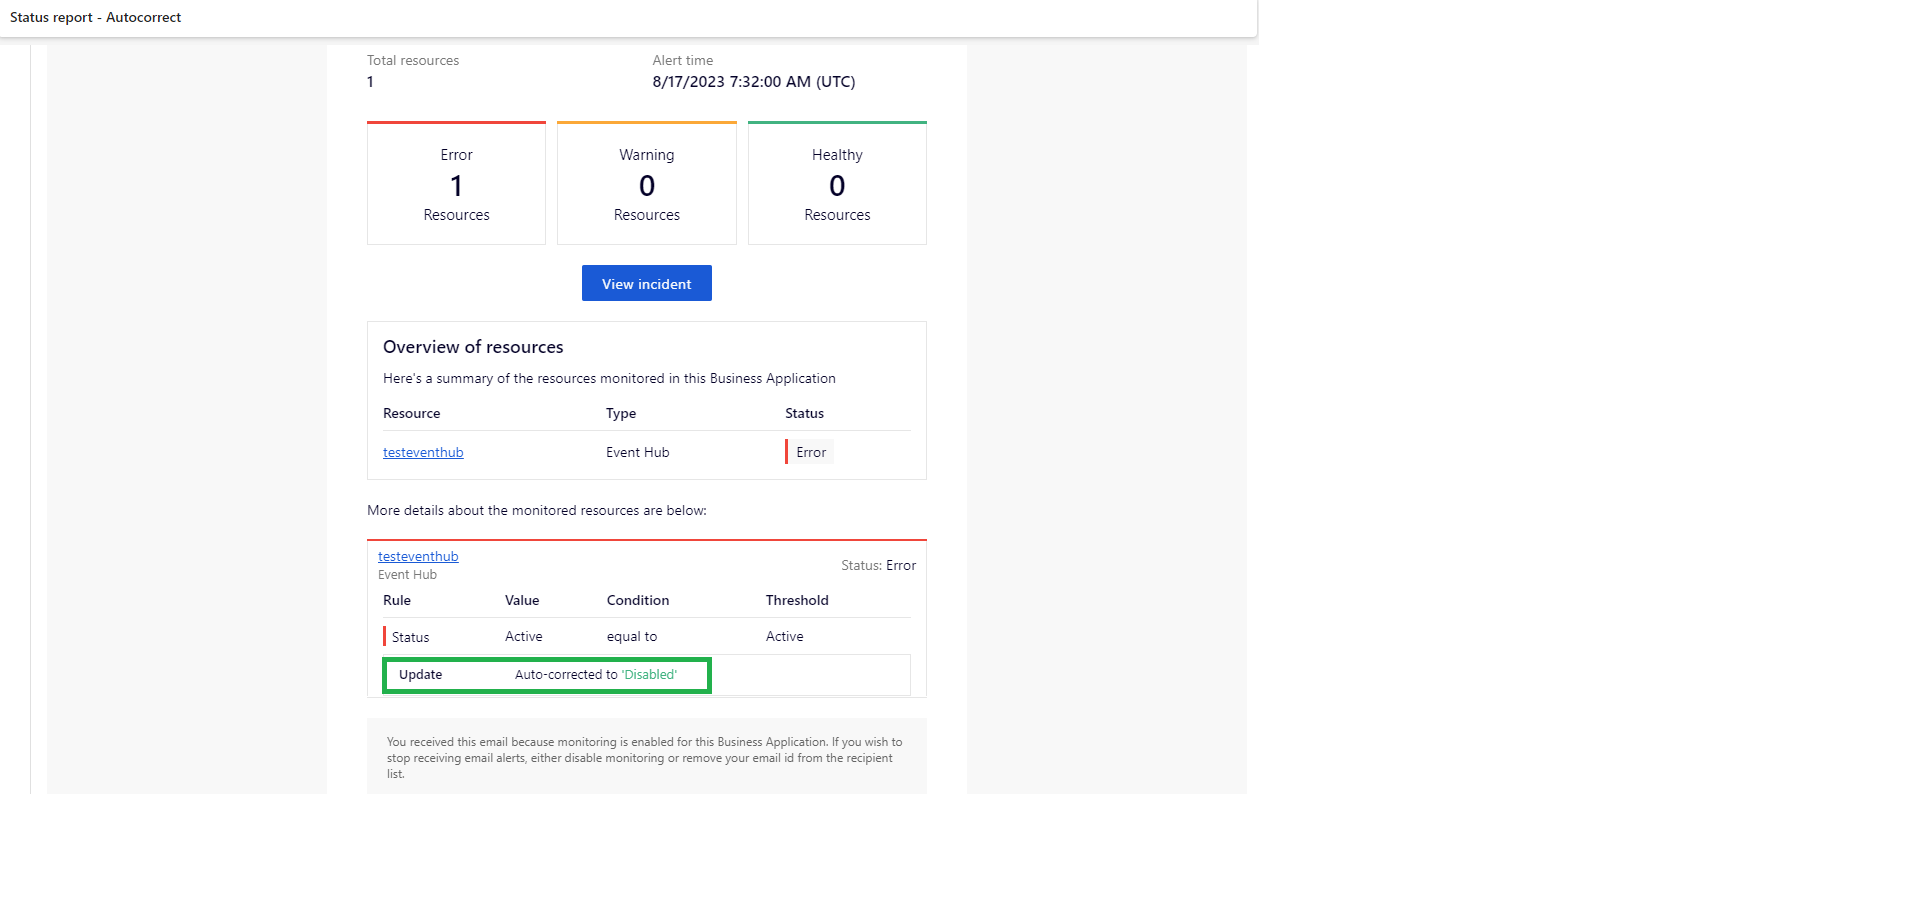
The auto-corrected information will be displayed along with the alert details generated through the configured Notification channels when an error status is detected.
The image shown below displays the auto-corrected information of the Logic App (Standard) resource received through Serverless mail:
The auto-corrected information of resources will not be displayed in the Incident details.
Automated task with rule violation
Users can configure an Automated task available in a Business Application with a resource metric to run the task once the corresponding metric is violated while monitoring.
This is possible using both the monitoring profile and the individual resource level rules configuration methods of resource monitoring.
Monitoring profile level
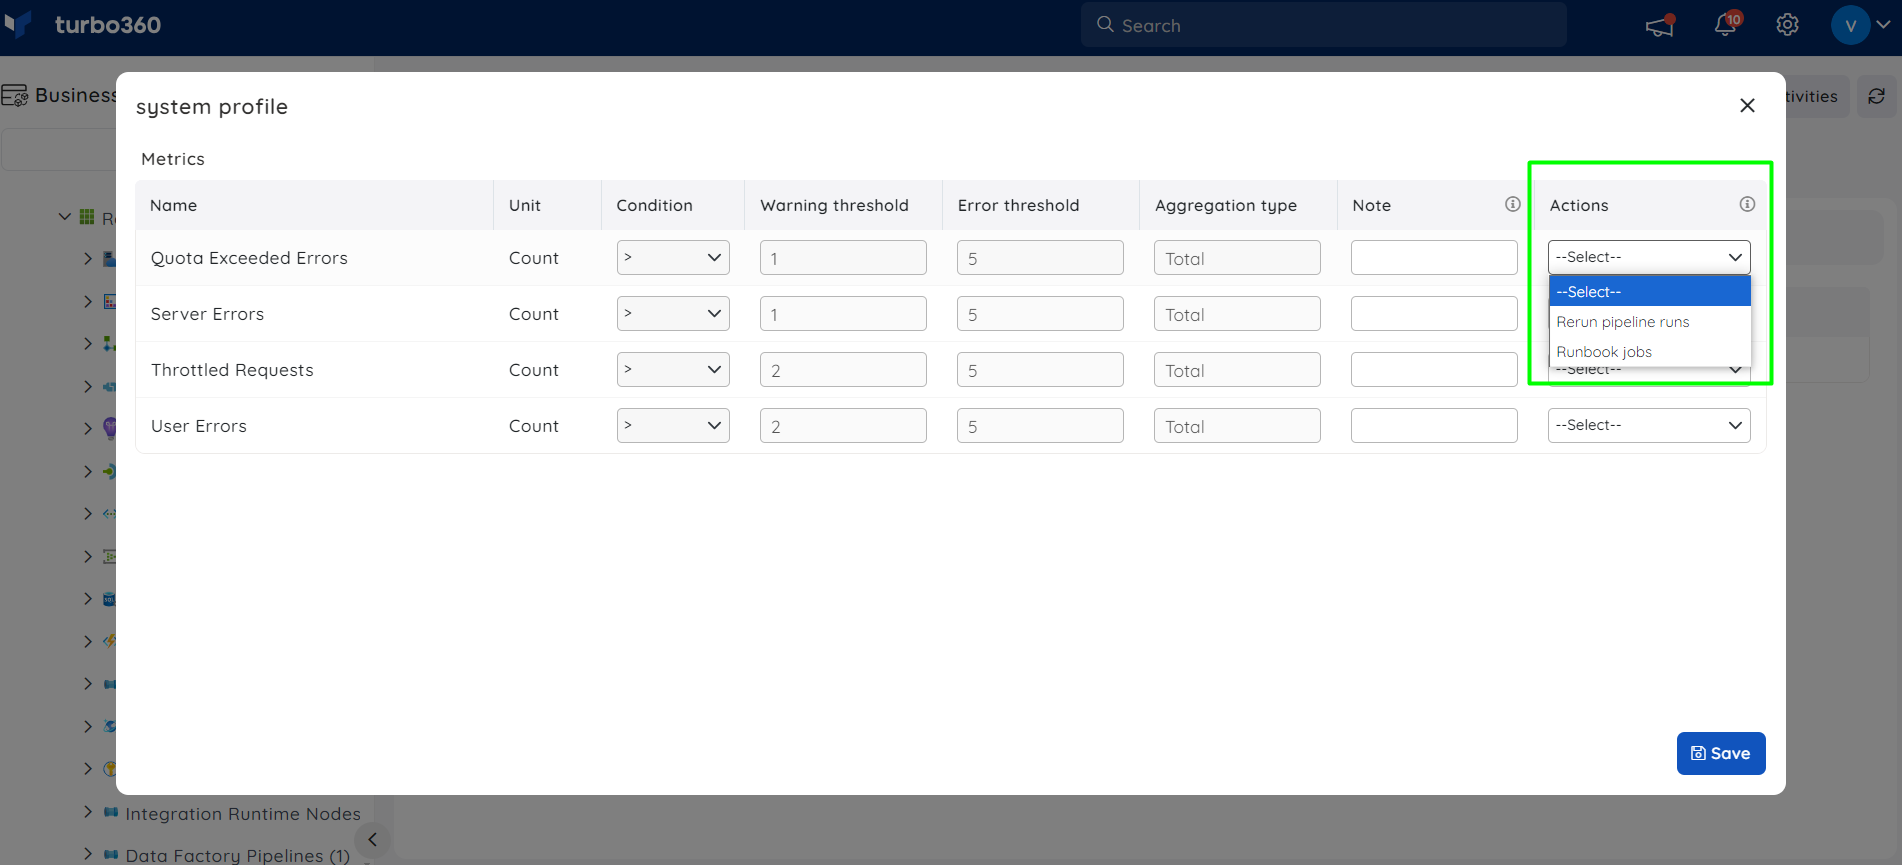
Given below is an image of the profile applied to a Business Application in which the user is configuring task for a rule violation at a profile level with respect to a resource.
Resource level
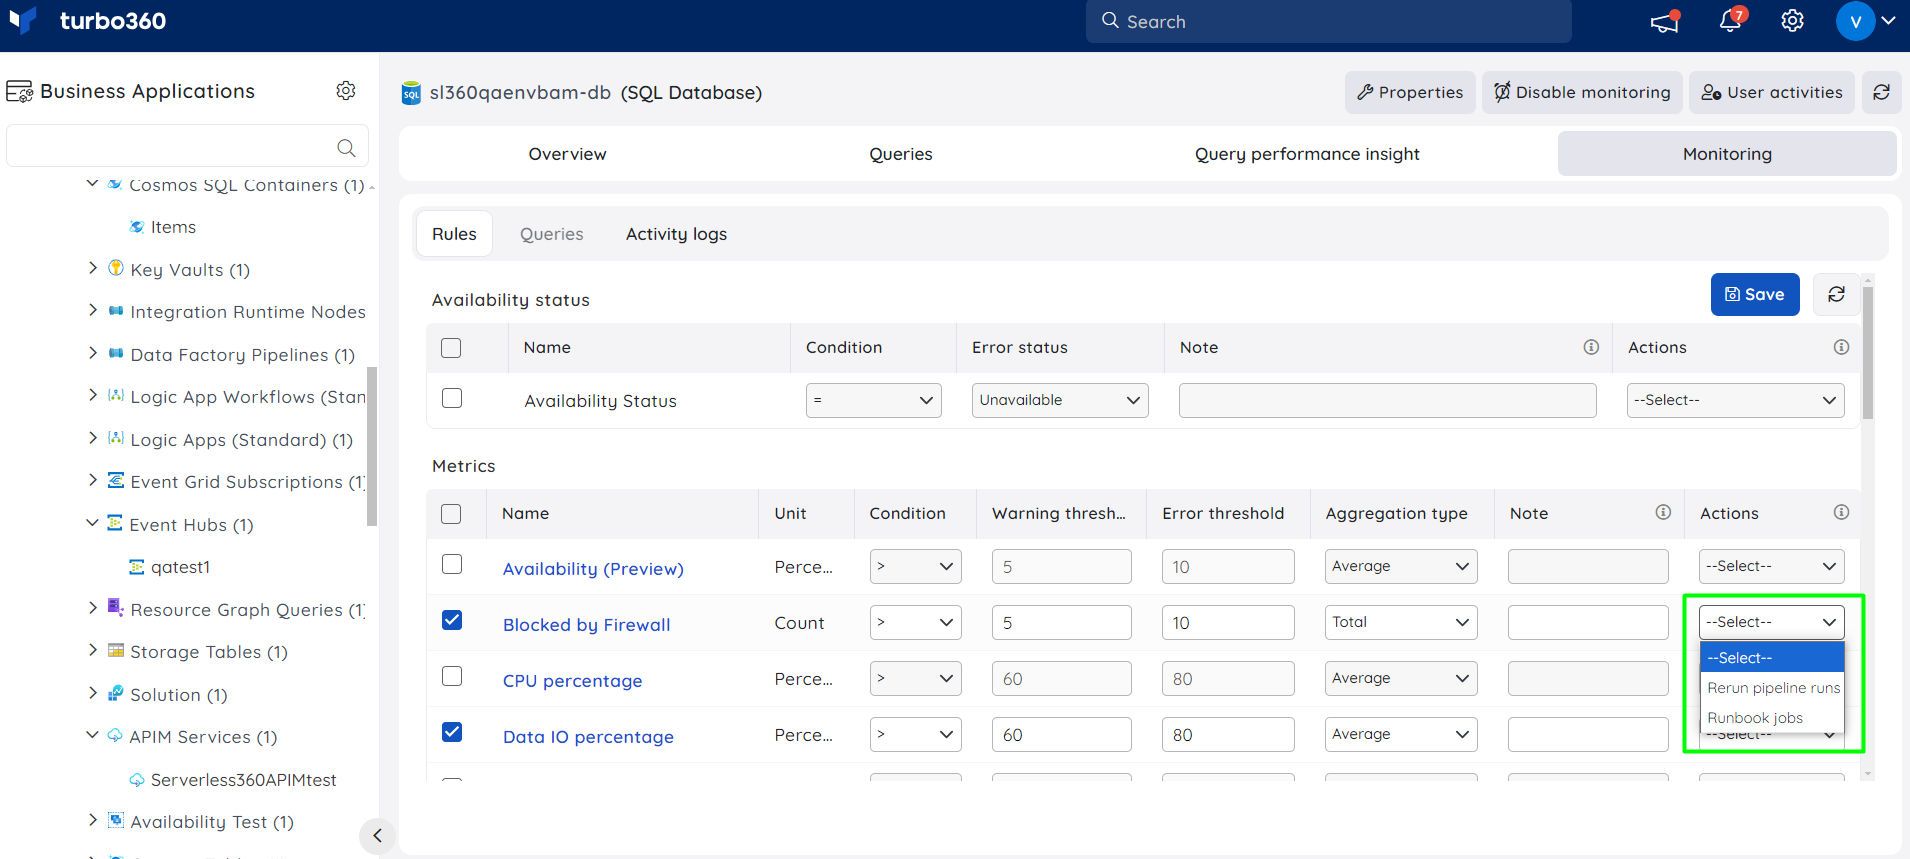
The image shown below displays the automated task configuration for a rule violation at resource level.
It will not affect scheduled automated tasks regardless of the task configuration for any monitoring rule violation of Azure resources.
The configured automated tasks for existing metric violations will only run when there is a new violation for that rule regardless of any new resource rule violations included with the existing rule violation.
The automated task configured for any metric violation will not run if the corresponding metric is in a warning state while monitoring the respective resource.
Resolution Notes
A resolution note is a brief description provided by the user for any rule violation. The provided note will be sent along with the respective rule violation alert notification in the configured channels.
Monitoring profile level
Any modifications made to the resolution note from the profile view in the monitoring section of the associated resource will only impact that specific resource, not the entire monitoring profile.
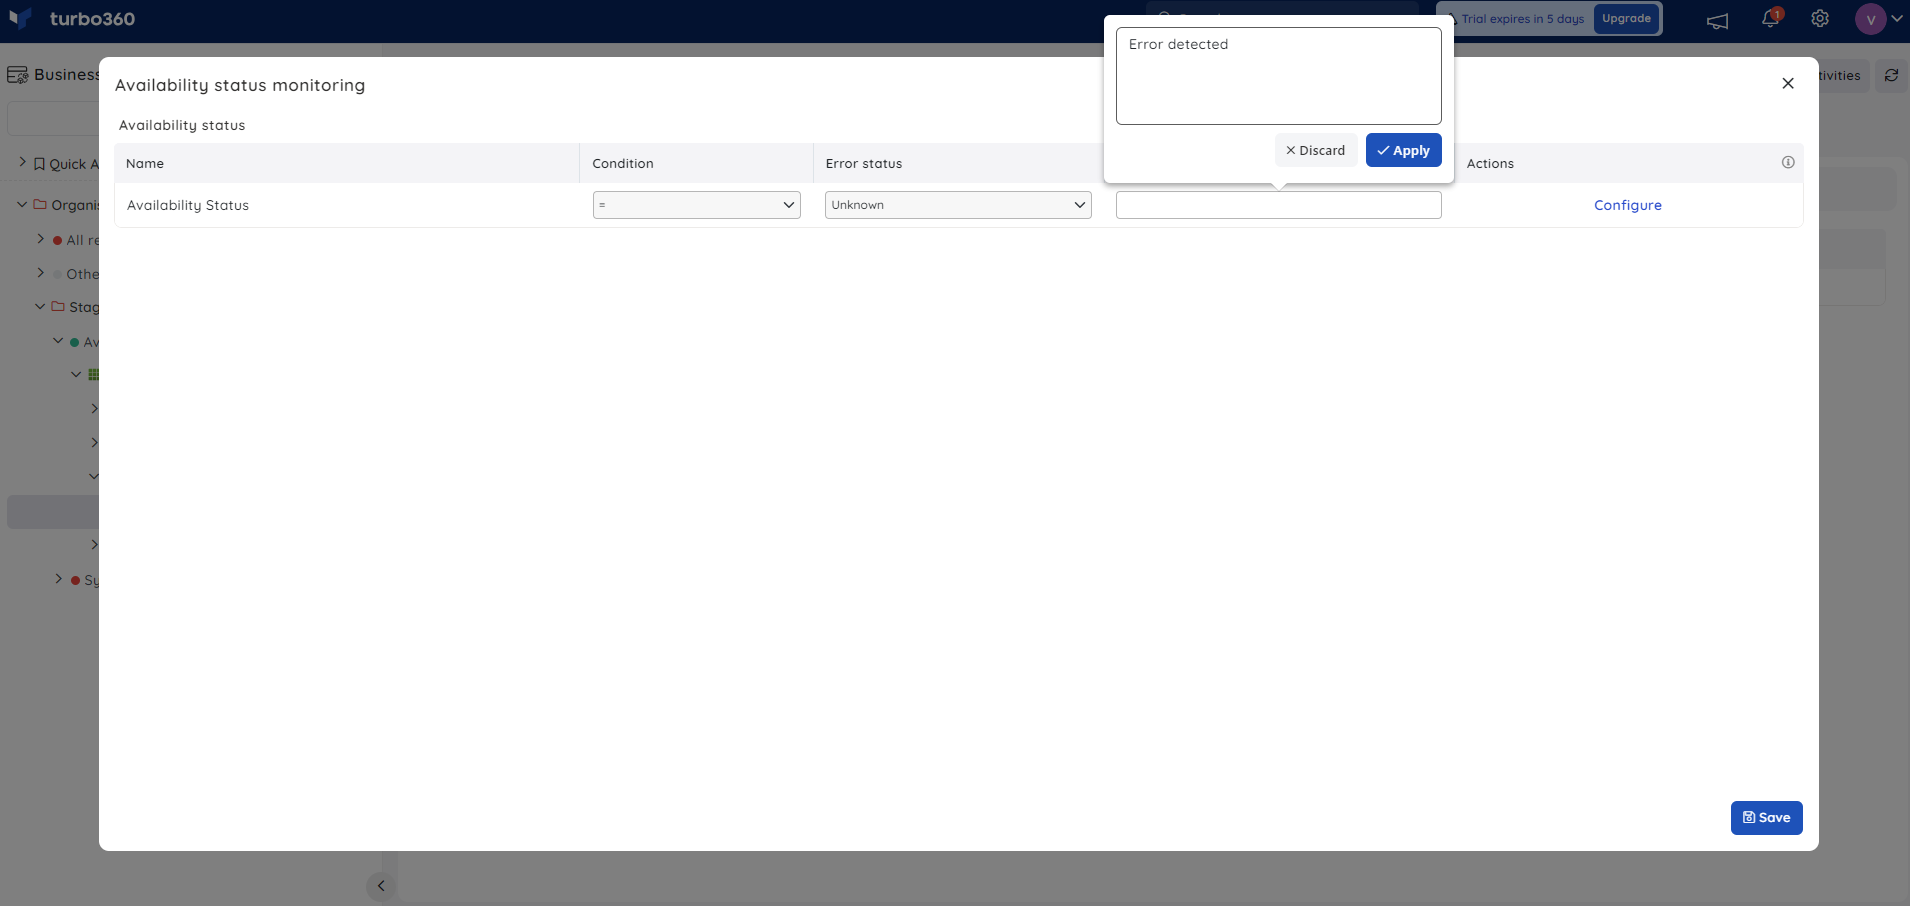
The below image shows how to configure resolution notes for a rule violation at a profile level:
Resource level
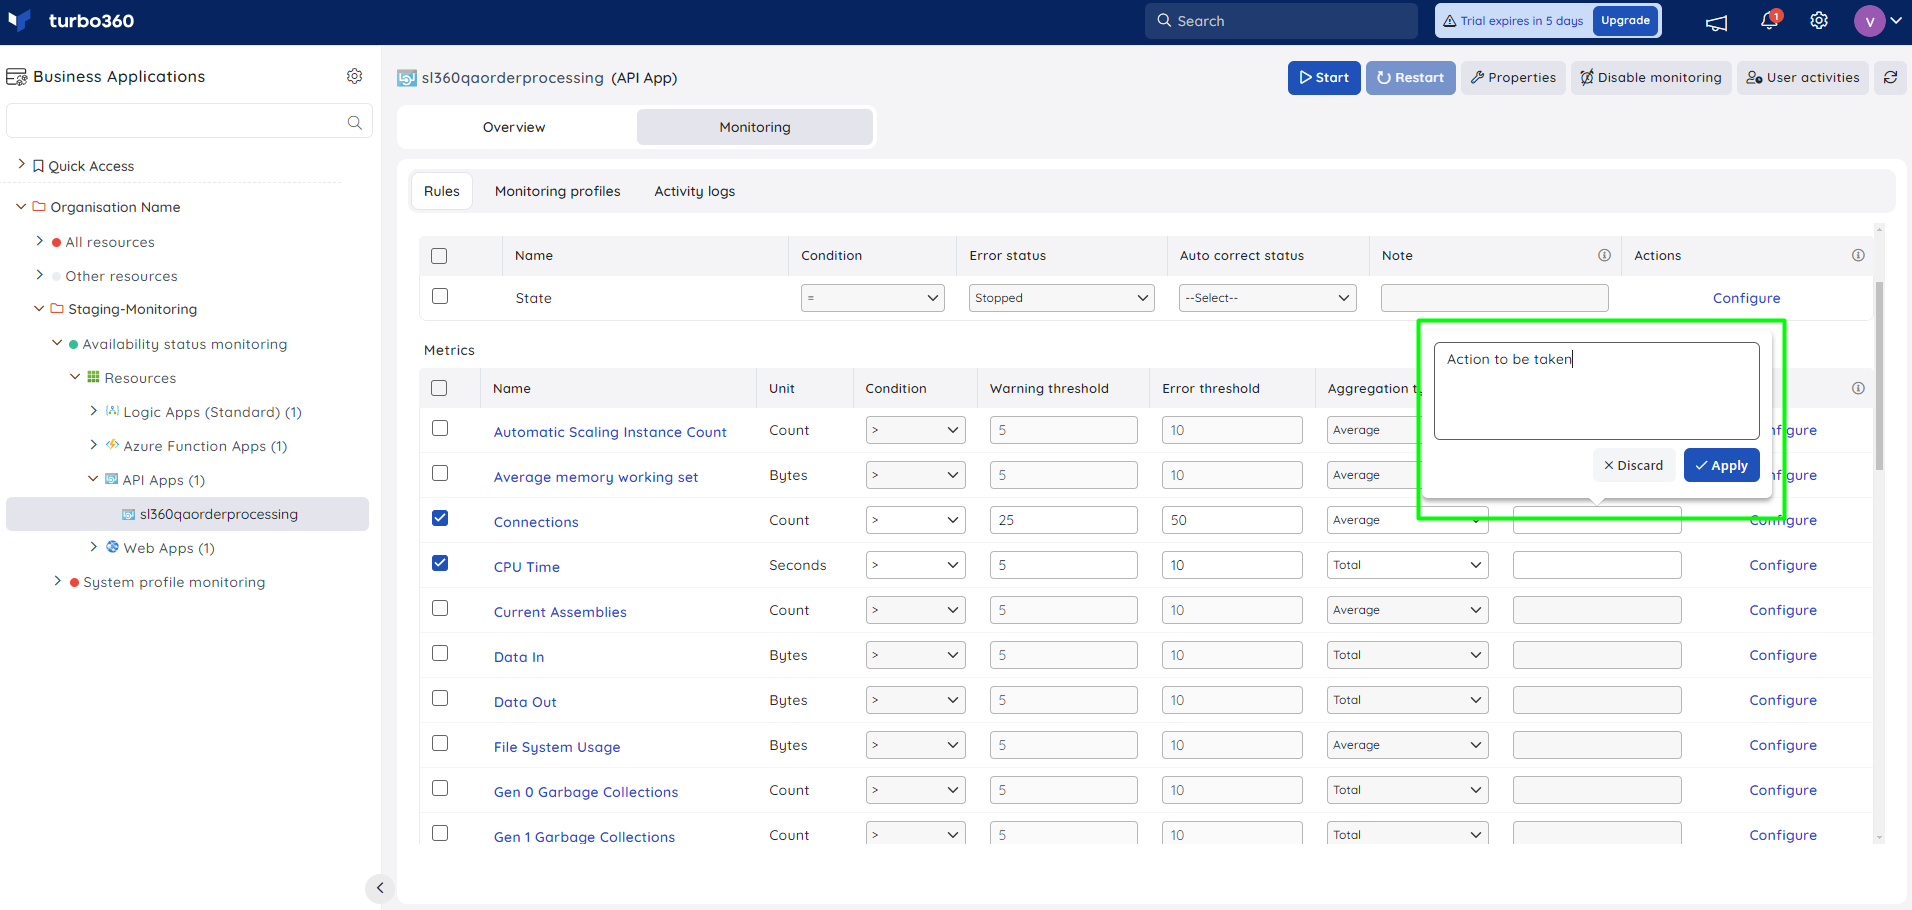
The below image shows how to configure resolution notes for a rule violation at a resource level:
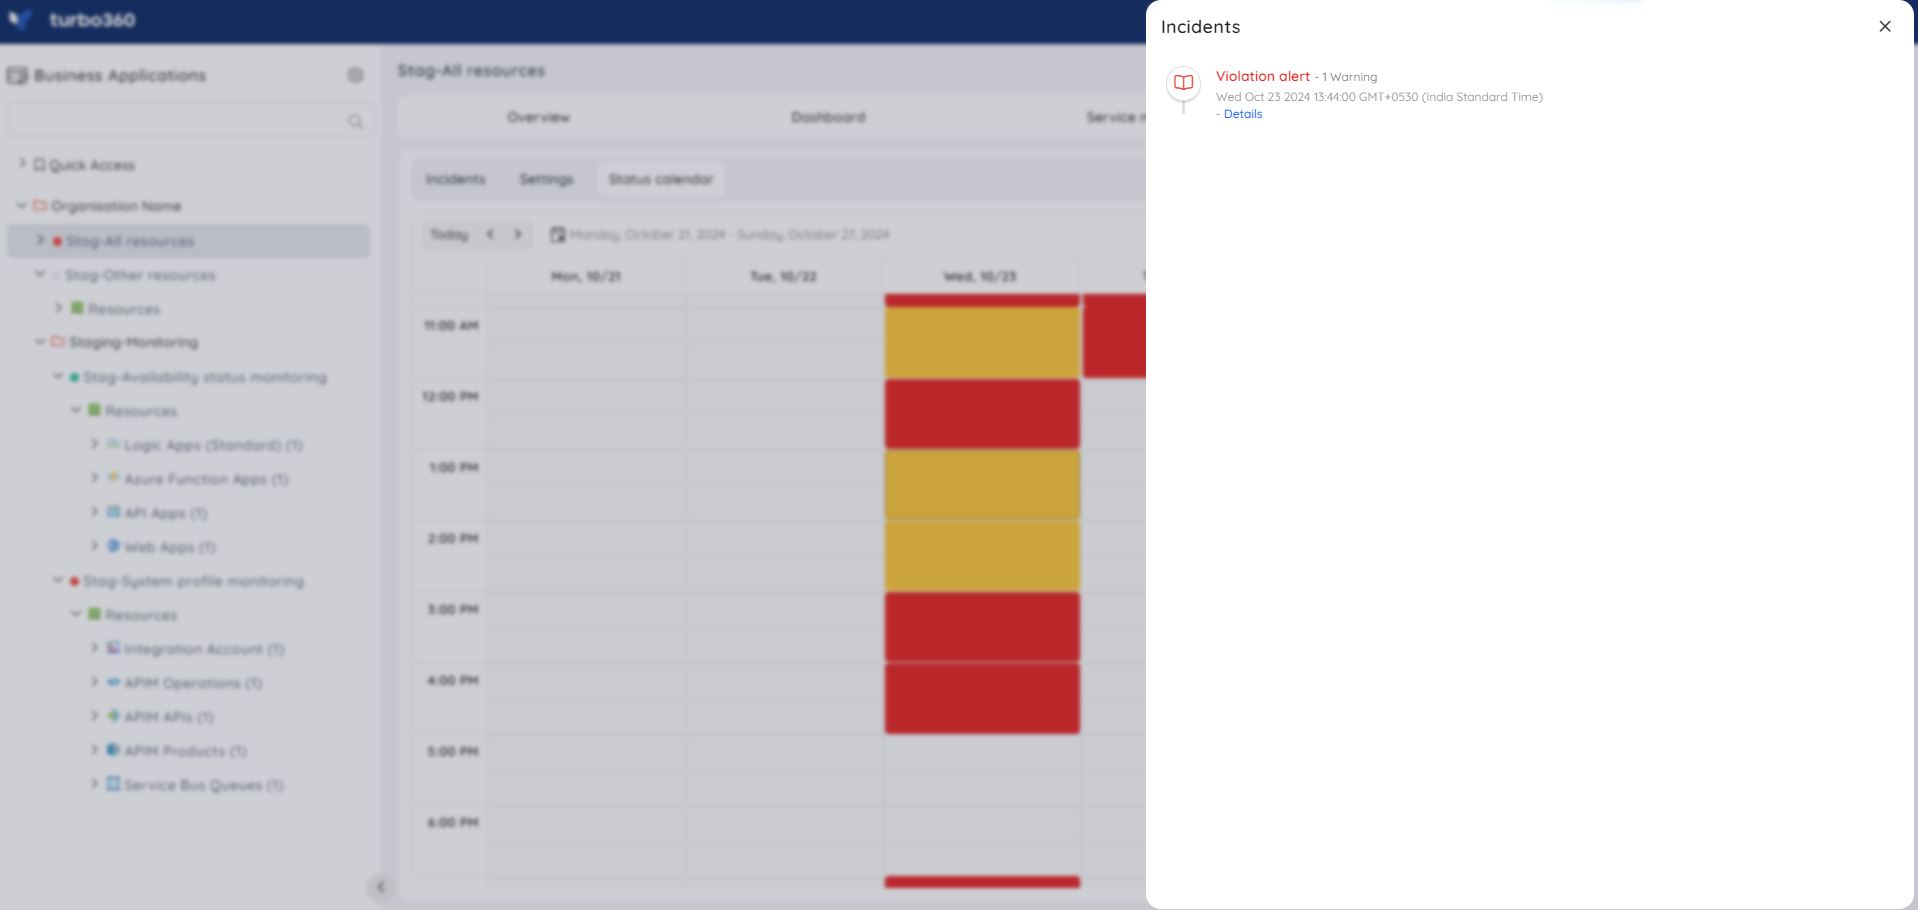
Status Calendar
Users can view the historical summary of the Business Application's alert status in a calendar format. Data from the past 30 days will always be accessible for reference.
Summary alerts
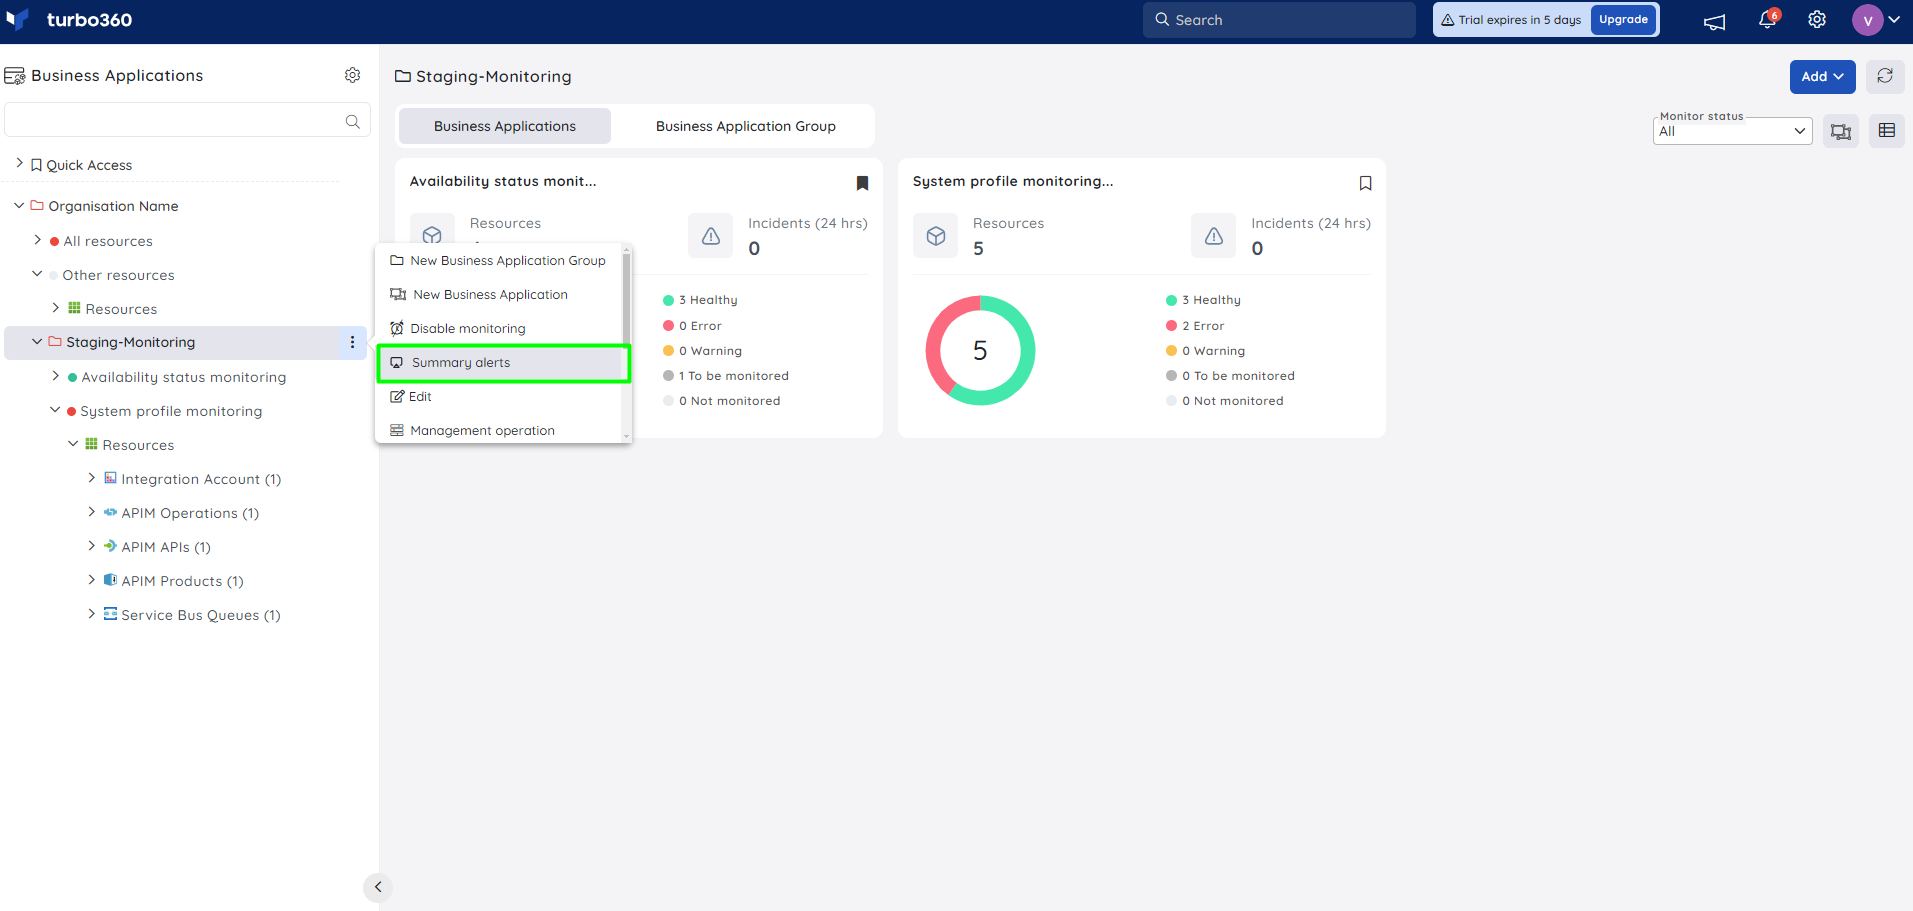
- The health report summary for Business Applications available within a Business Group can be enabled by selecting the Summary alerts option from the context menu of the relevant group in the tree view.
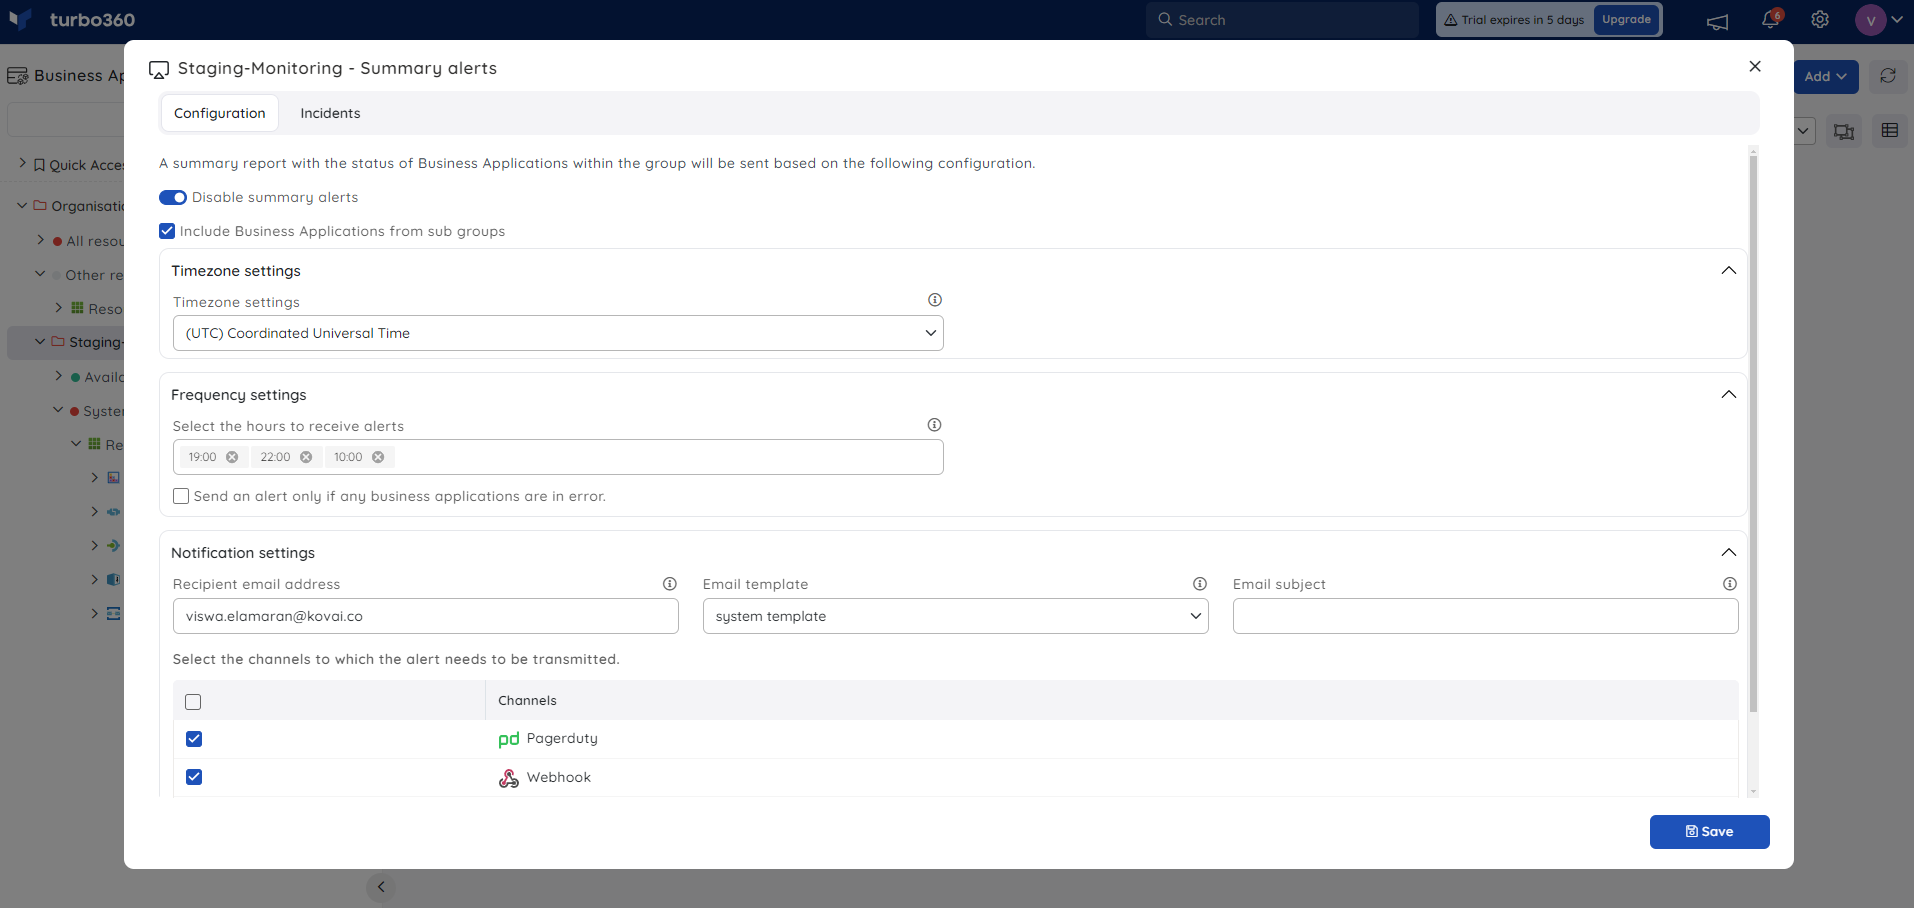
The summary alert provides in-depth information about the health status of all Business Applications in the associated Business group, along with a breakdown of the health status counts for the available resources.
The monitoring summary of sub-groups available within a Business Group can also be included in the summary alert by enabling the Include Business Applications from sub groups checkbox.
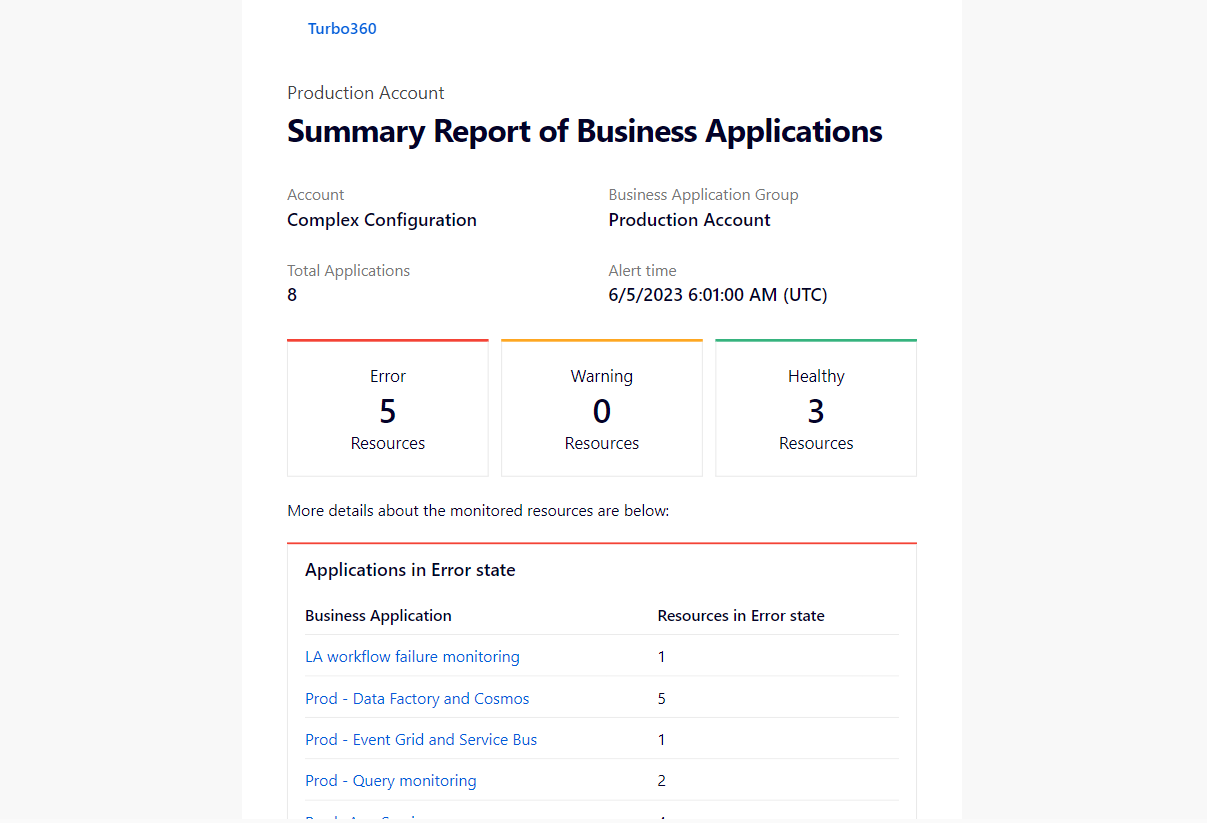
- Clicking the Business Application name in the Summary Alert navigates the user directly to the Overview section of the corresponding Business Application. This navigation is available only in the email notification.
The below image displays the Summary alert for Business Applications received through Turbo360 mail:
A user with Contributor (or) Owner role can only update the Summary monitoring configuration for the Business Applications.

