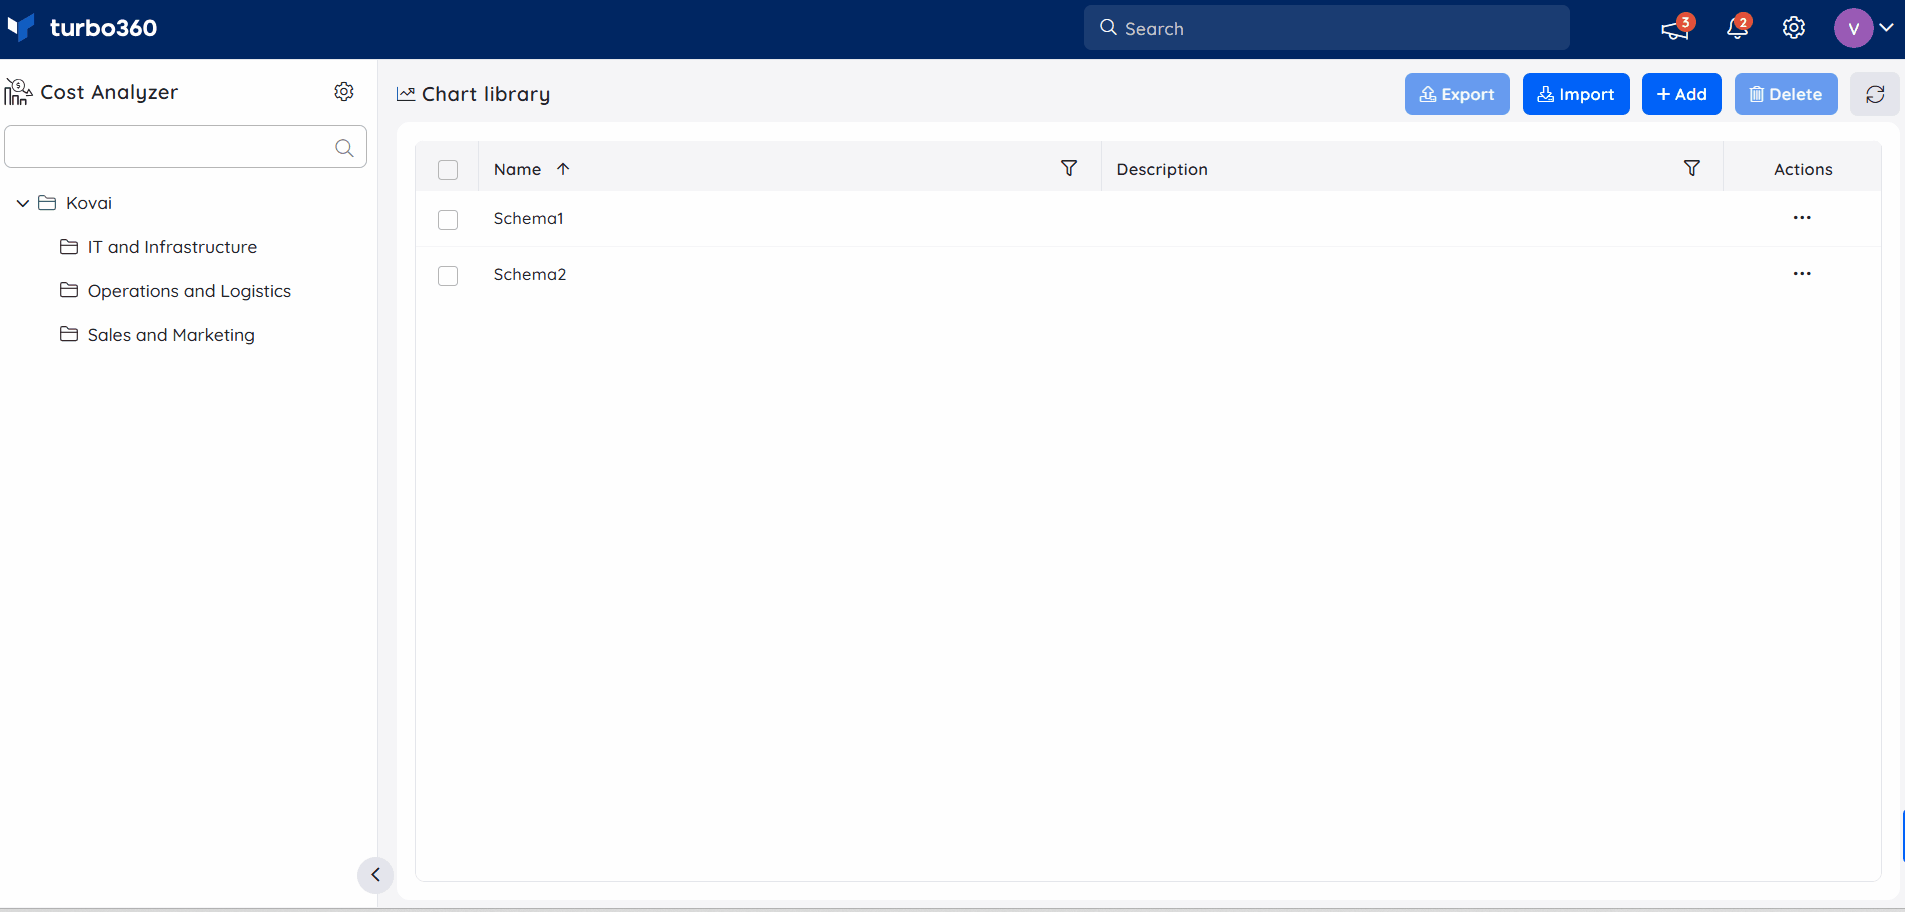
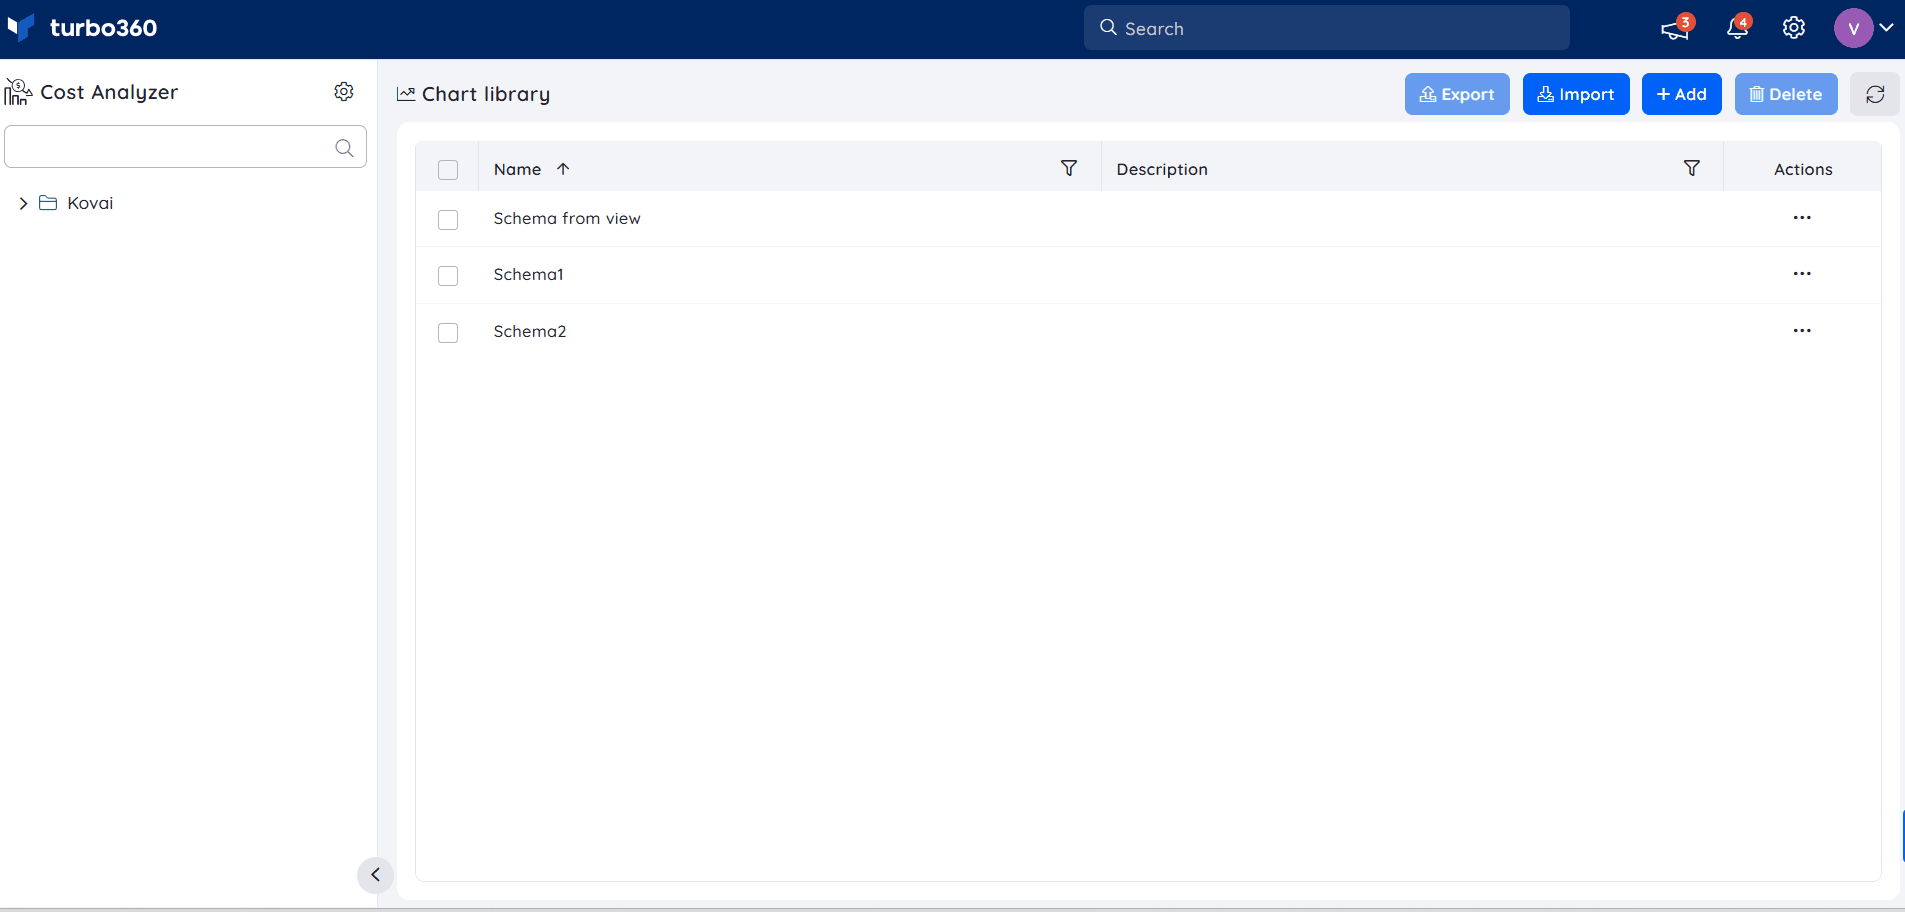
Chart library
- 12 Feb 2026
- 3 Minutes to read
- Print
- DarkLight
- PDF
Chart library
- Updated on 12 Feb 2026
- 3 Minutes to read
- Print
- DarkLight
- PDF
Article summary
Did you find this summary helpful?
Thank you for your feedback!
Introduction
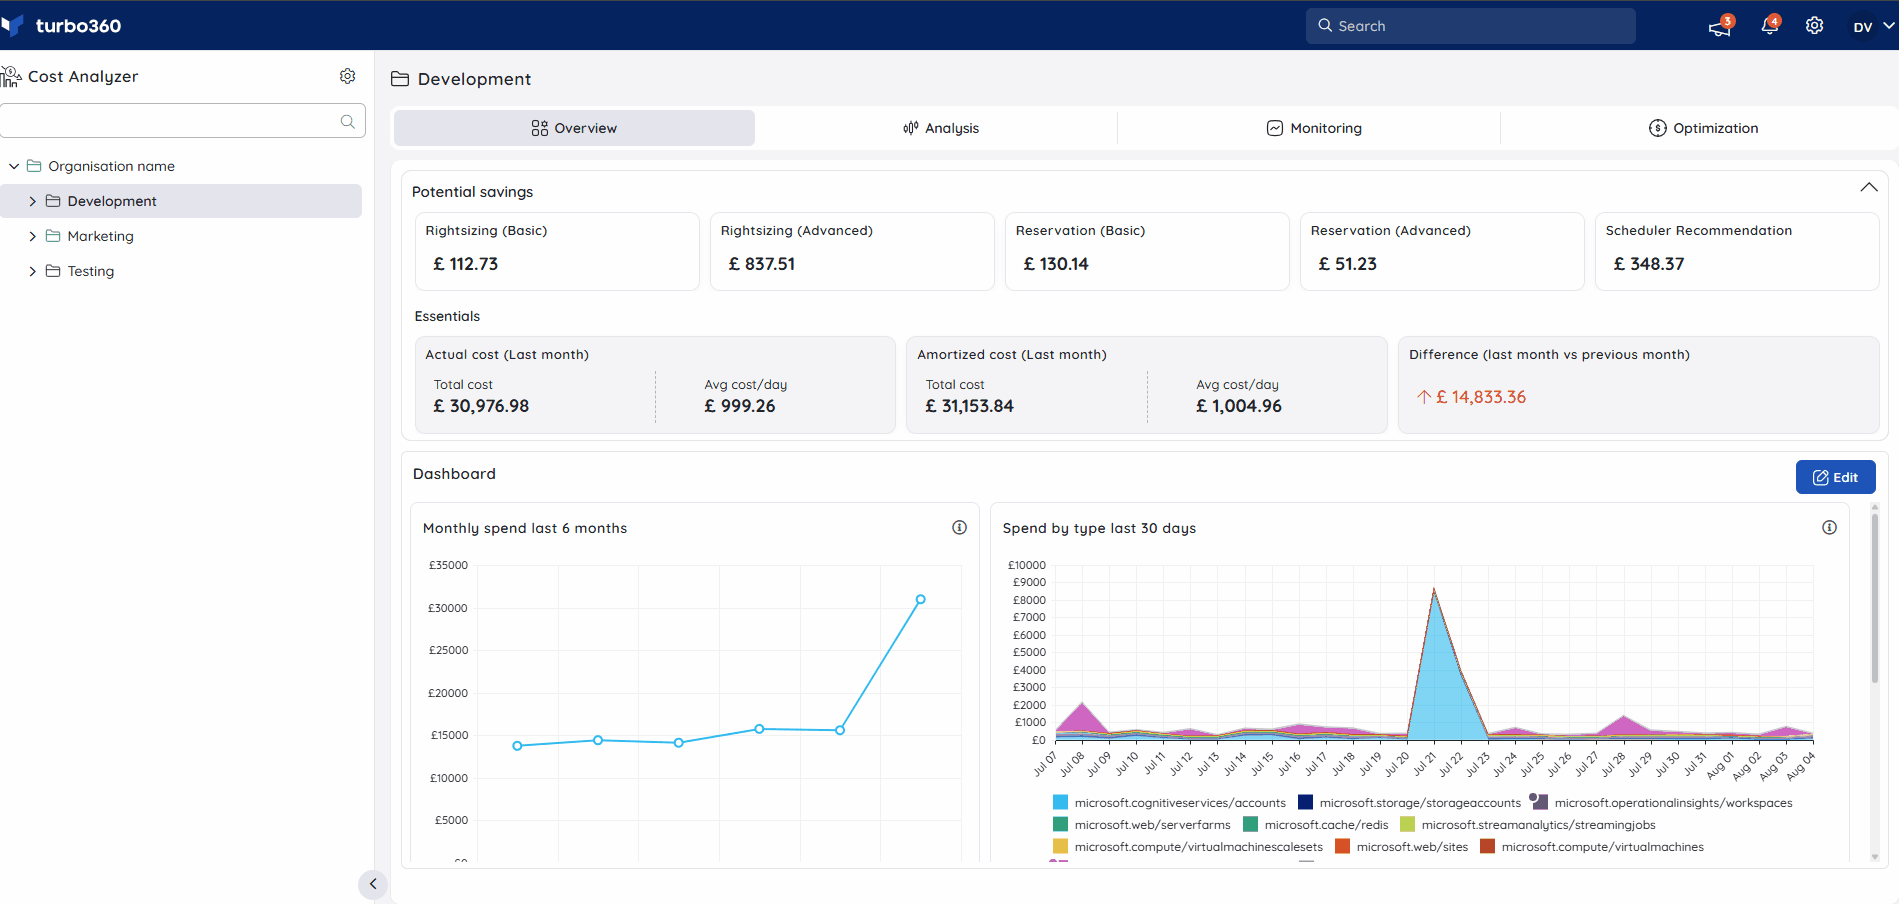
The Chart library in Cost Analyzer acts as a central location for creating and managing chart schemas. These schemas can be easily applied to cost analysis views, ensuring consistent, customized insights across cost groups.
A chart schema is a saved set of filters, groupings, and configurations that define how cloud spending data is visualized, helping users quickly personalize and standardize their analysis
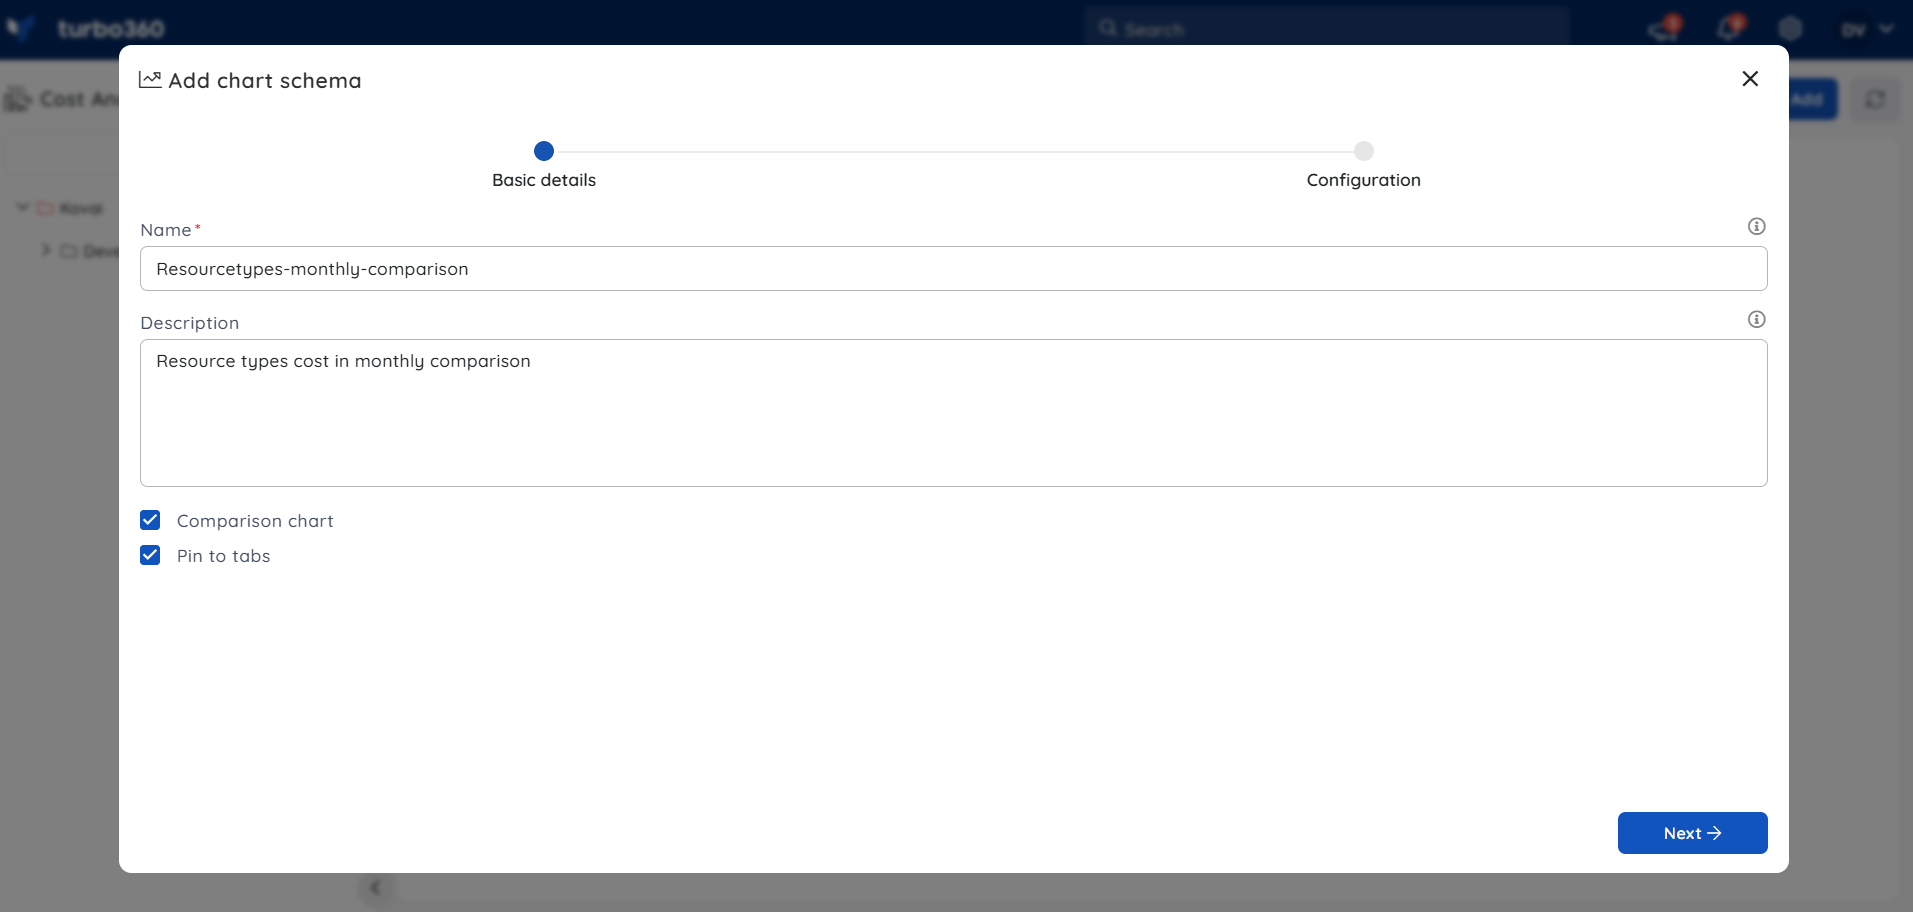
Add chart schema
- Navigate to Settings -> Chart library -> Add to start creating a schema.
- Enter a unique name for the chart schema and provide a description to help differentiate it from others.
- Enable the Comparison chart option to see a preview of the schema in a comparison format.
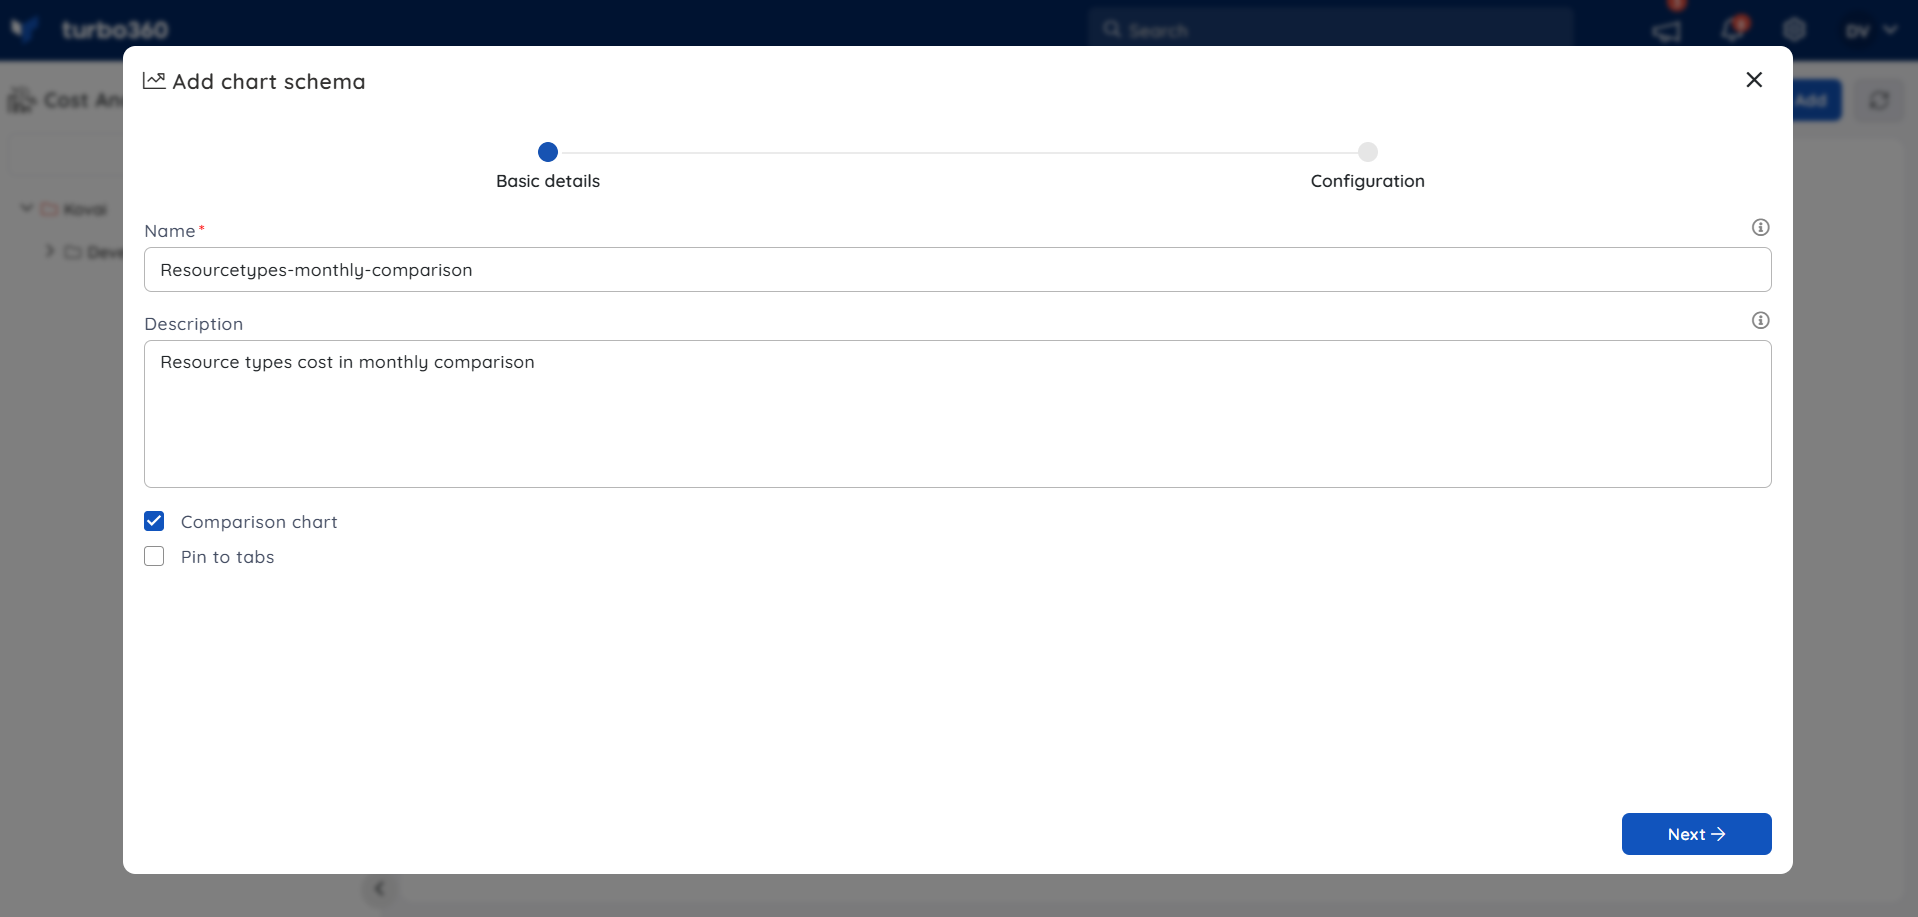
- Check the Pin to tabs option to secure the chart schema as an Analysis view within the associated Cost group.
Checking the Pin to Tabs box will pin the Analysis view with the applied schema in Cost Analysis and save it to Saved Views.
- Click Next to move on to customizing the analysis filters.
- Configure the filters to meet the criteria for quickly aligning cost details in a cost group with the schema when accessed from the Cost library in the Analysis view.
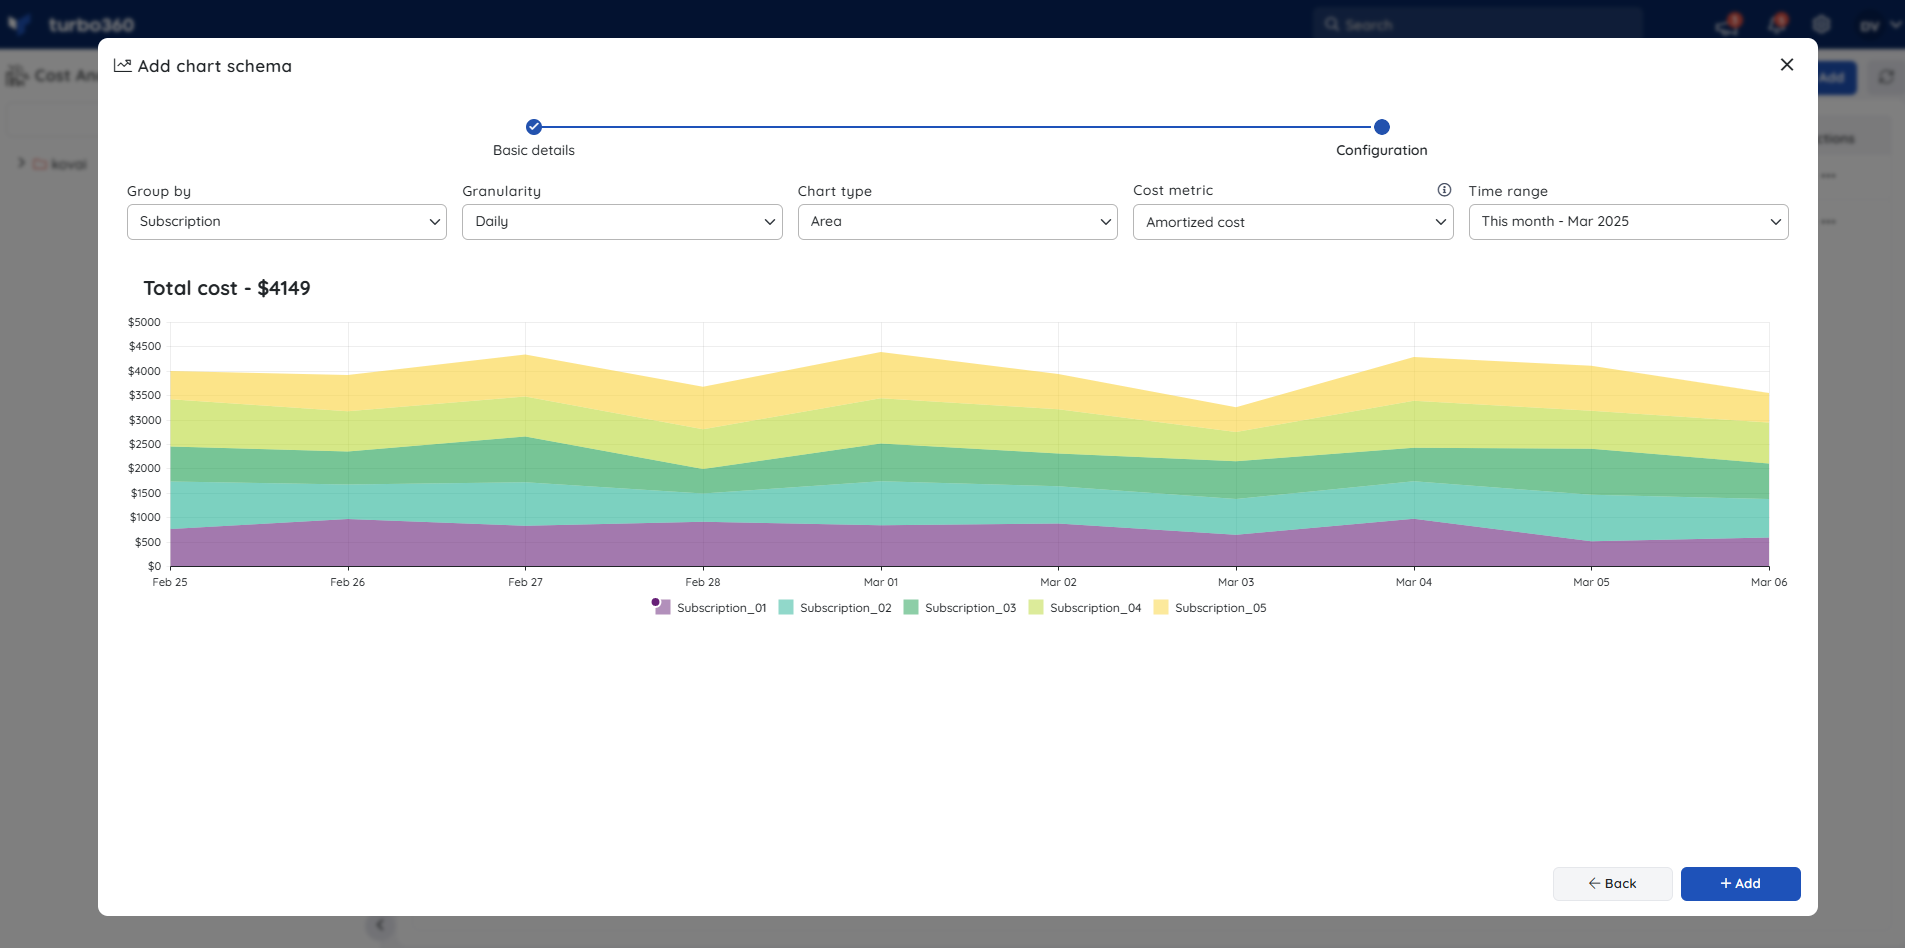
The Subscription filter is excluded from the chart schema. When the schema is applied to a Cost group, it will be applied to all subscriptions within the selected Cost group when accessed from Cost Analysis.
- Click Add to create a new chart schema in the Chart library.
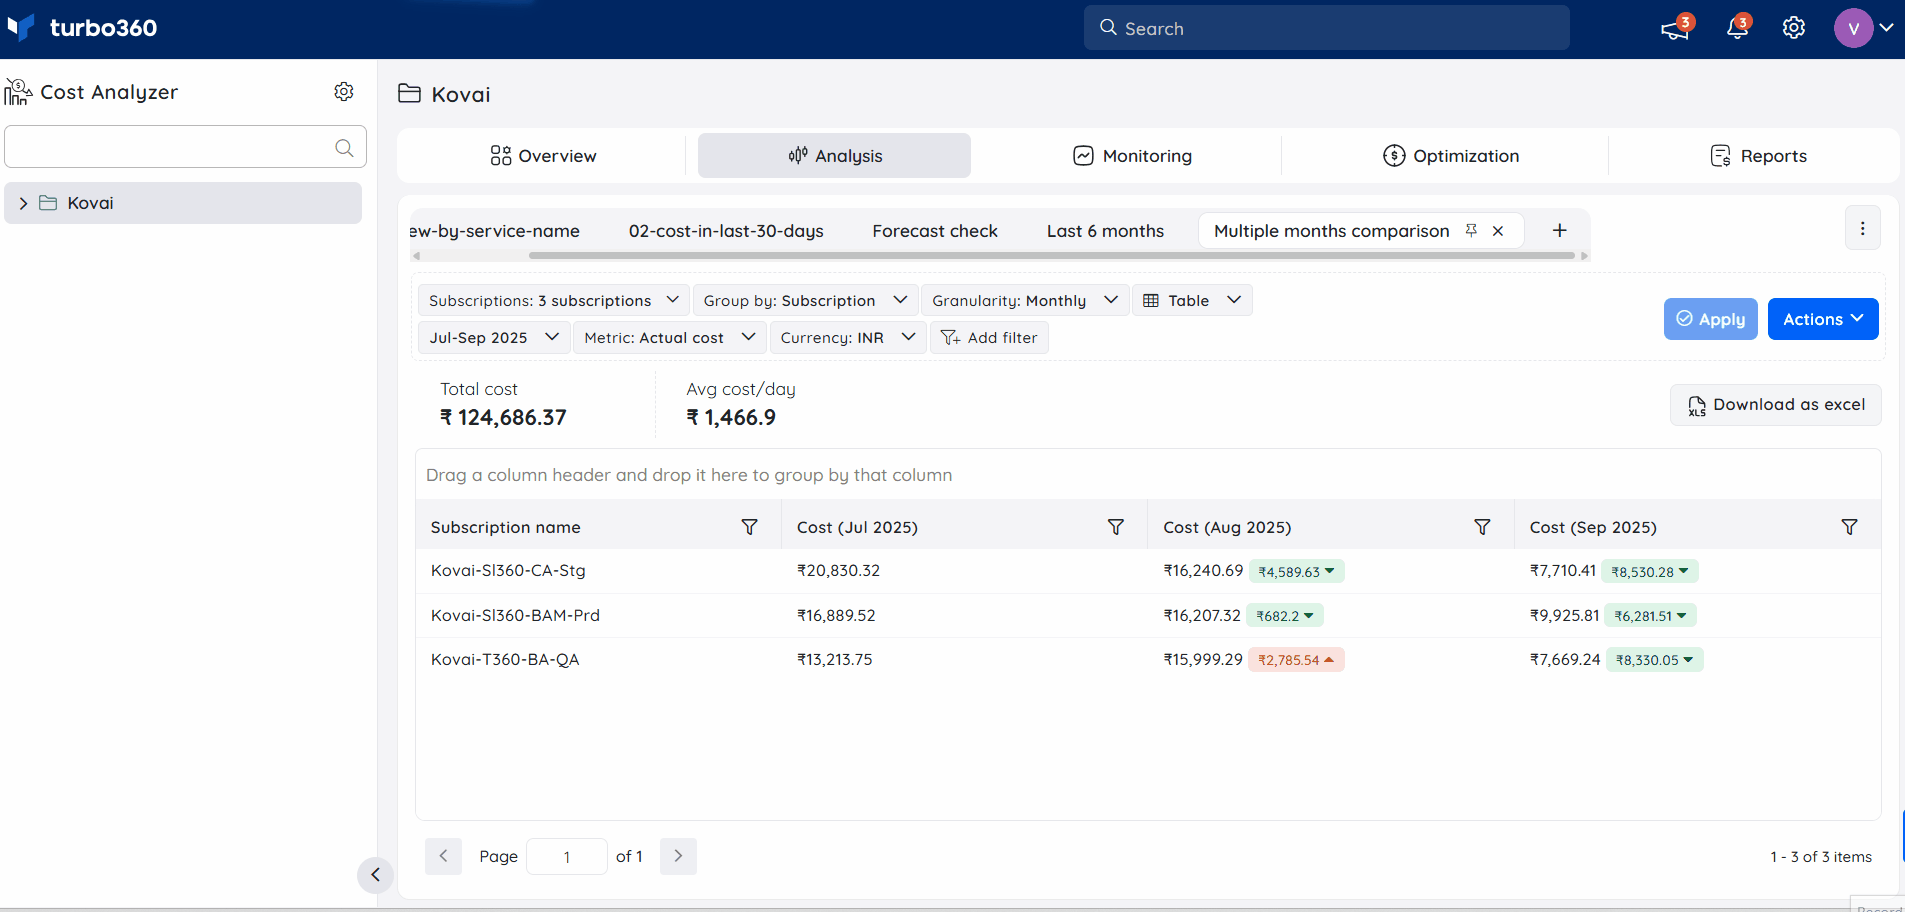
Apply schema to a cost view
Applying a chart schema to a Cost group will store it as an Analysis view in the Saved views feature.
- Go to Settings -> Chart library.
- Click the three-dotted icon next to the desired schema
- Select Apply
- Choose the required cost groups to apply the schema and store it as an analysis view.
Choosing the Update existing chart option with the selected cost group will apply any available updates to the chart that is already associated with that cost group.
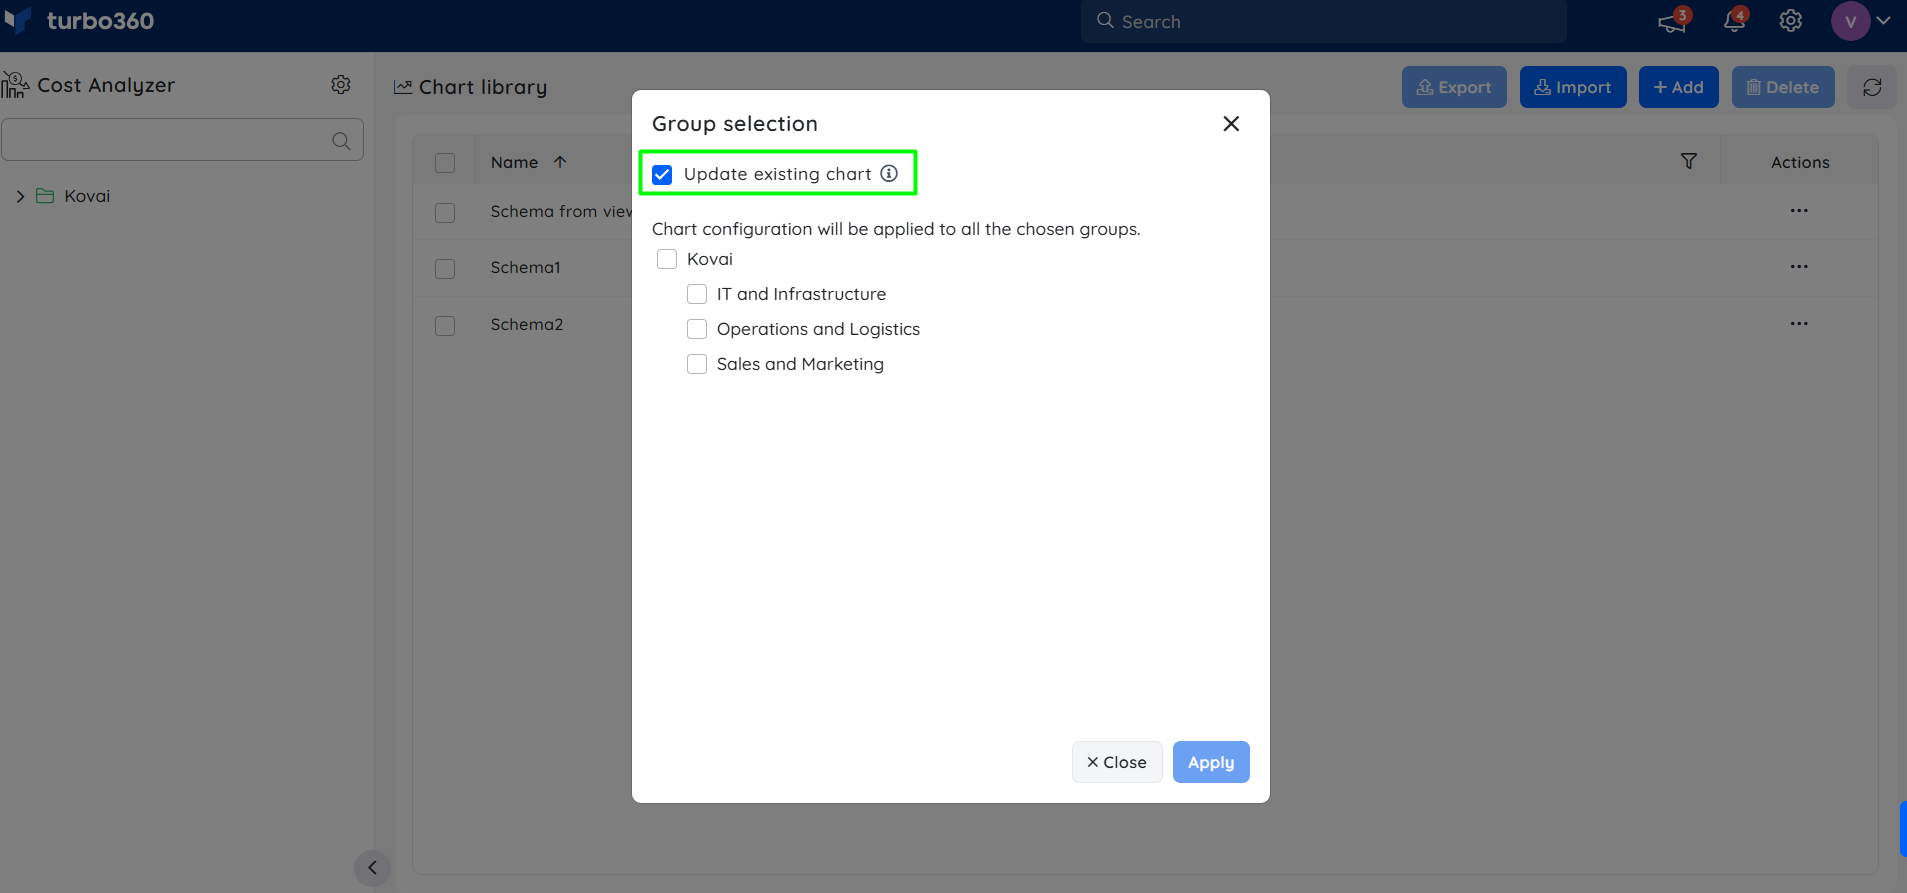
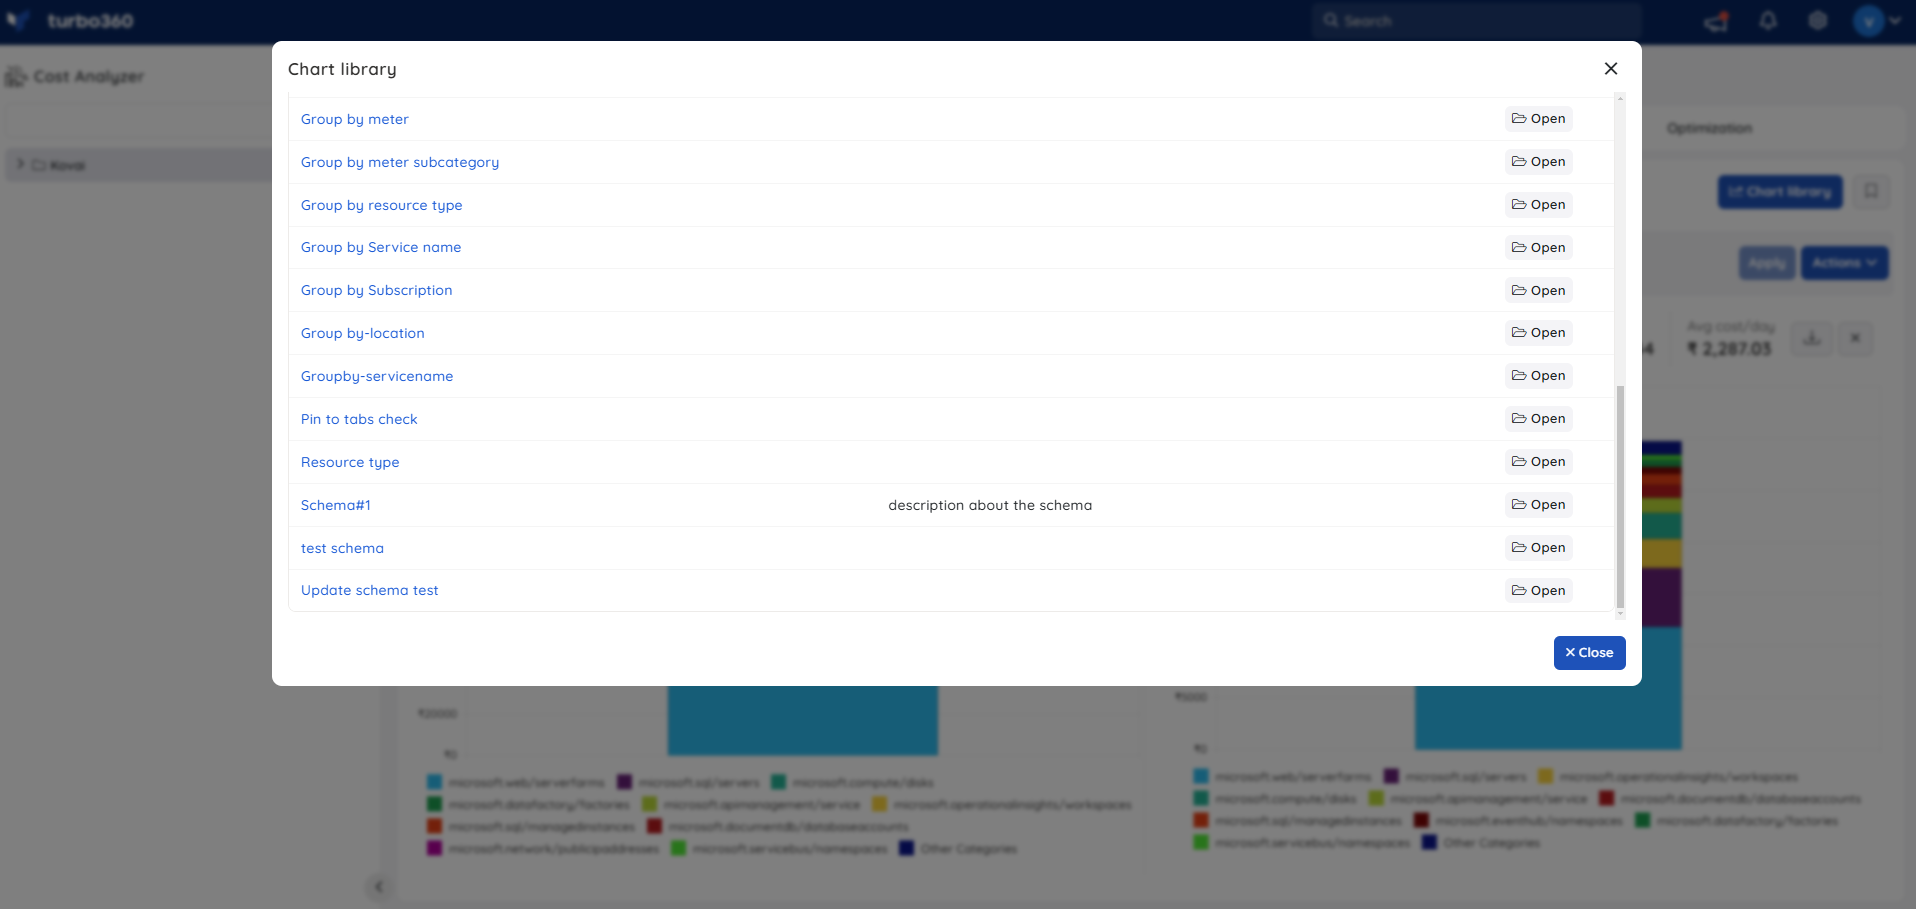
Chart library in Analysis view
- The Chart library option in Cost Analysis can be used to easily access any chart schema and apply it to all available subscriptions.
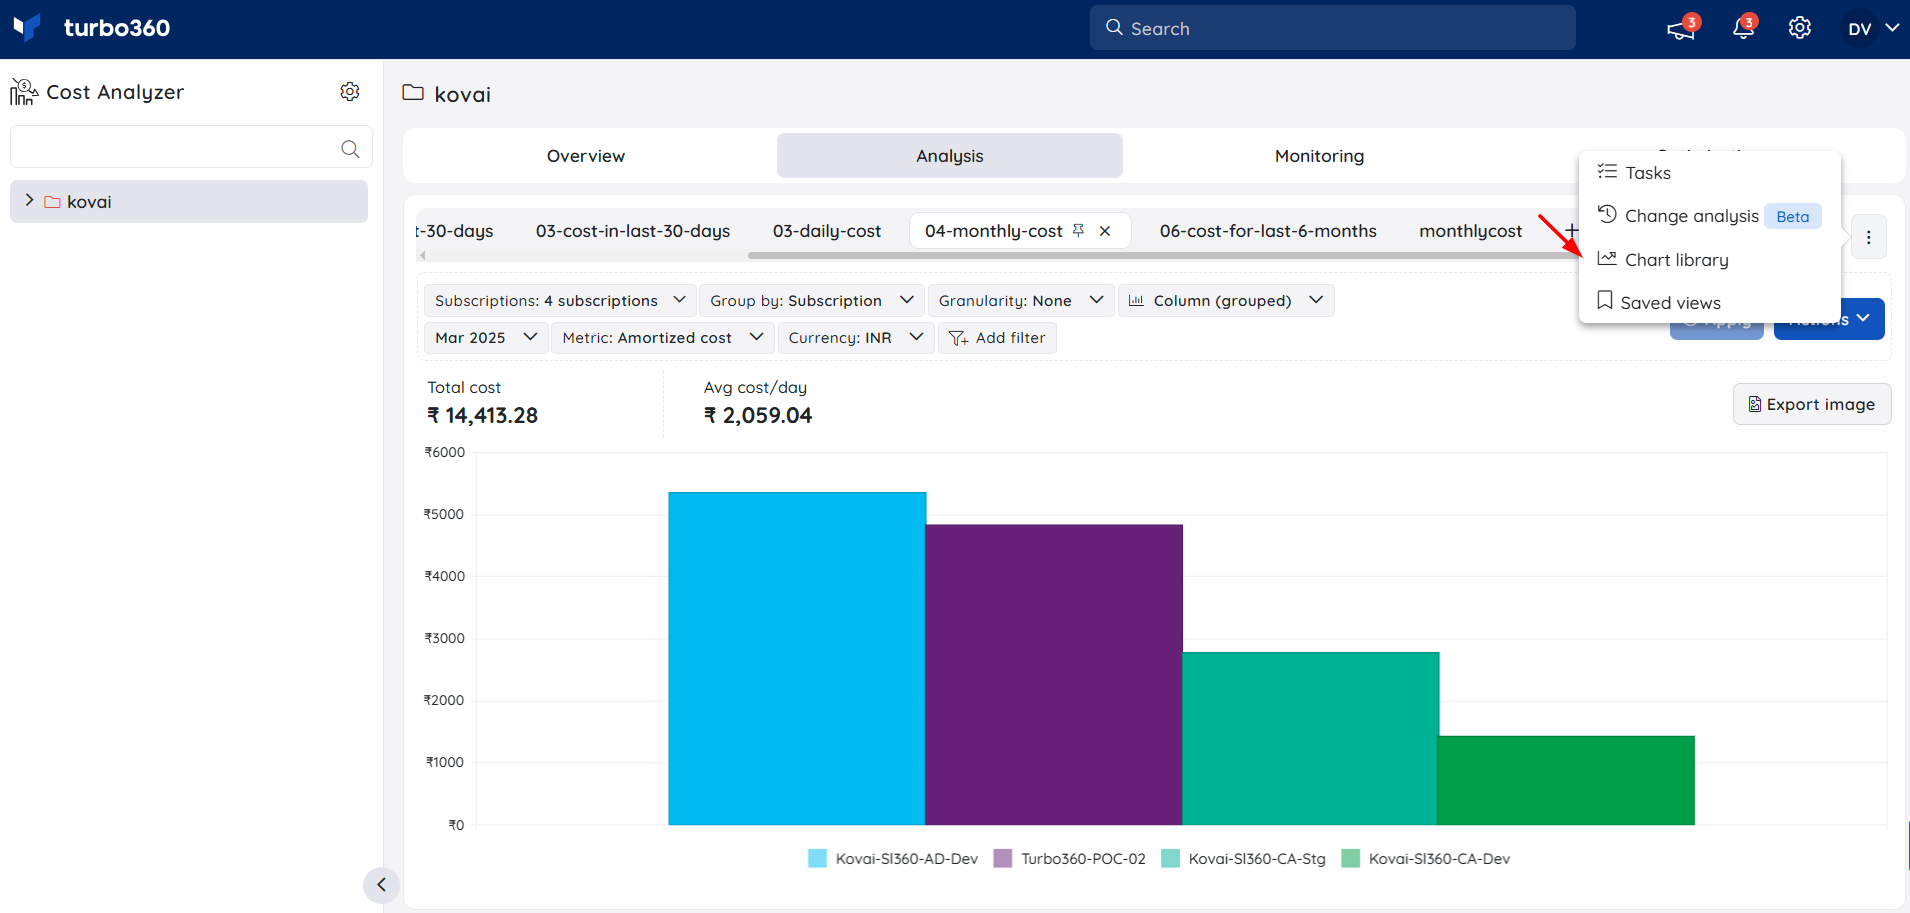
- Clicking on the schema name will display a preview of the schema.
- Filters from an Analysis view can be captured as a chart schema and added to the chart library using the Actions -> Add to chart library option.
Edit chart schema
- Go to Settings -> Chart library.
- Click the three-dotted icon next to the schema to be updated with changes.
- Select Edit option.
- Perform necessary changes to the schema and click Update.
Modifications to an existing schema will have no effect on the chart schema applied to a cost group or those pinned in Analysis view of a cost group.
Clone chart schema
- Go to Settings -> Chart library.
- Click Action next to the saved schema and click Clone option to clone the existing schema.
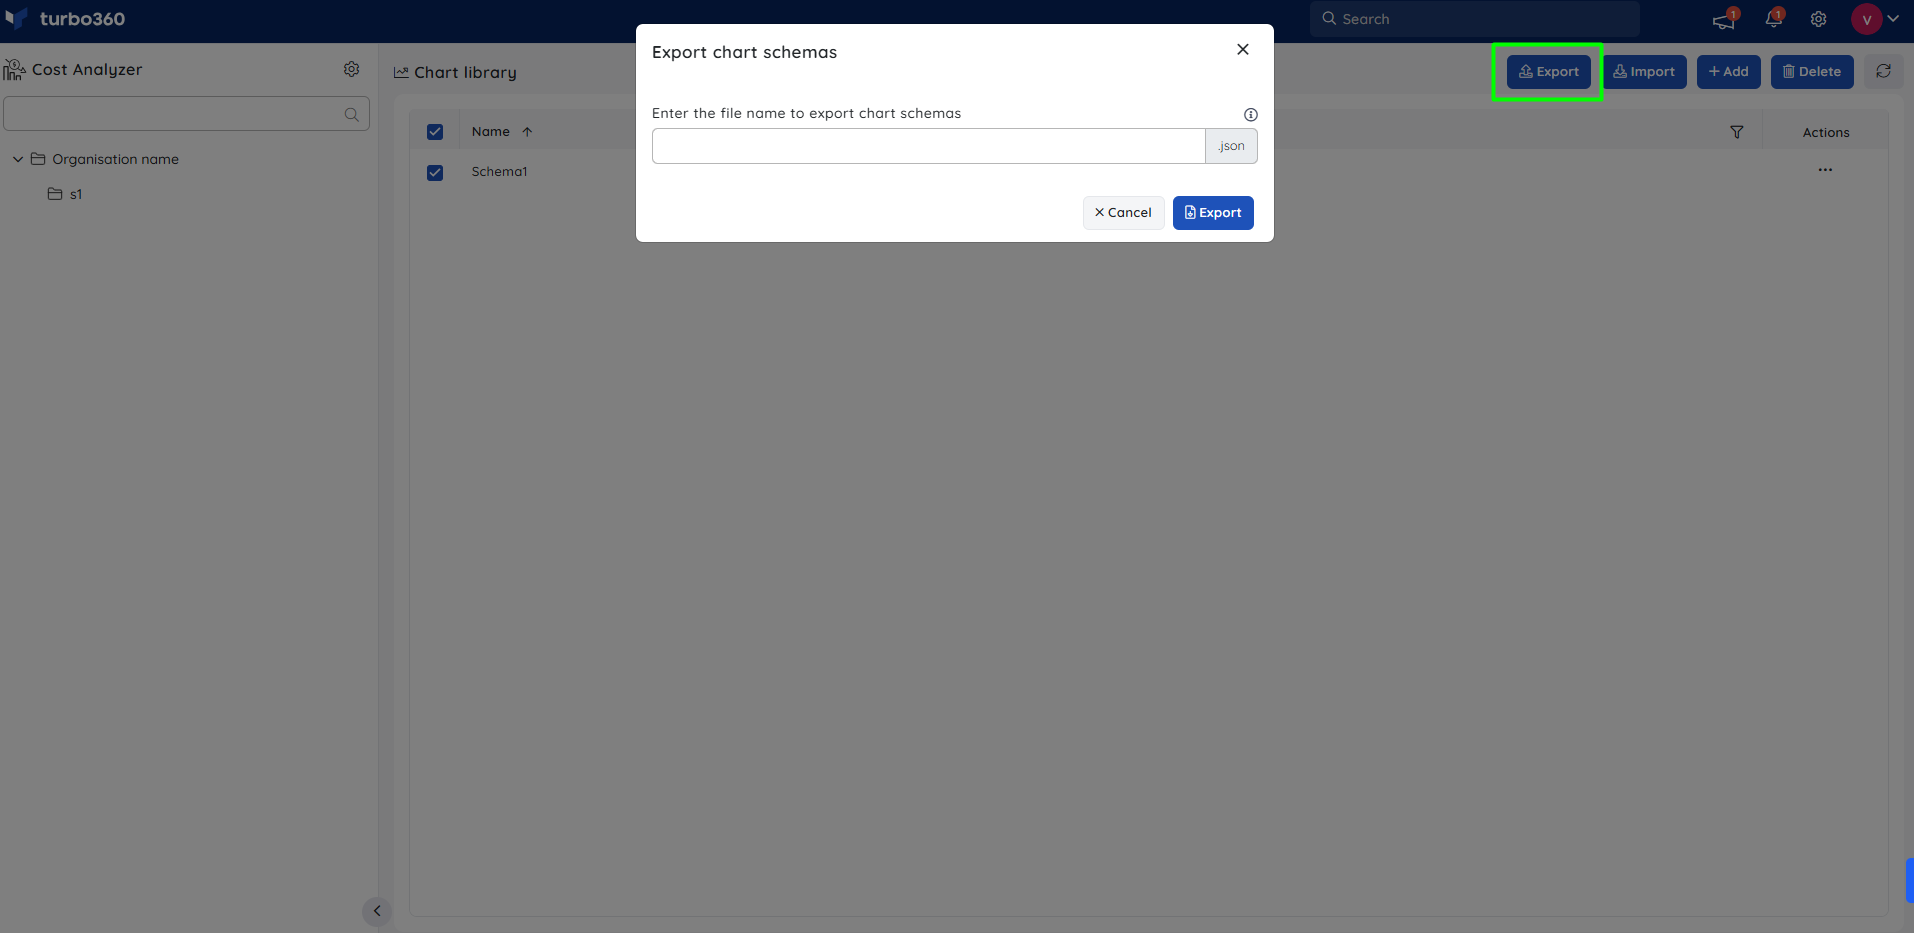
Export chart schema
To export a chart schema:
- Navigate to the Chart library section within Cost Analyzer.
- Select the chart schema intended for export.
- Click Export from the available actions.
- Specify a name for the resulting JSON file and confirm by selecting Export.
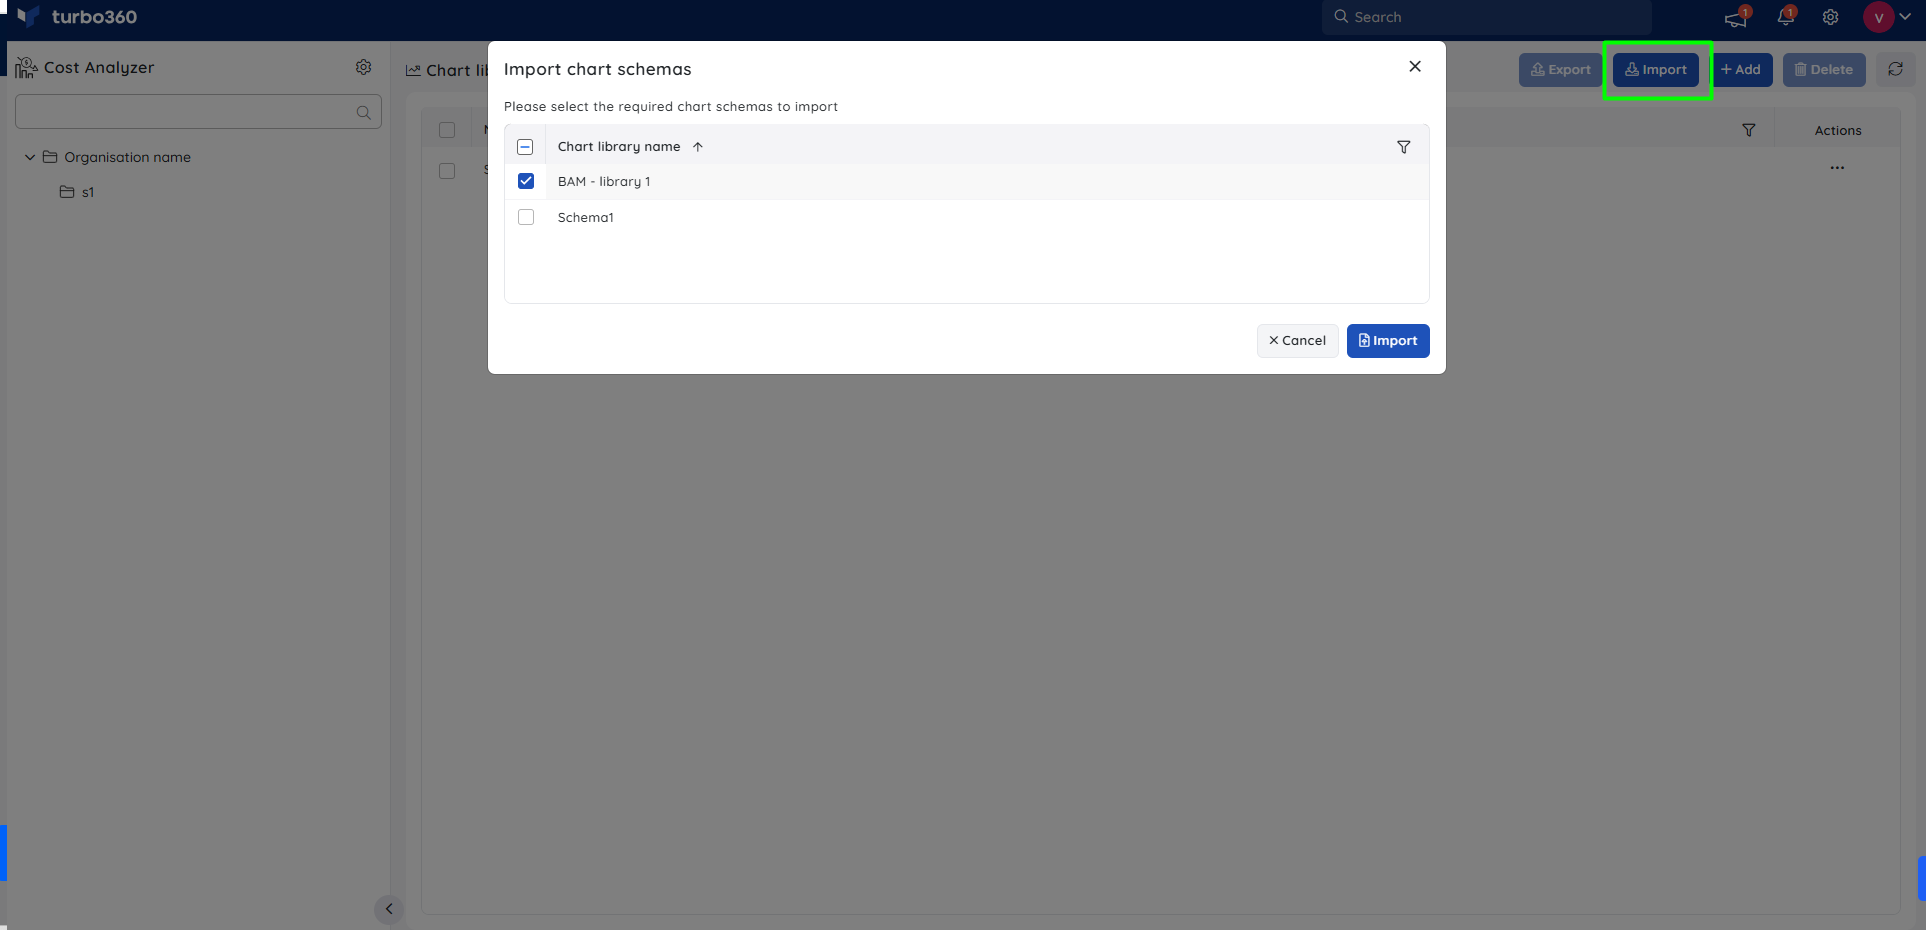
Import chart schema
To import a chart schema:
- Navigate to the Chart library section within Cost Analyzer.
- Click Import from the available actions.
- Browse and select the required JSON file from the local device.
- Confirm by clicking Import to import the selected schema.
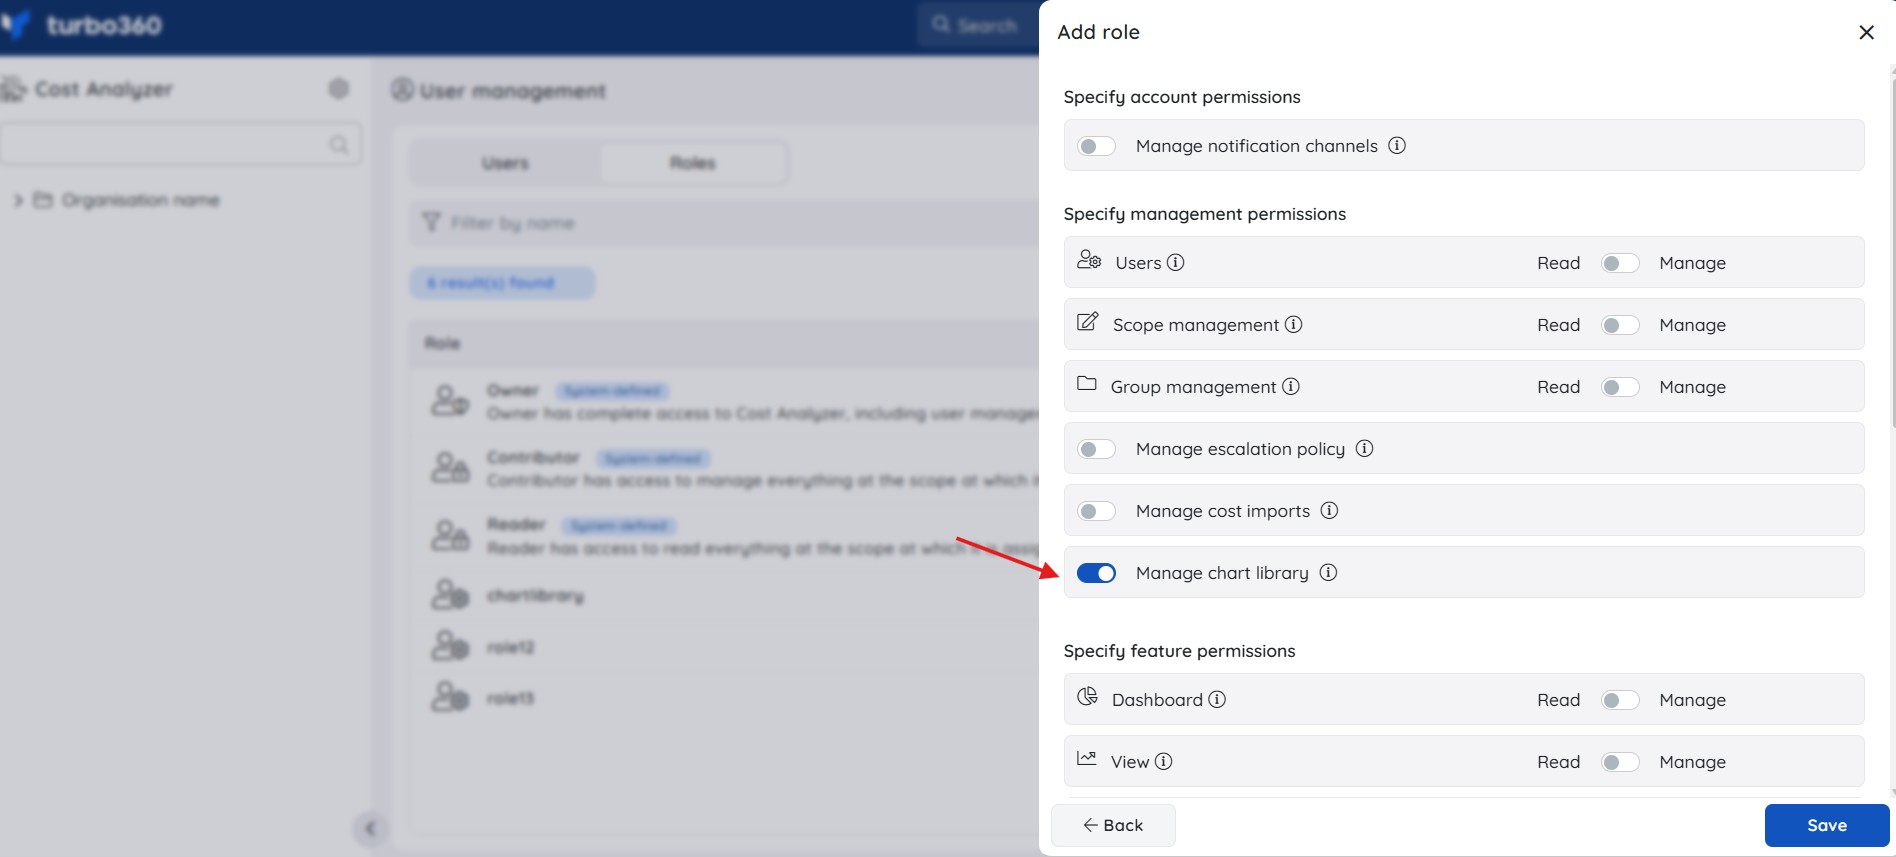
User access policy
User-defined roles can be configured to manage the Chart Library by enabling the Manage Chart Library permission during role creation.
This approach allows administrators to grant Chart Library management access without assigning broader, high-level permissions.
These roles can be assigned to users even when their base permissions are limited to a specific group or subgroup.
Users assigned with this role can:
- Create, modify, and delete chart schemas
- Import and export chart schemas
Was this article helpful?