- 19 Nov 2024
- 2 Minutes to read
- Print
- DarkLight
- PDF
Managing Business Application Dashboard
- Updated on 19 Nov 2024
- 2 Minutes to read
- Print
- DarkLight
- PDF
Introduction
The Business Application Dashboard in Turbo360 has many exciting features that saves the user time and effort.
Users can create and edit the Business Application Dashboards by using Create and Edit options available in the Dashboard section.
There are several other features that can be used to get the most out of the BA Dashboard.
Configuring time settings
The interval on which the data should be visualized is configured while creating the widget and it can be changed while editing the widget configuration.
The time settings can be configured with two significant options:
- Time Range
- Time Granularity
Time Range : represents the time period over which the user would like to view the generated data for the relevant metrics.
Time Granularity : represents the time period during which the user can access the data produced for the metrics at the given time.
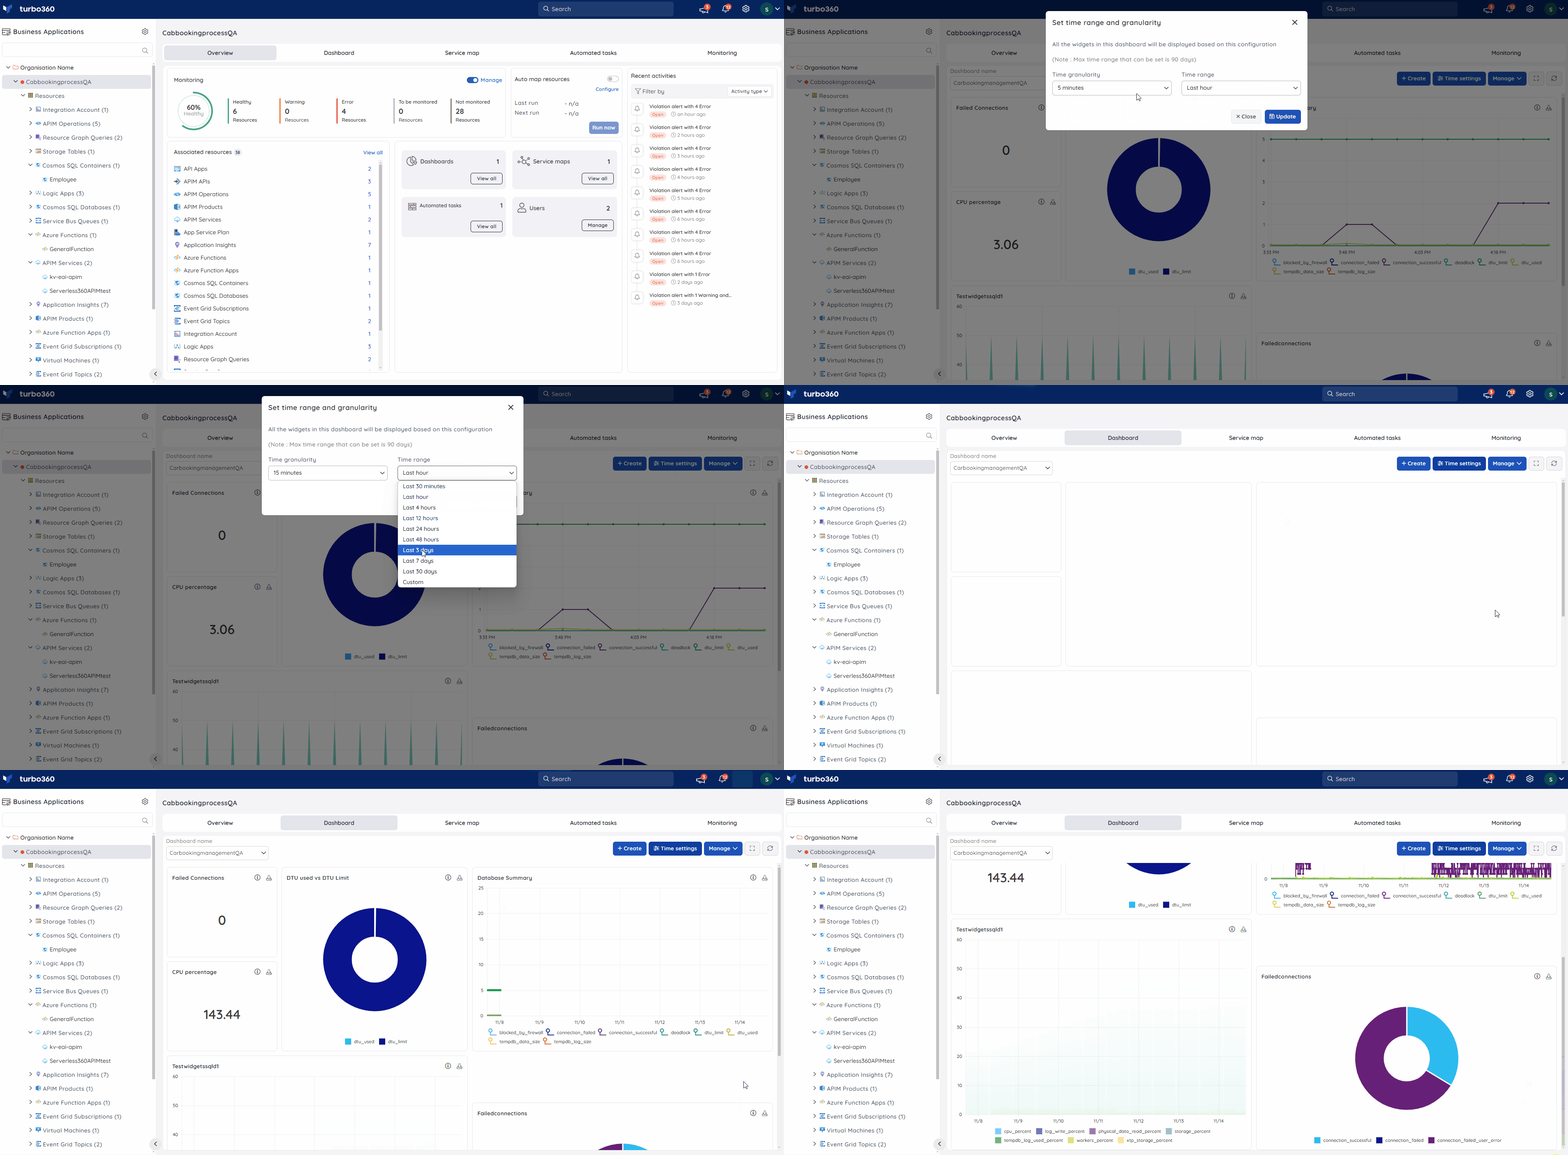
This interval can be changed to visualize the data without modifying the actual configuration.
The default time interval is Time granularity - 5 min; Time range - 1 hour. Users can also customize the time interval based on their needs.
The maximum data interval that can be set is 90 days.
User-configured time settings are unique to each account. Therefore, the default values will be displayed for other users while the customized value will be displayed for the respective user.
Below is the illustration to set the time range and granularity for the Business Application Dashboard.
Editing widgets
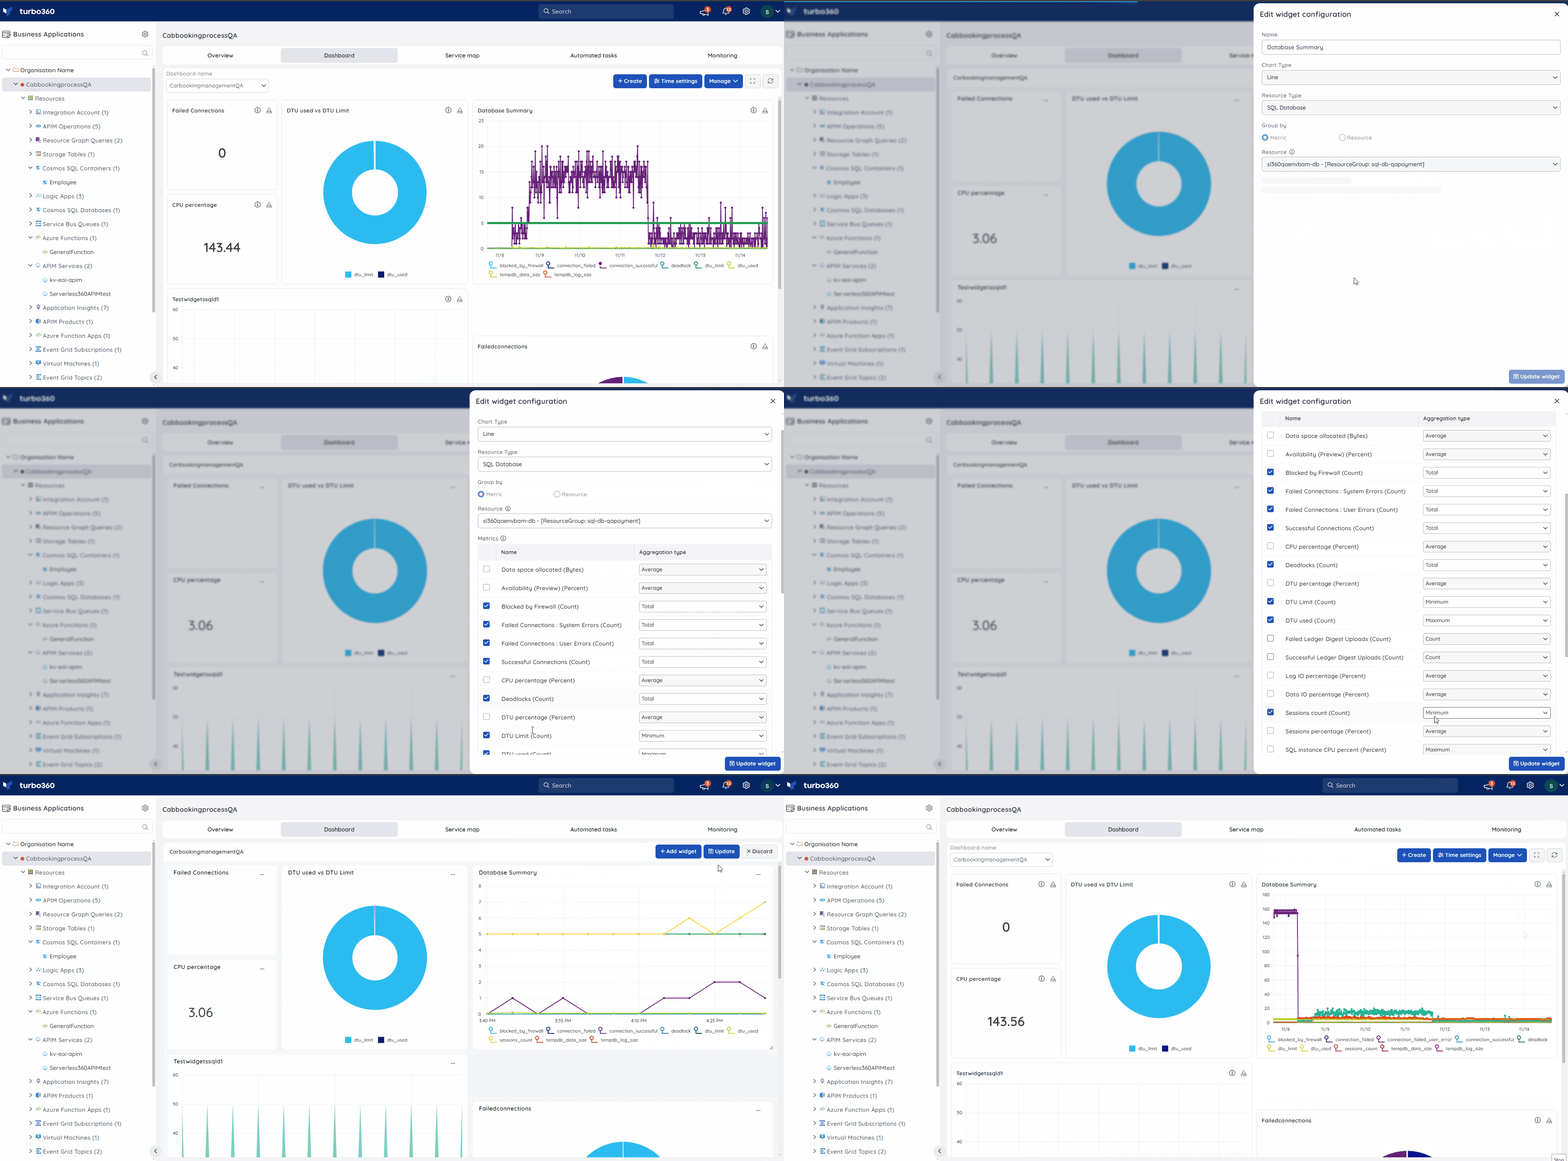
The Edit option can be used to edit and update any of the configured widgets.
The chart type cannot be modified for the generated widgets.
Below is the illustration to edit a widget in the Dashboard.
Ordering widgets
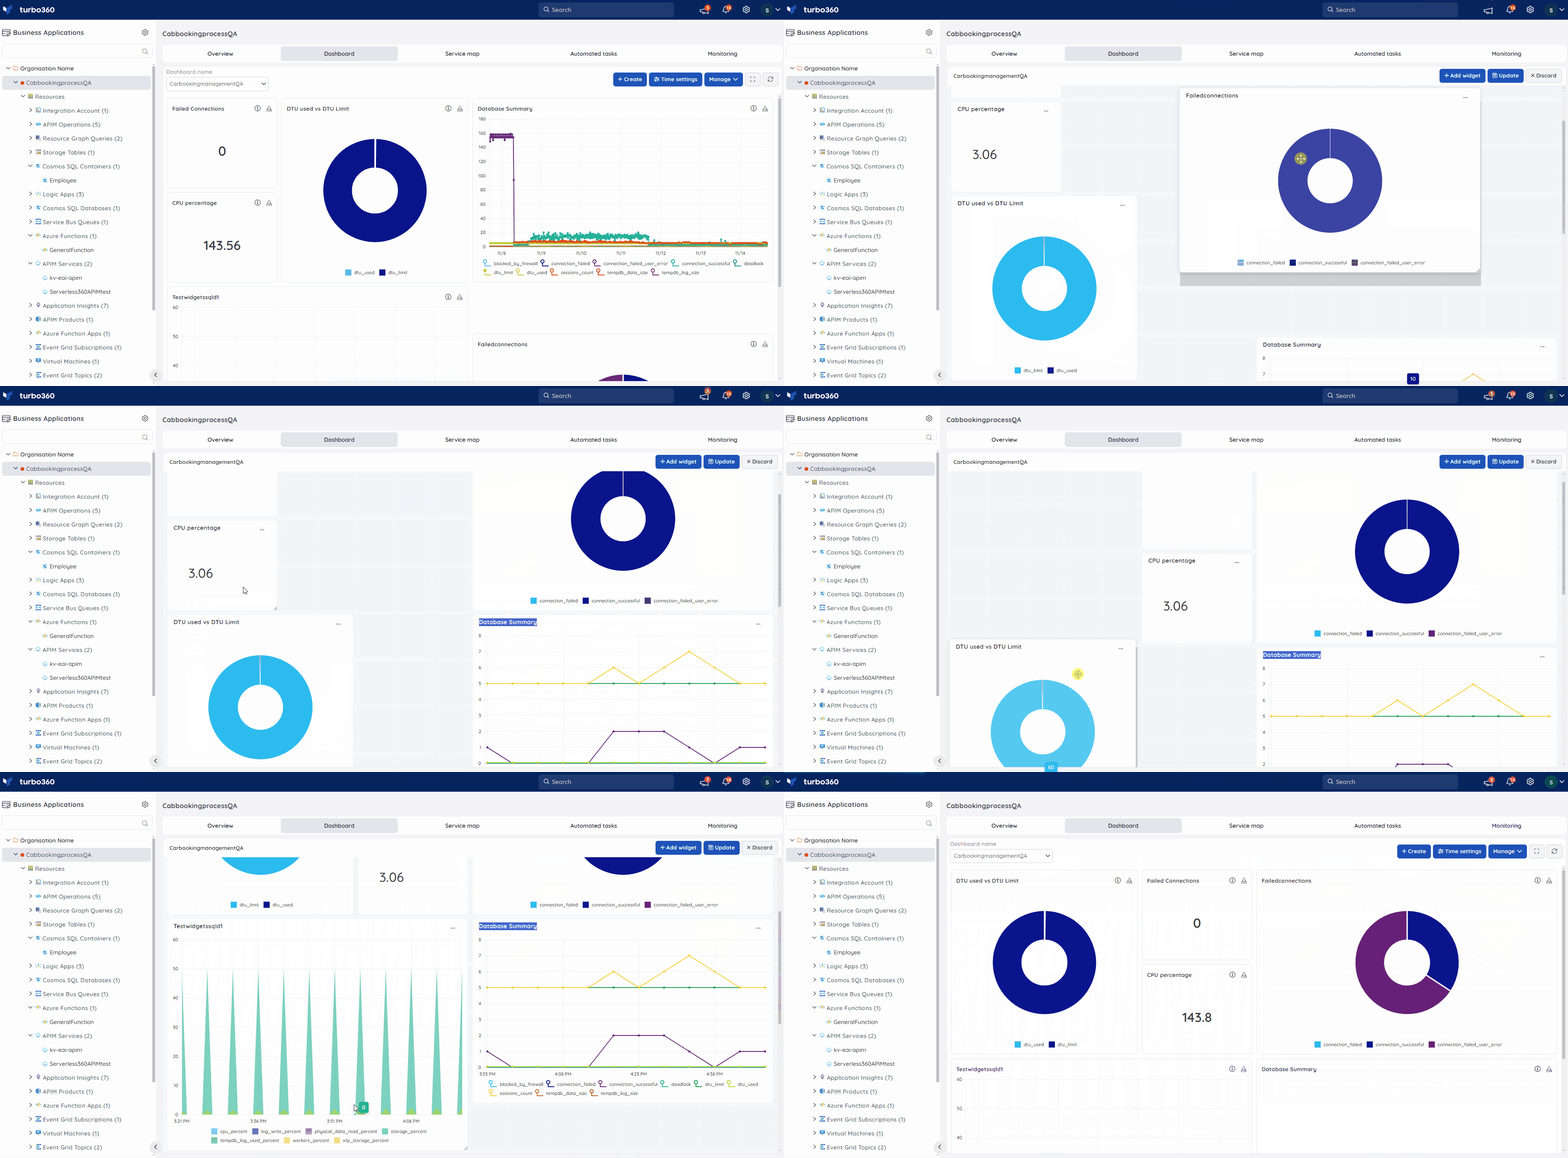
Arranging the widgets is made simple in the Dashboard using Turbo360.
The user may simply drag the widget to the desired location and resize it to fit in their layout.
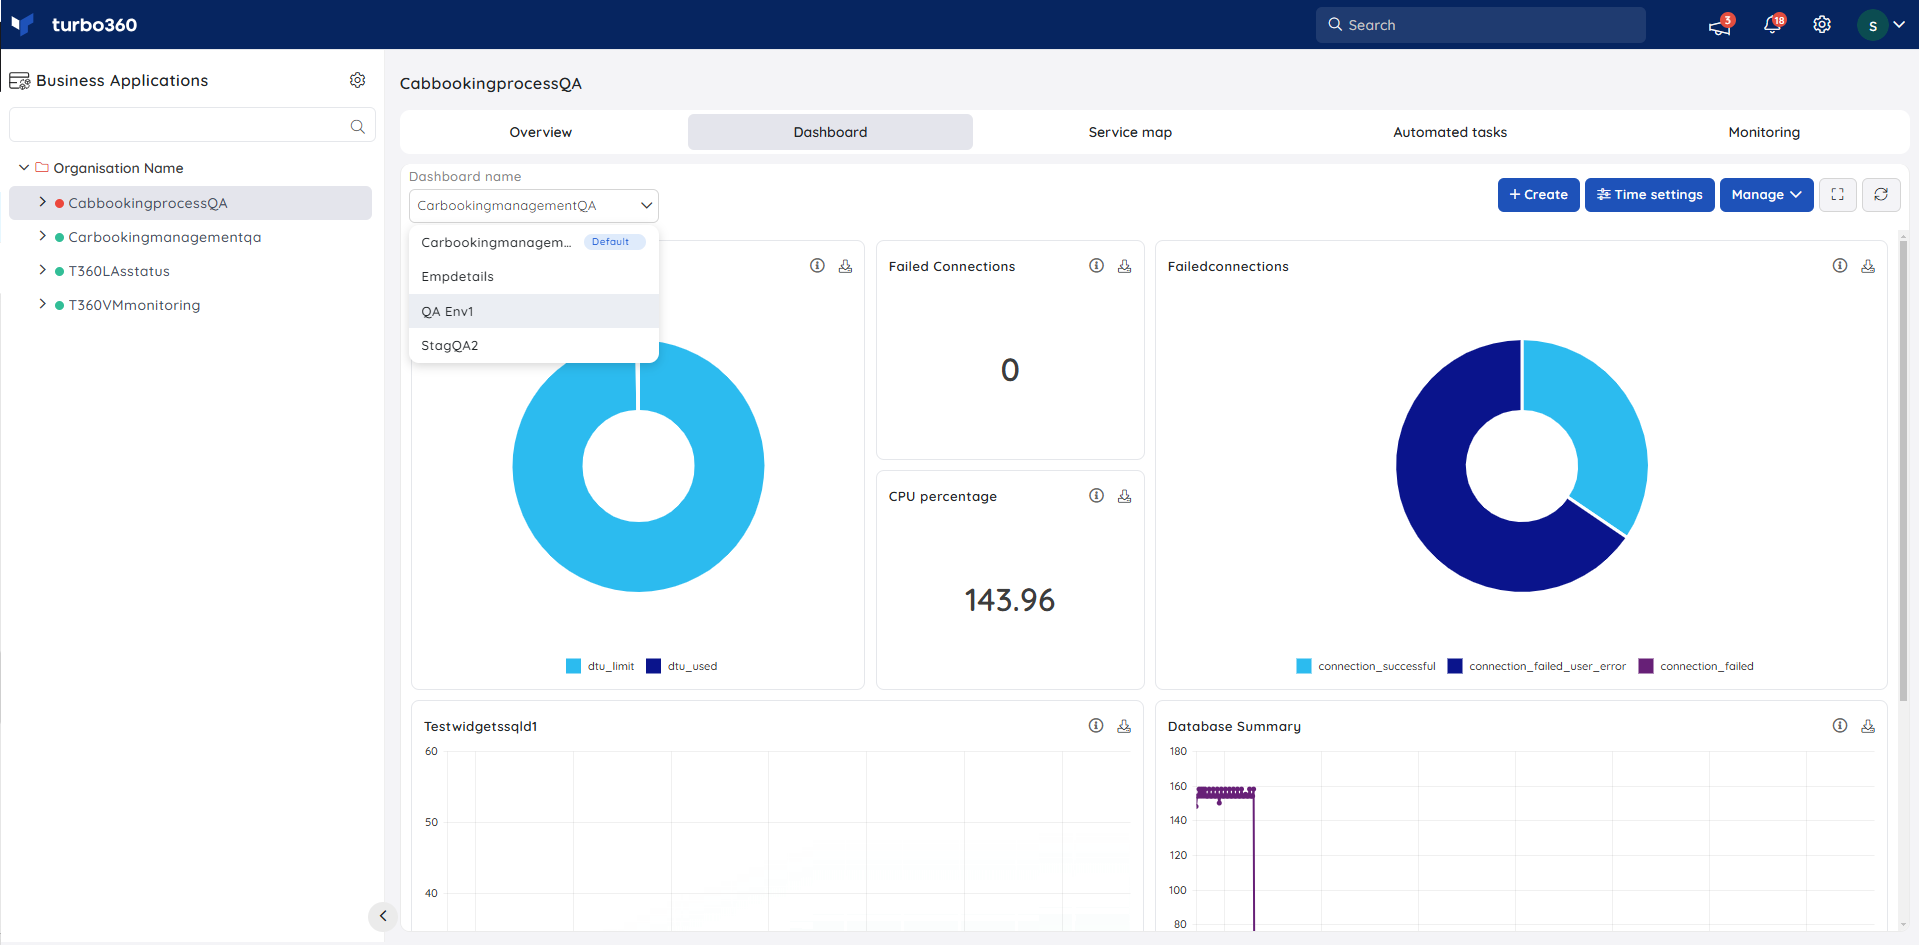
Switching between Dashboards at ease
- Users can switch between multiple Dashboards by selecting the required Dashboard from the drop down available in the Dashboard section.
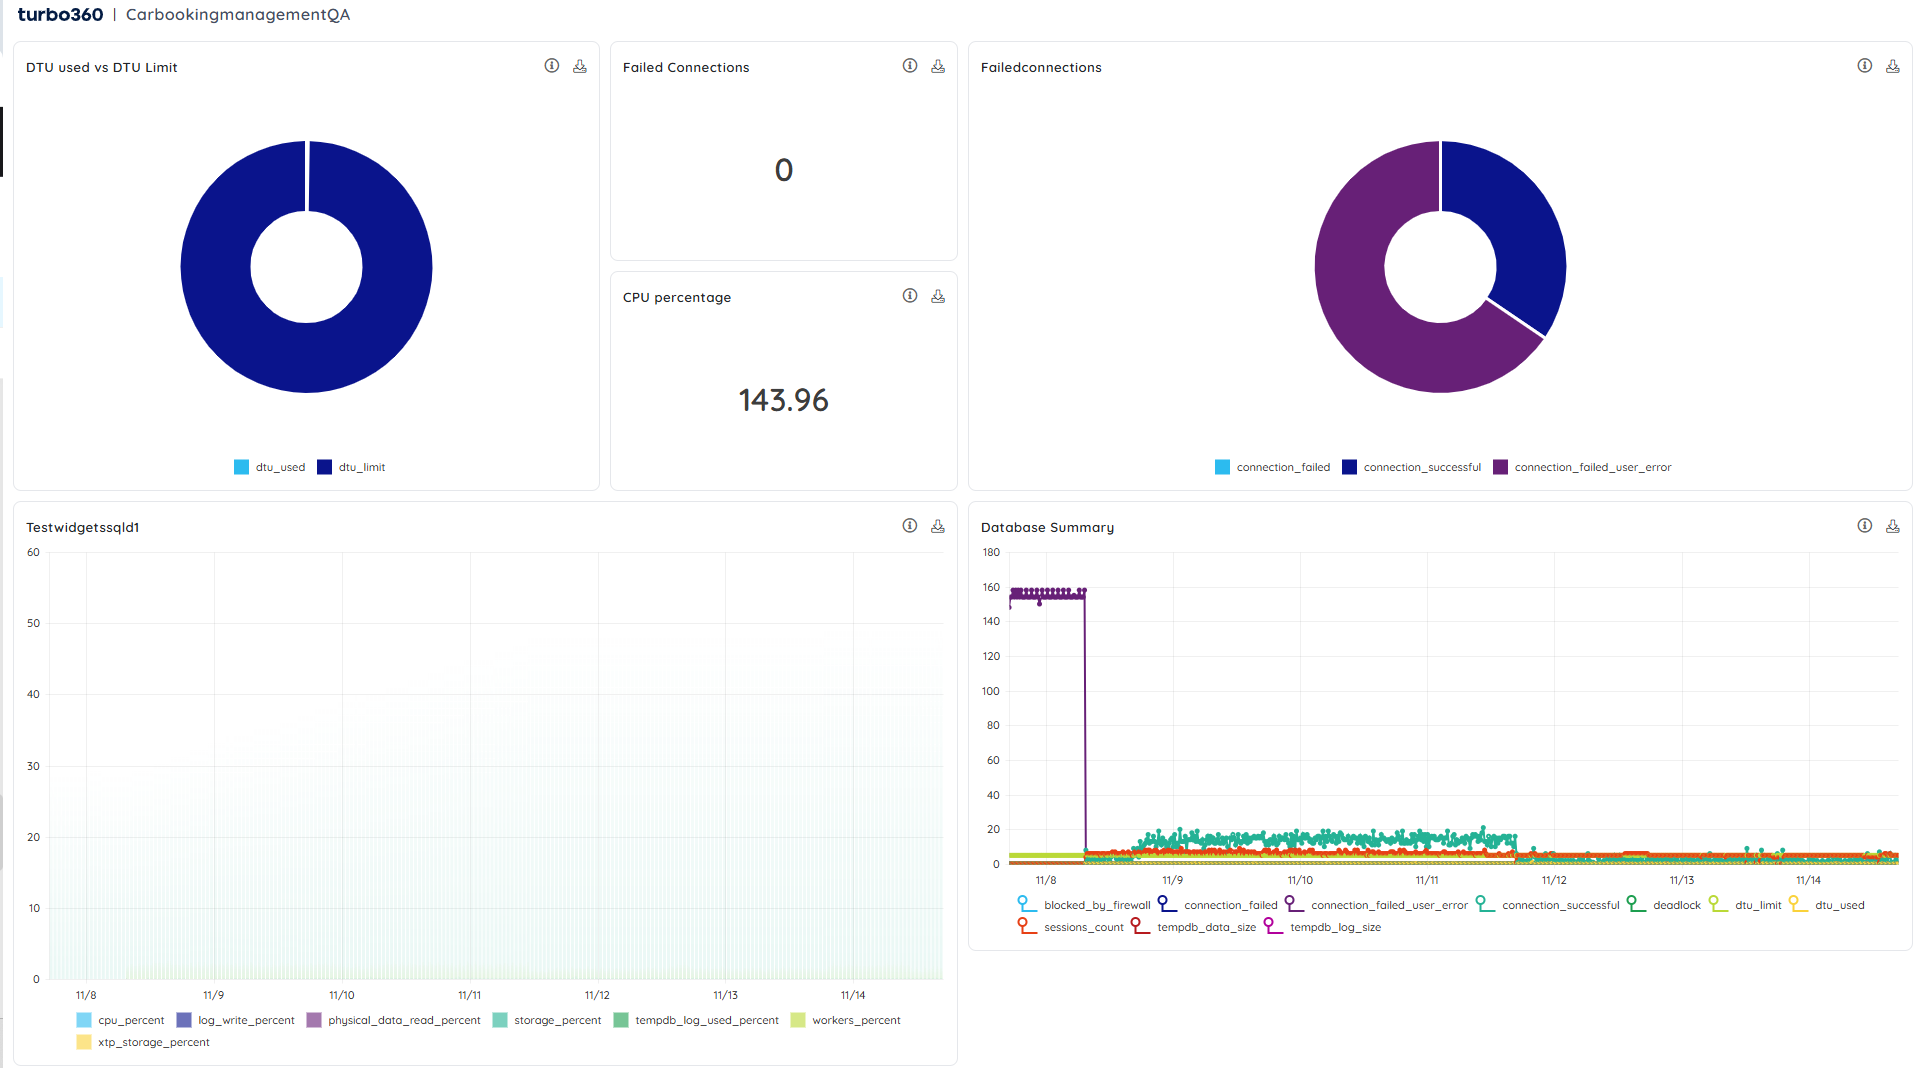
Full screen mode
- The Dashboard can also be displayed in full screen mode so that users can stay up to date and focused on the metric status of their Azure resources.
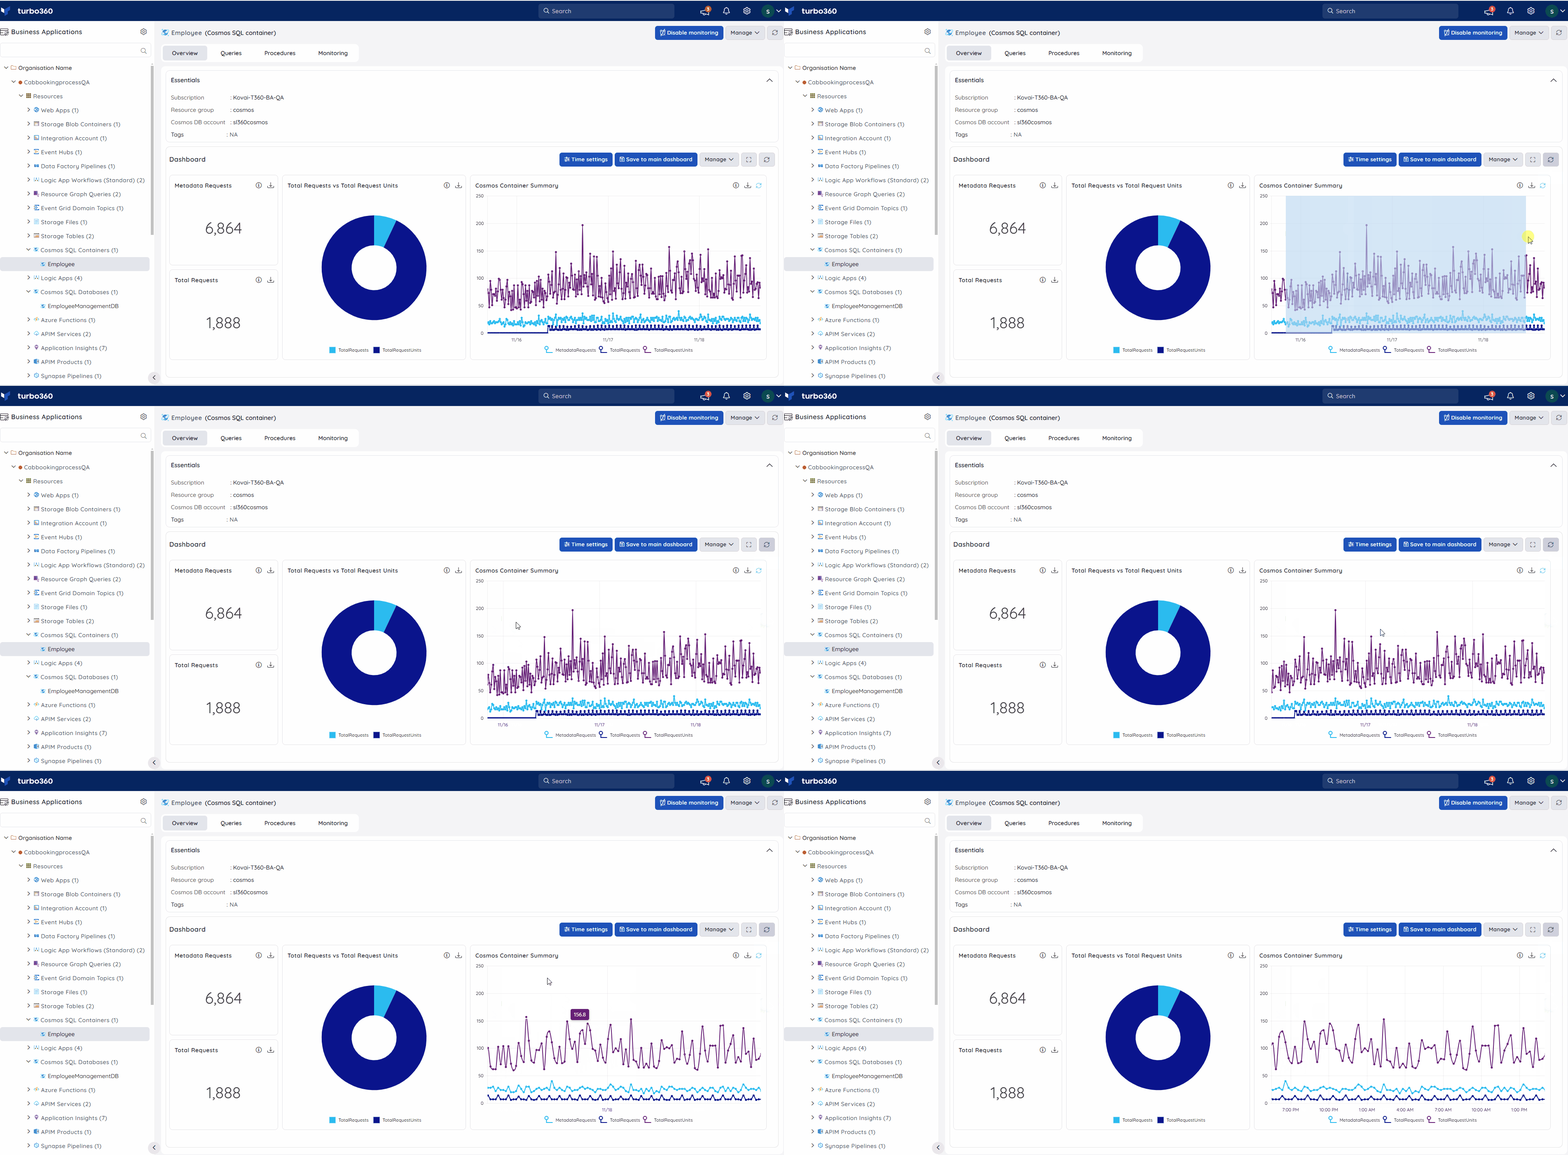
Zoom in - Zoom out
- Zoom and drag features are provided on the Turbo360 Dashboard to have a better understanding of the data points.
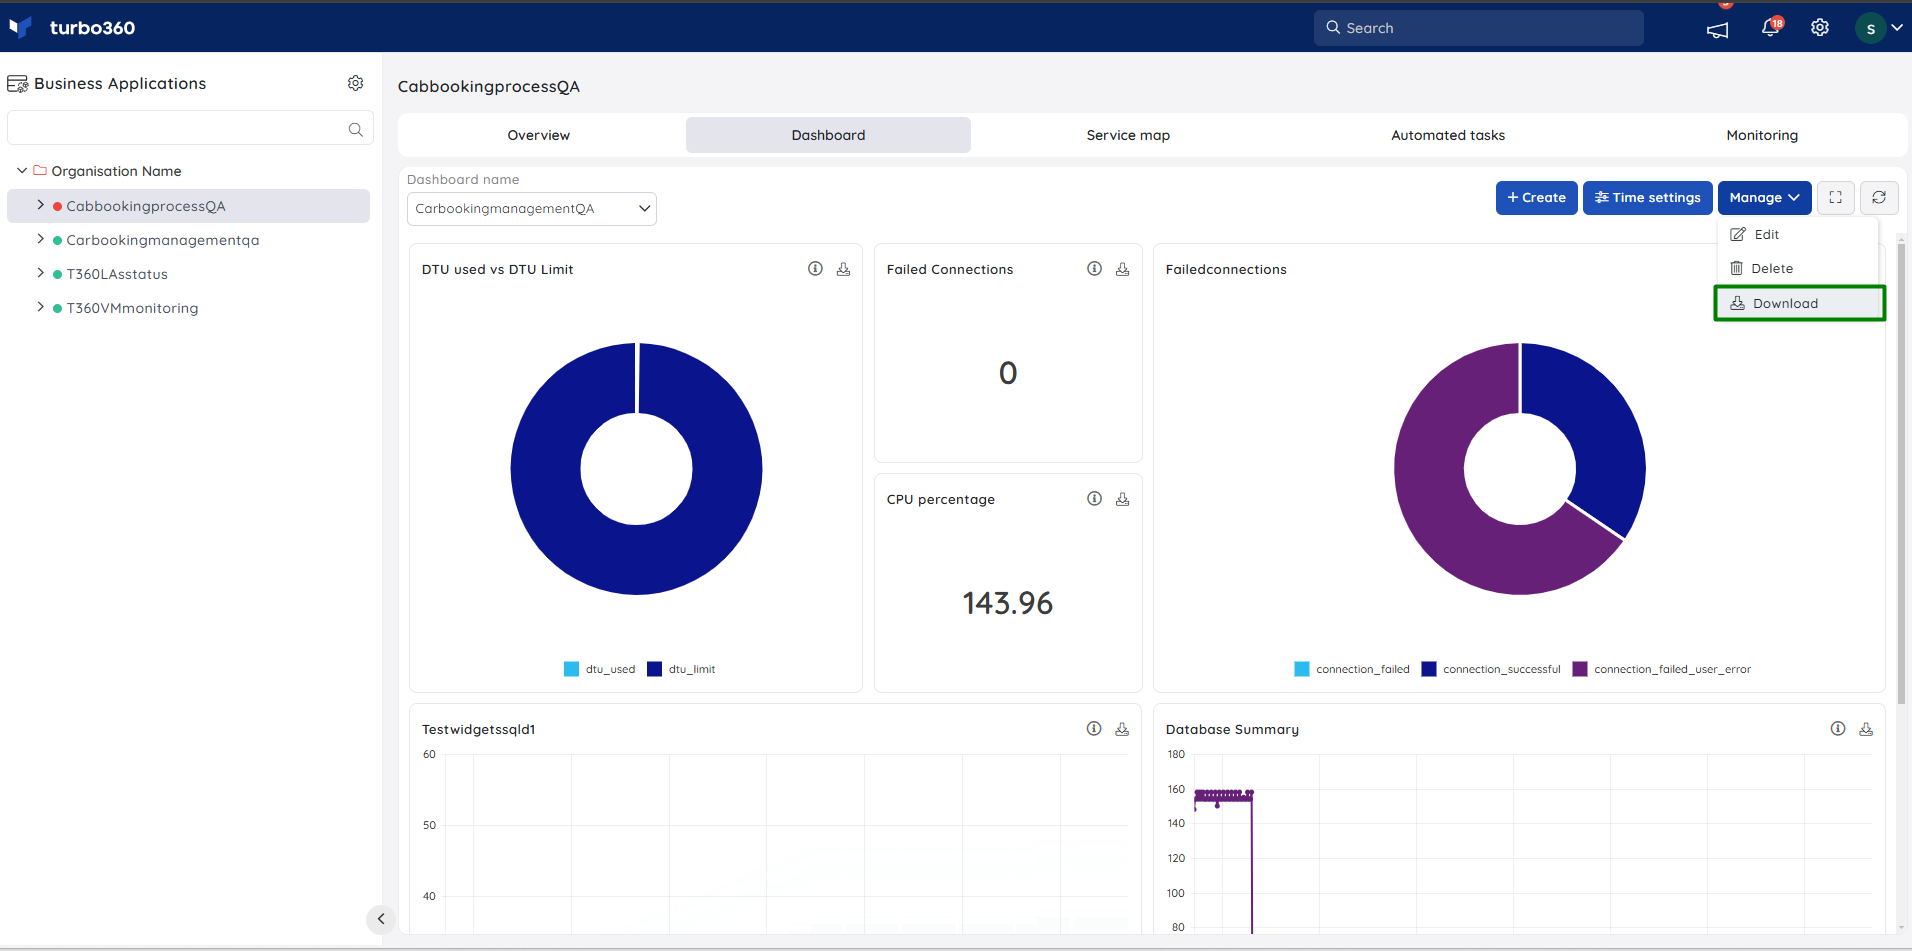
Download dashboard
Business Application dashboards can be downloaded as an Excel workbook with separate sheets for each widget data. Click the Download option available in a Business Application dashboard to download the widget data.
