Managing Dashboards
- 19 Nov 2024
- 3 Minutes to read
- Print
- DarkLight
- PDF
Managing Dashboards
- Updated on 19 Nov 2024
- 3 Minutes to read
- Print
- DarkLight
- PDF
Article summary
Did you find this summary helpful?
Thank you for your feedback!
Business scenario
Given below are two business scenarios for using the dashboard:
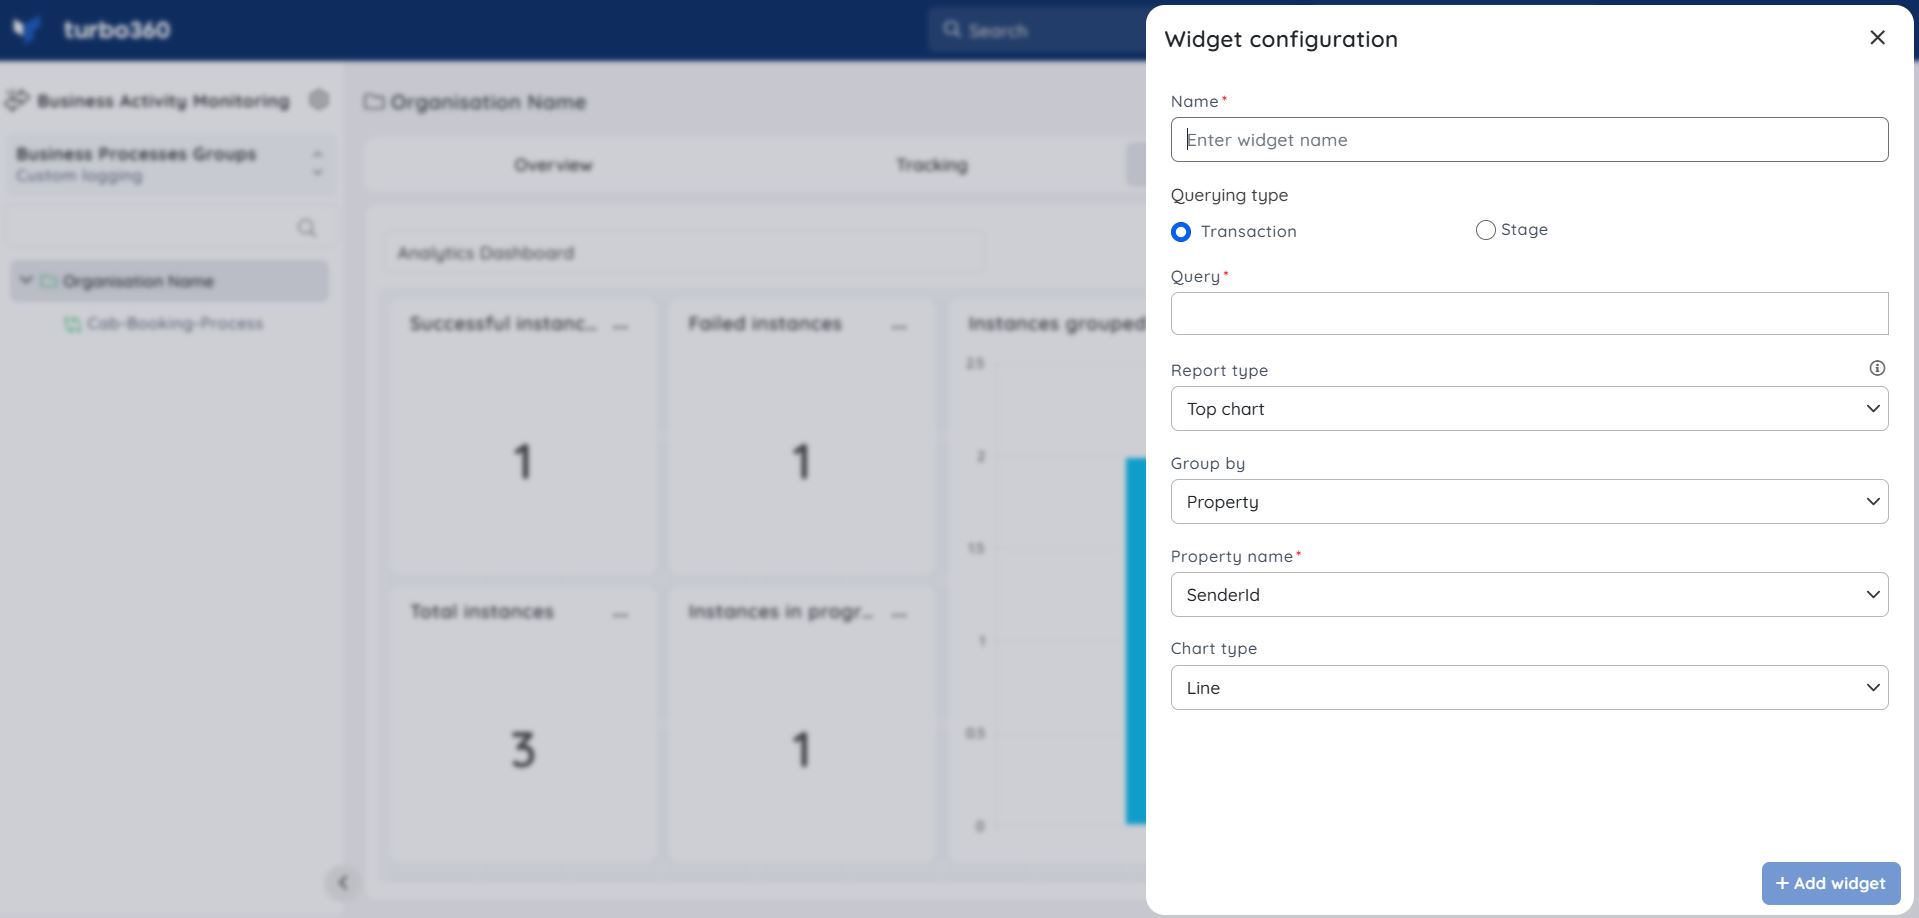
1. Top vendors of the Business Process
Consider a scenario where the user has a global property called SenderId. This property captures different vendor names in the business process.
Now, if a user wants to get the top vendors, then the user can configure the widget as shown below:
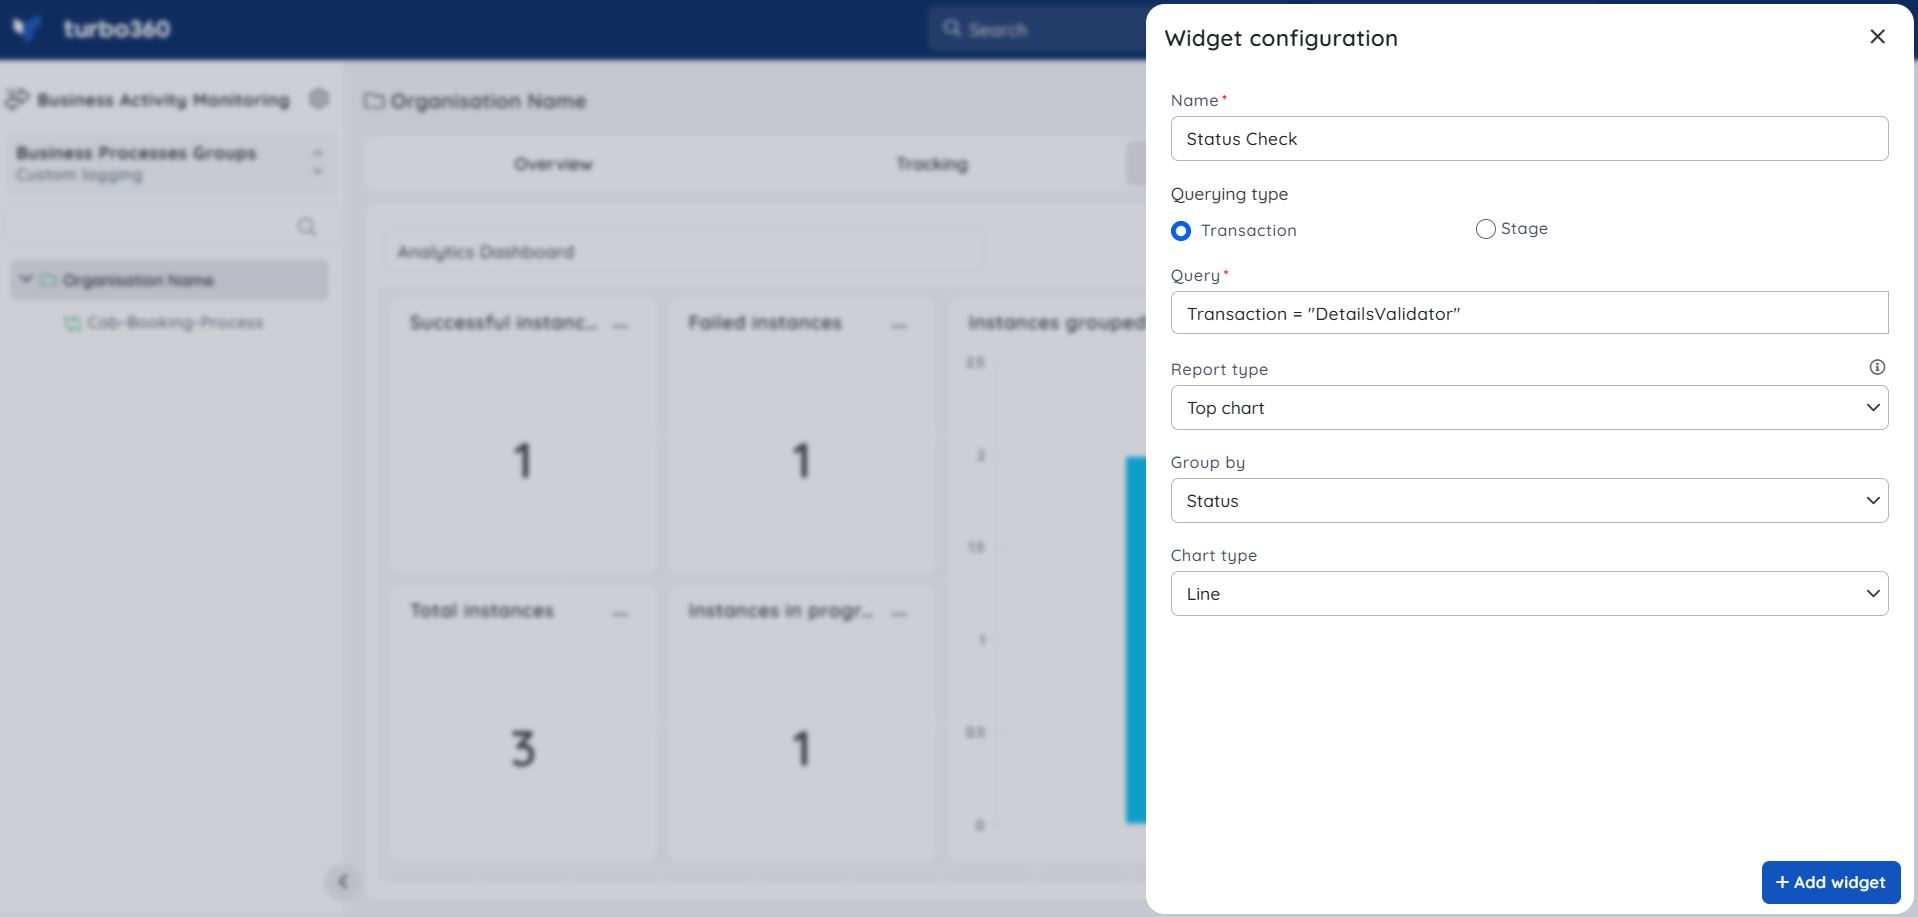
2. Success/Failure rates of Business Process
Users can measure the success and failure rates for the business processes using a query like below:
Create a Dashboard
- Go to Business Process -> Dashboard
- Click Add dashboard
- Enter a name to the dashboard
- Select the dashboard type from the available dropdown
- Add the desired widgets
- Click Save
Managing Dashboard widgets
The Business Activity Monitoring (BAM) Dashboard widgets are simple to arrange and provide a straightforward user experience. The user may simply drag the widget to the desired location and resize it to fit in their layout.
Add a widget
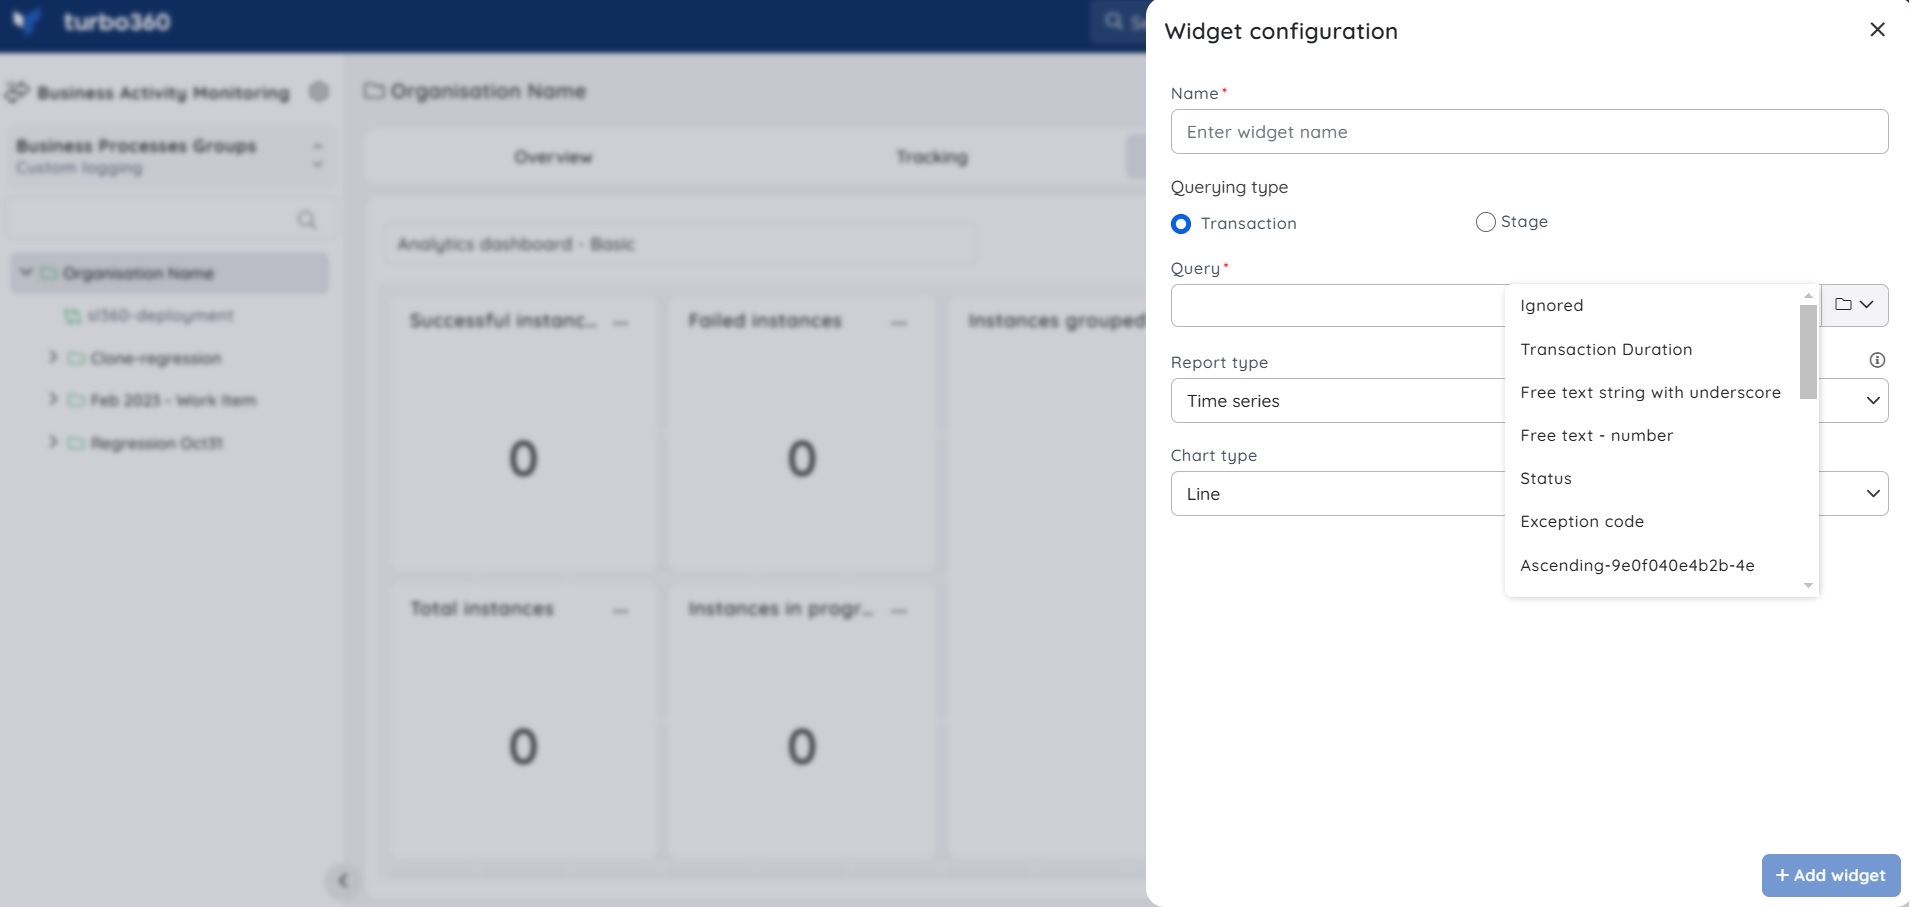
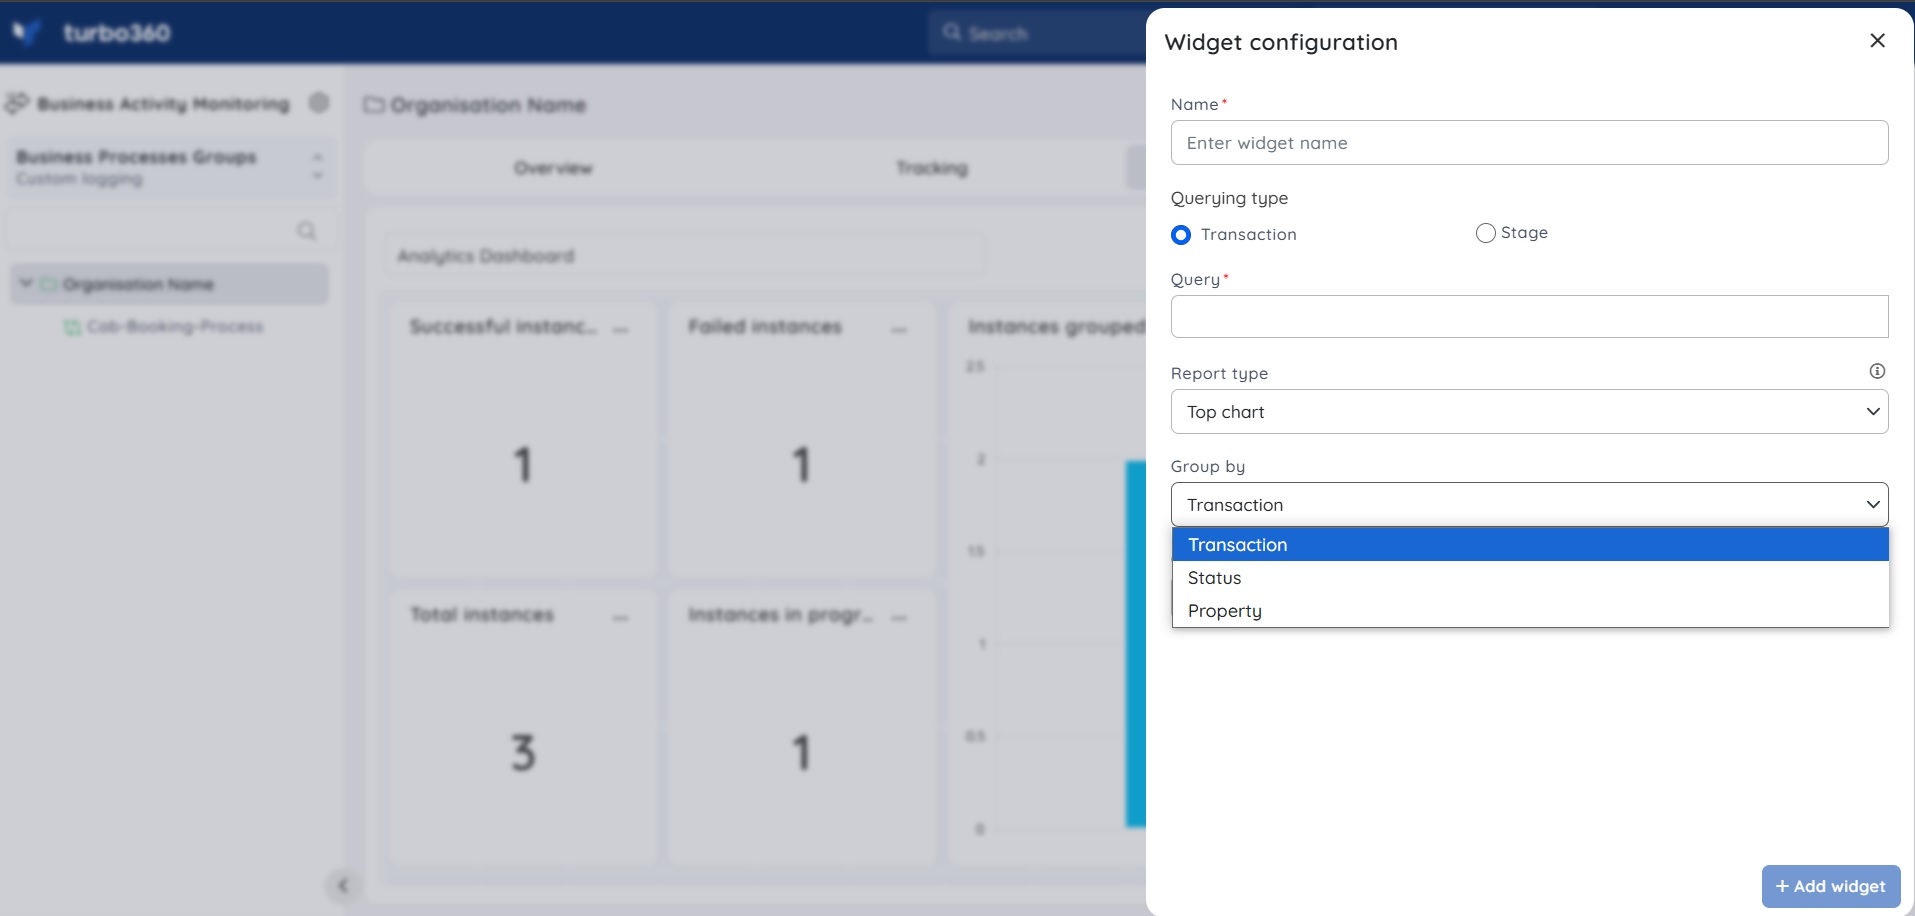
Custom Logging type
- Provide a name to the dashboard widget
- Choose the Query type to fetch data based on the query to be provided below
- Enter a Query to retrieve data for the dashboard widget
- Select the preferred report type
- Choose the Desired chart type
- Click Add widget
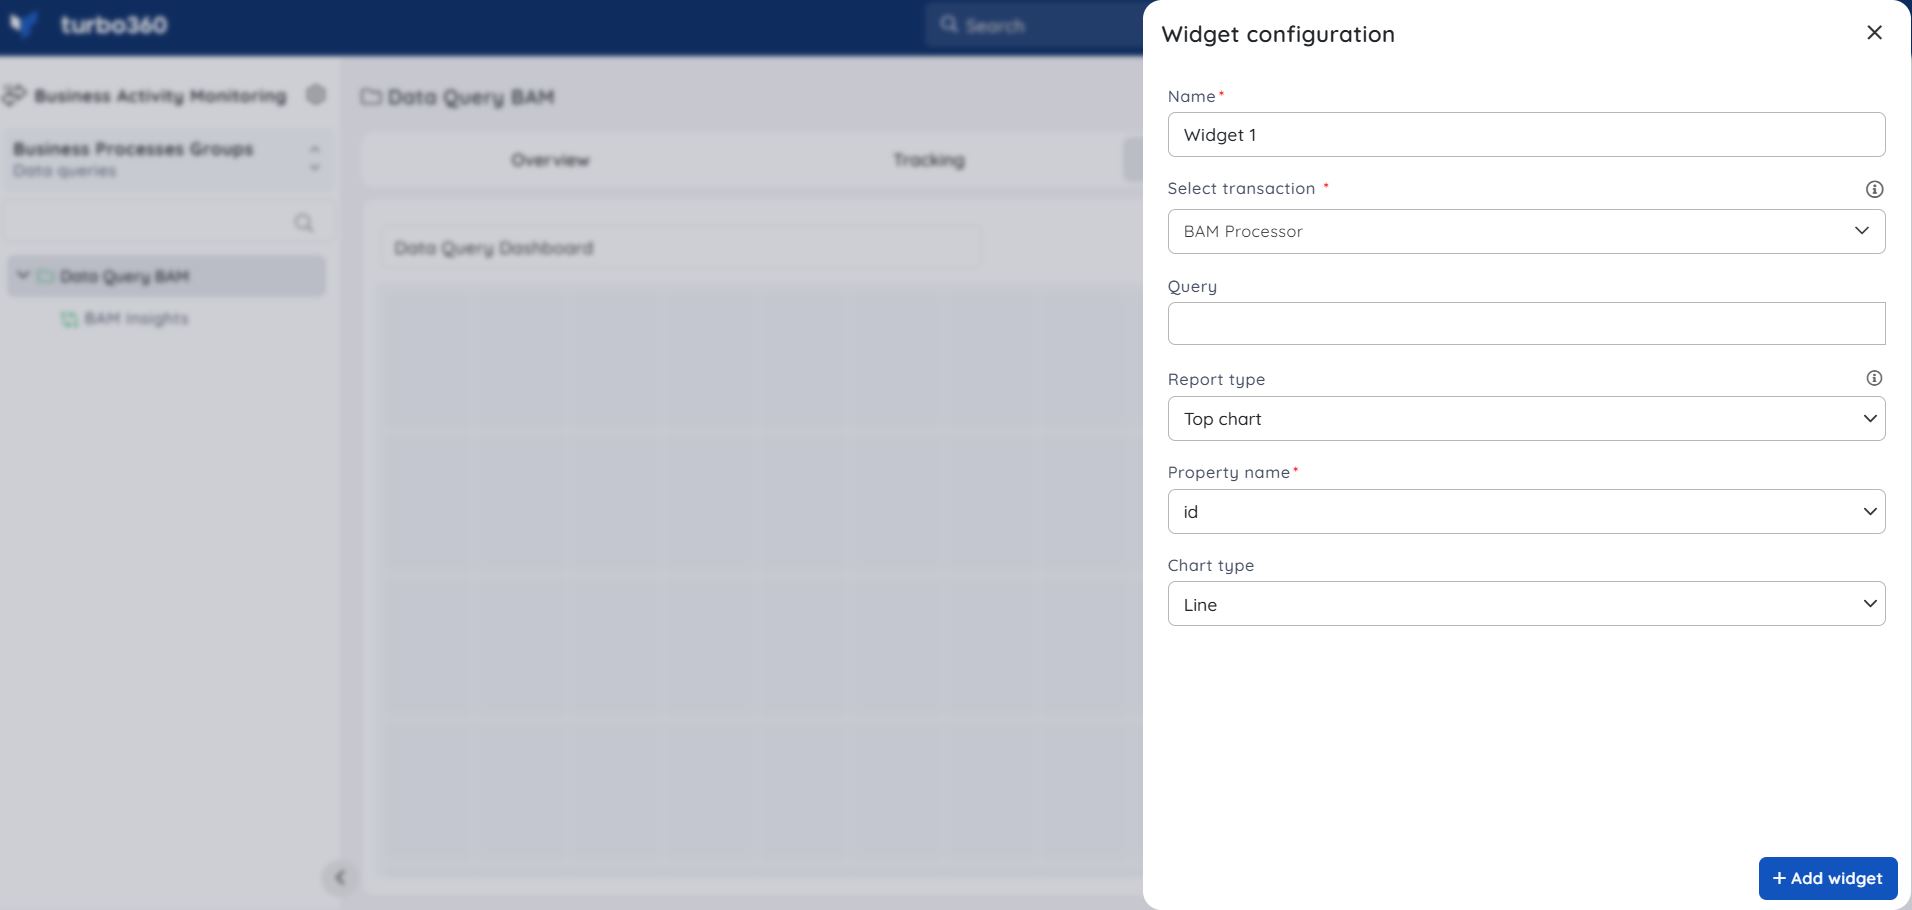
Data Queries type
- Provide a name to the dashboard widget
- Choose the Query type to fetch data based on the query to be provided below
- Enter a Query to retrieve data for the dashboard widget
- Select the preferred report type
- Specify the property name to display timestamp based on the user-defined property.
- Choose the Desired chart type
- Click Add widget
Group by option
This option is available only in the Custom Logging type of BAM.
The widget data can be group based on the following:
- Transaction
- Status
- Property
Group by transaction - Consider if the user requires a widget that displays the number of Transactions, grouped by the Transaction's name, a Top chart or a Multi-Time Series with the Group by Transaction option can be used.
Group by status - Consider if the user requires a widget that displays the number of Transactions grouped by the Status of the Transactions, a Top chart or a Multi-Time Series with the Group by Status option can be used.
Group by property - * Consider if the user requires a widget that displays the number of transactions grouped by a Stage Property (or) a Global property, a Top chart, or a Multi-Time Series with the Group by Property option can be used. The user must specify the Property that will be used to configure the widget.
The Dashboard widget configurations can be updated at any point in time with the help of the Edit option available in the context menu of each dashboard widget. The Delete option can be used to remove the dashboard widgets that are no longer required.
Edit widget
The Dashboard widget configurations can be updated at any point in time with the help of the Edit option available in the context menu of each dashboard widget.
Delete widget
The Delete option can be used to remove the dashboard widgets that are no longer required.
Importing / Exporting a Dashboard
This functionality is available only in the Custom Logging type of BAM.
Users have the option of importing and exporting Dashboards in JSON format.
Users can import the JSON-format Dashboard file by clicking the Import button in the Dashboard section.
A Business Activity Monitoring (BAM) Dashboard can also be exported by clicking the Export button in the Dashboard section and giving the JSON file a Name.
Actionable Dashboard
The Business Activity Monitoring (BAM) Dashboard has been improved to make it more user-friendly.
When a user clicks a specific widget in a Business Activity Monitoring (BAM) dashboard that is mapped to a Search Query, the user is navigated to the Tracking page.
The transactions are filtered based on the search query entered and the time frame selected in the Dashboard.
Was this article helpful?