

Cosmos SQL Container
- 19 Nov 2024
- 2 Minutes to read
- Print
- DarkLight
- Download PDF
Cosmos SQL Container
- Updated on 19 Nov 2024
- 2 Minutes to read
- Print
- DarkLight
- Download PDF
Article summary
Did you find this summary helpful?
Thank you for your feedback!
Azure Cosmos SQL
Azure Cosmos DB SQL API accounts provide support for querying items using the Structured Query Language (SQL), one of the most familiar and popular query languages, as a JSON query language.
With Turbo360, it is possible to manage Cosmos SQL Containers.
Once an Azure Cosmos SQL Container is associated with Turbo360's Business Application, it can be managed from a central place.
Cosmos SQL Database can contain any number of containers; each container can be managed separately by associating it with Turbo360.
Execute SQL Queries
Turbo360 extends its capability to execute SQL Queries without a need to switch to any database management tools.
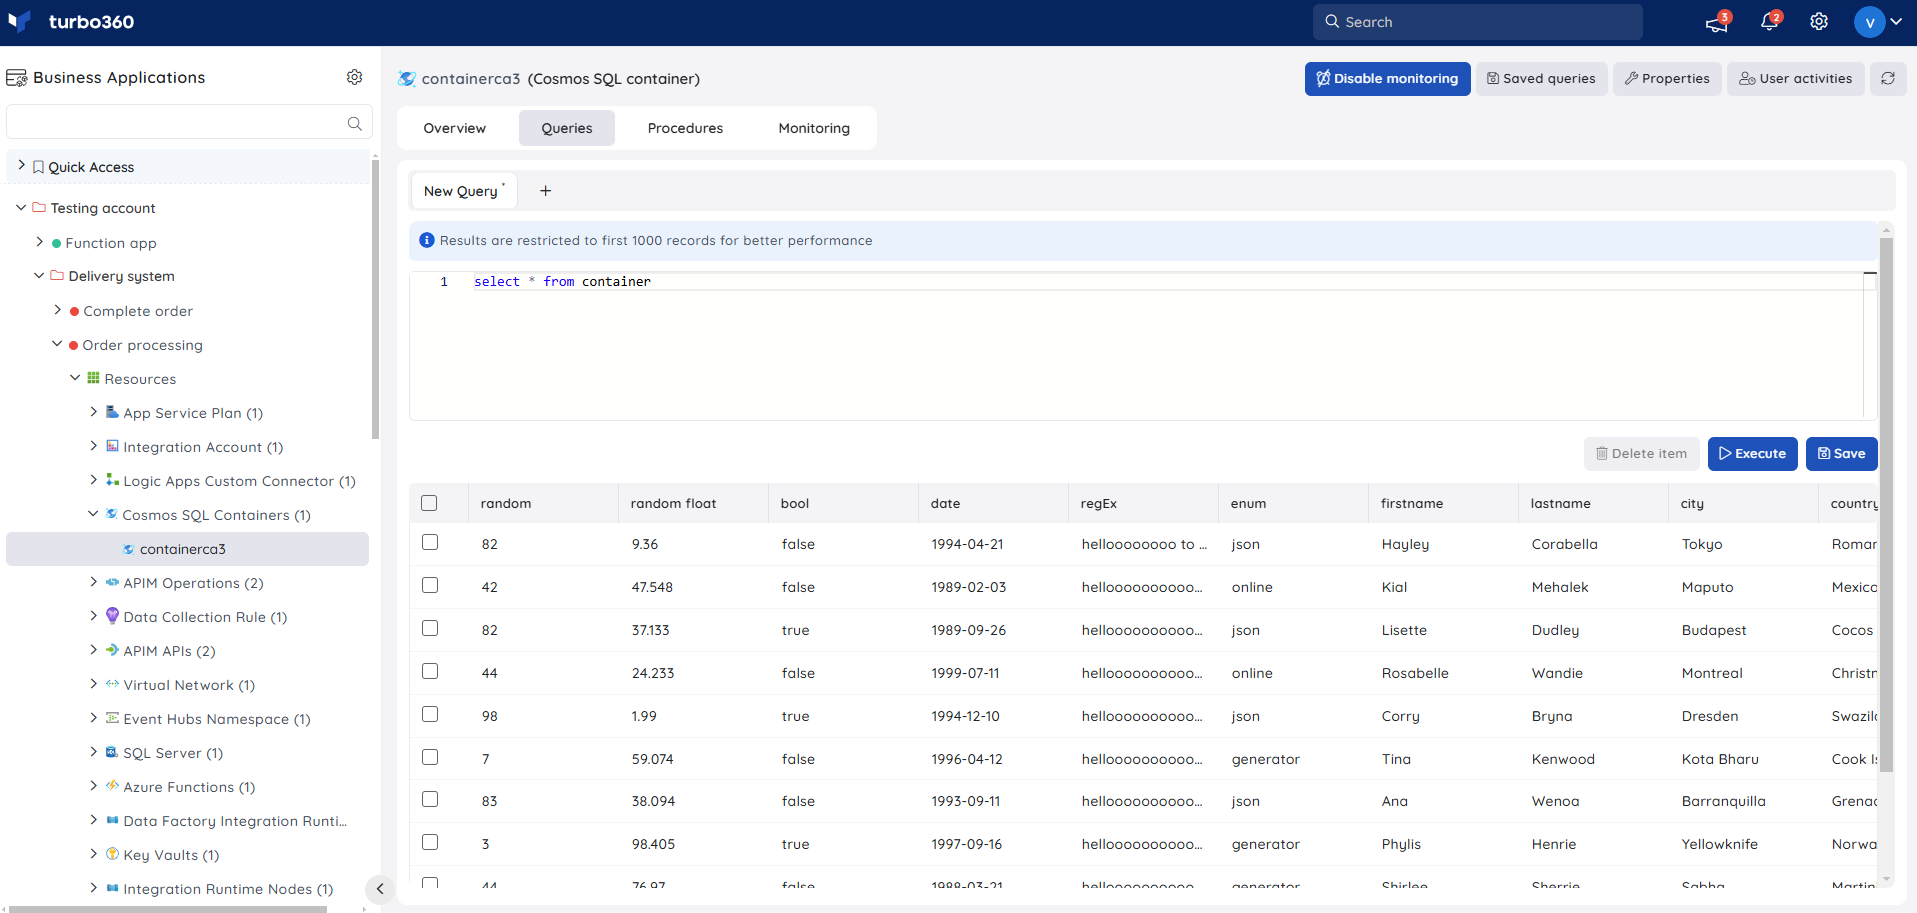
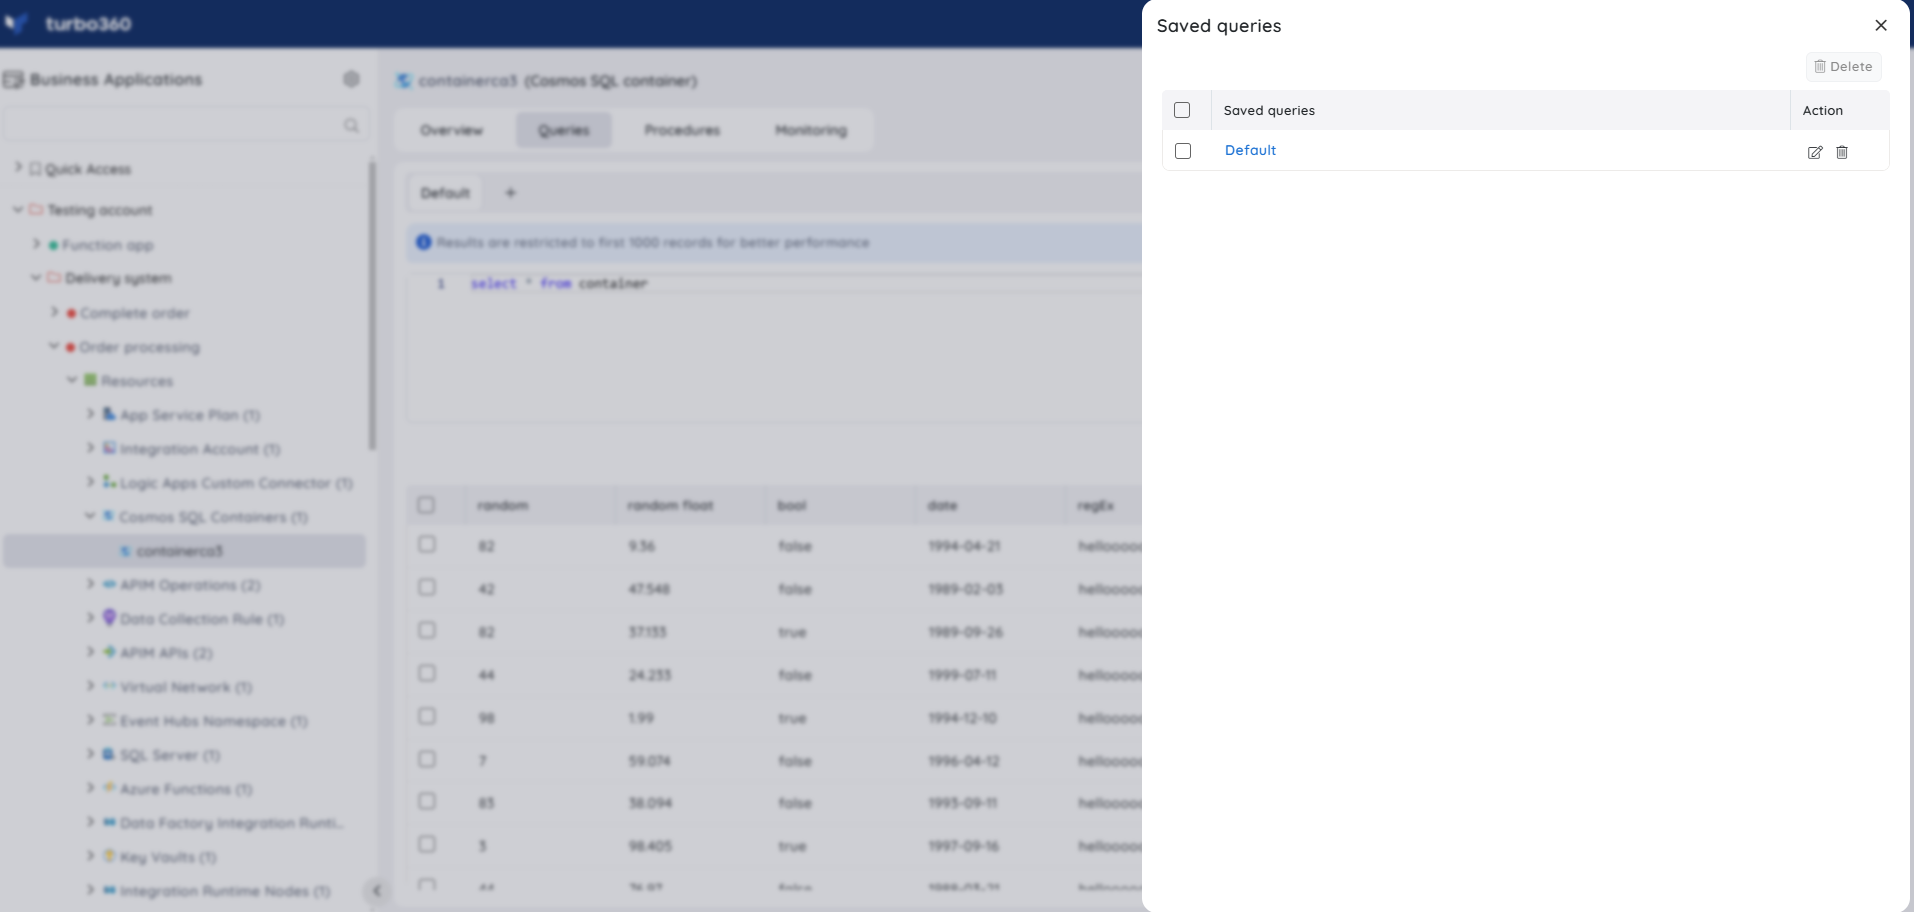
Users can also save a query and run the associated stored procedures.
The saved queries can be opened by clicking the Saved queries option availabe at the top of the section.
Stored Procedures
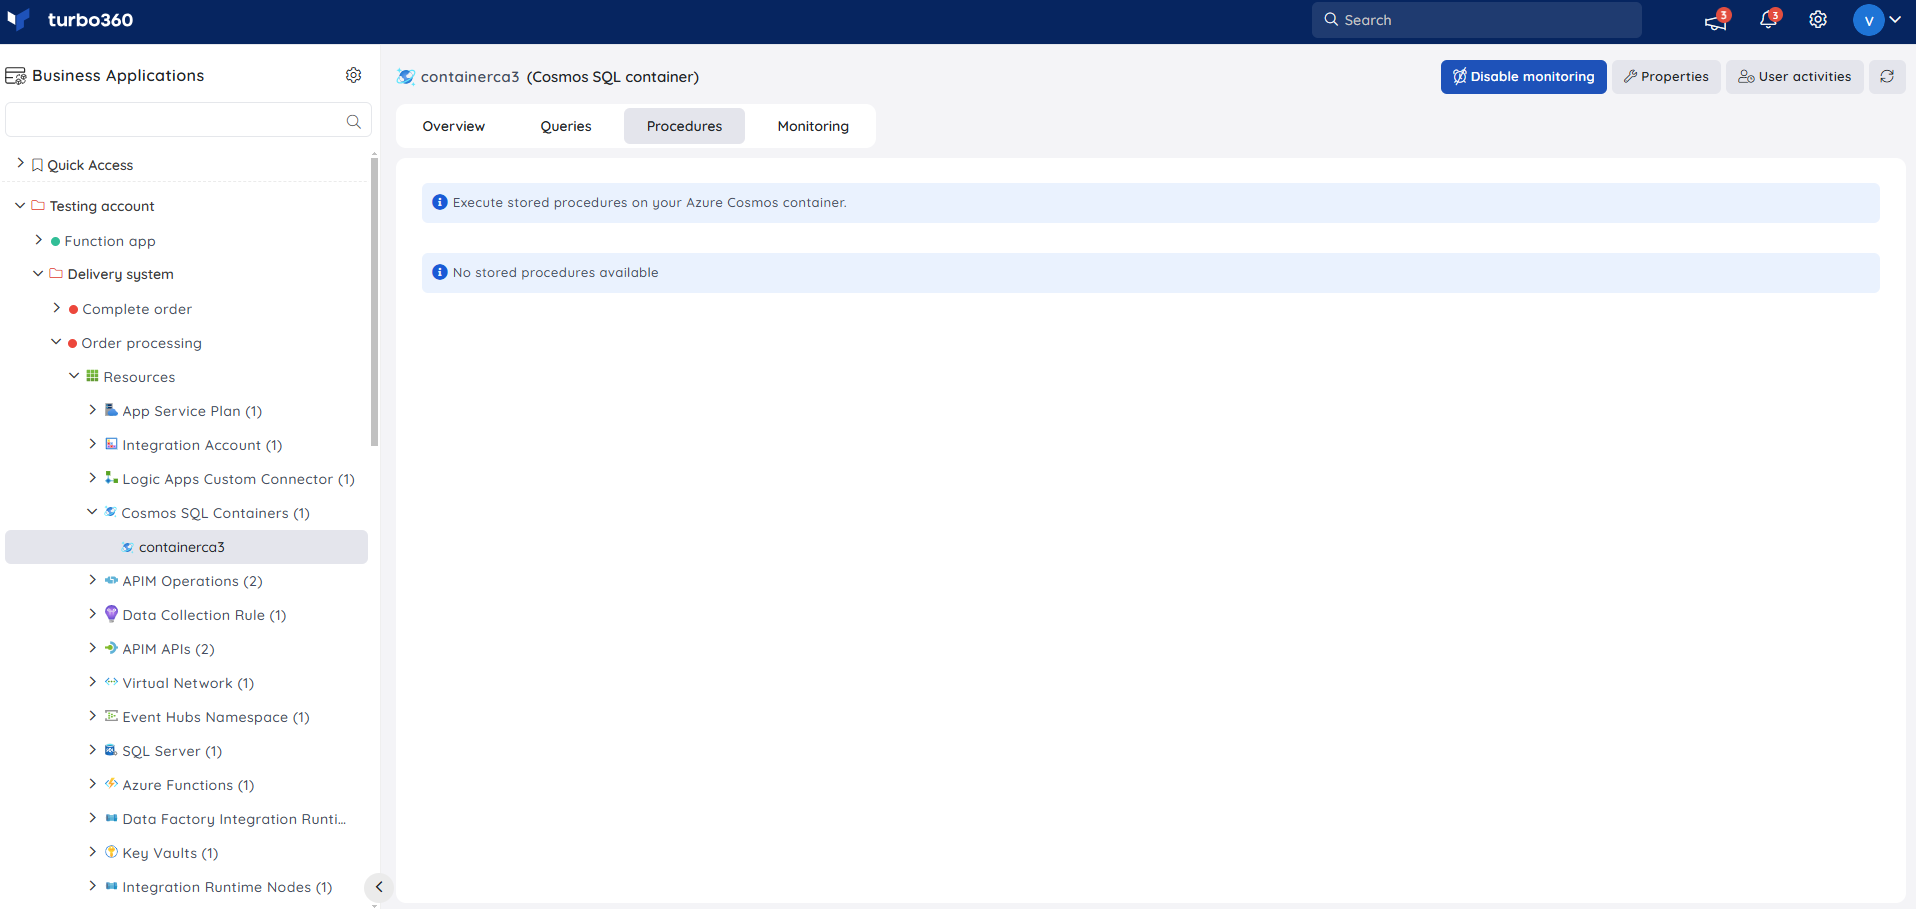
The stored procedures present in the container will be listed by:
- selecting the required procedure
- providing the appropriate input,
Users can execute the stored procedures in Turbo360.
SELECT queries and Stored Procedures can only be executed from Turbo360. DML and DDL statements are restricted to prevent SQL injection attacks.
Managing Container item
Users can select the results from the executed query and choose to perform either deletion or update of that item.
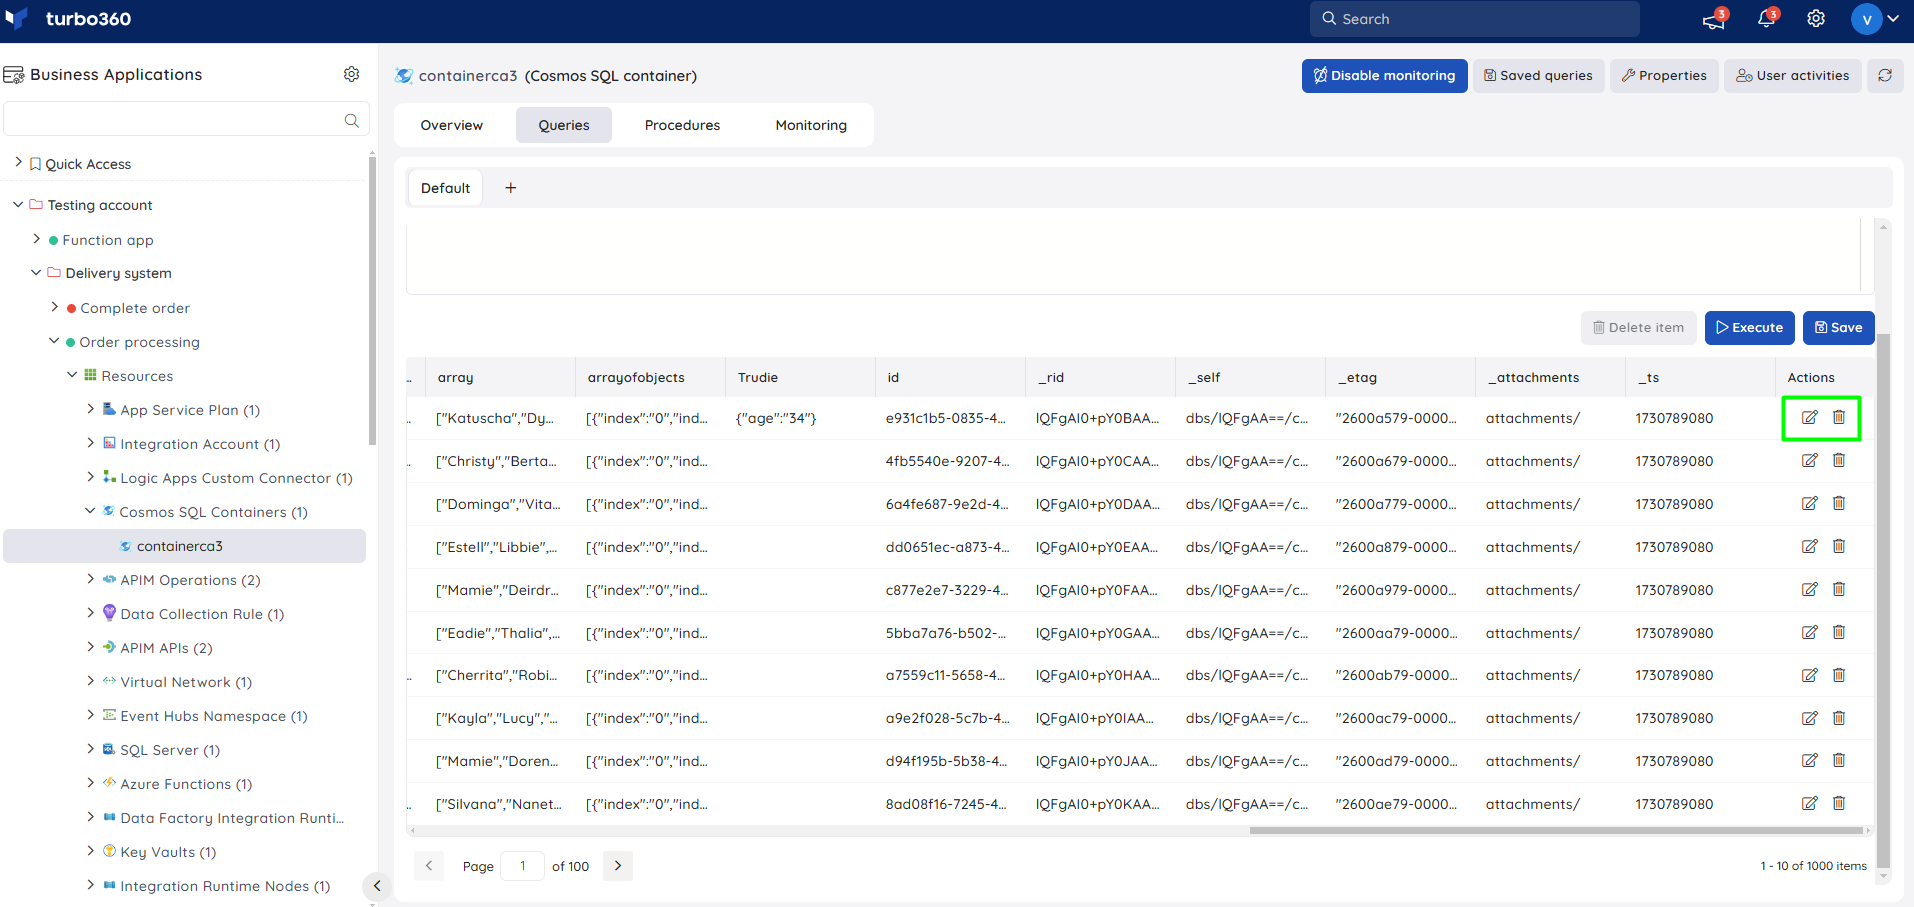
Bulk deletion of items is also possible. On clicking the item id, a blade will be displayed where users will be able to edit and update the item.
Turbo360 also provides the capability to save the queries that are frequently used, so that the process of manually entering the query can be eliminated.
Resource Dashboard
A default resource dashboard is available for Cosmos SQL Container resources in the Overview section, allowing for enhanced data visualization and tracking of real-time data.
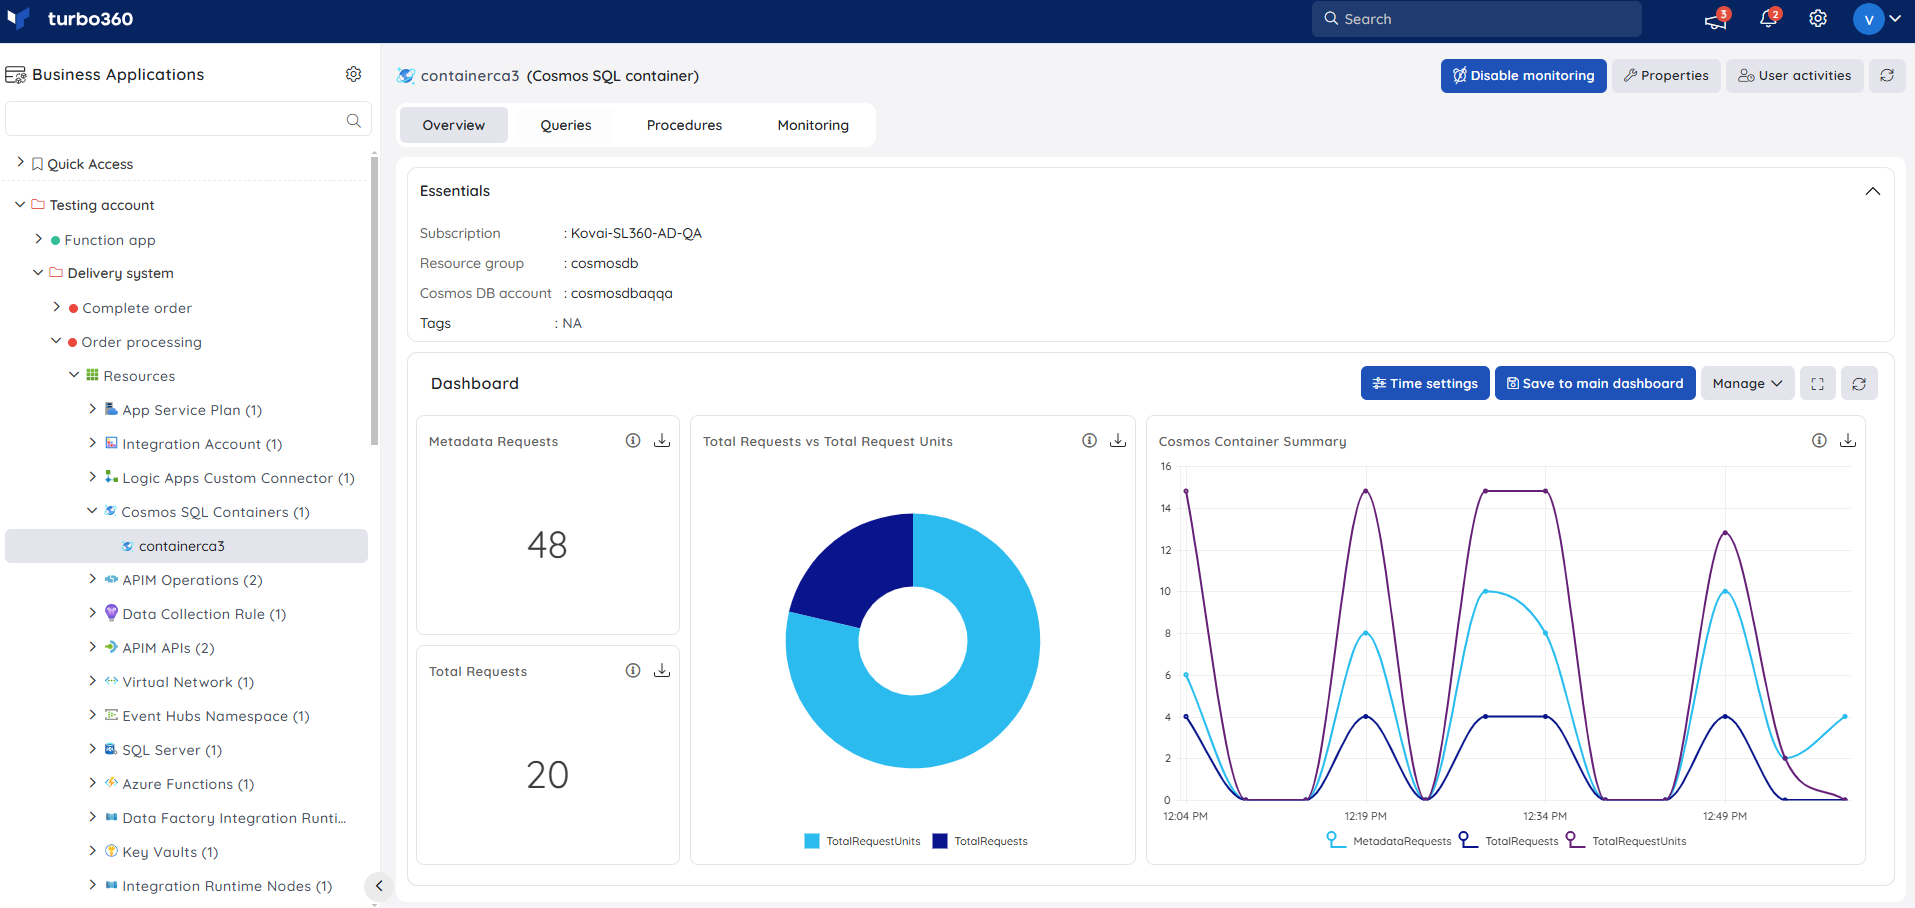
Users are provided with the following pre-defined Dashboard widgets, which can be customised to meet their specific needs.
1. Metadata Requests
2. Total Requests vs Total Request Units
3. Cosmos Container Summary
4. Total Requests
Monitoring
- Navigate to Cosmos SQL Container -> Monitoring to configure monitoring rules.
- You can configure the monitoring metrics under the Metrics and Properties tab and query rules under the Queries tab.
Metric monitoring
- Switch to the Metrics and properties tab to configure rules for metric monitoring
- Select the necessary monitoring metrics and configure the threshold values
- Click Save
The threshold values can also be provided with any metric name, defining the monitoring rule to be violated when the metric value configured at threshold field is met.
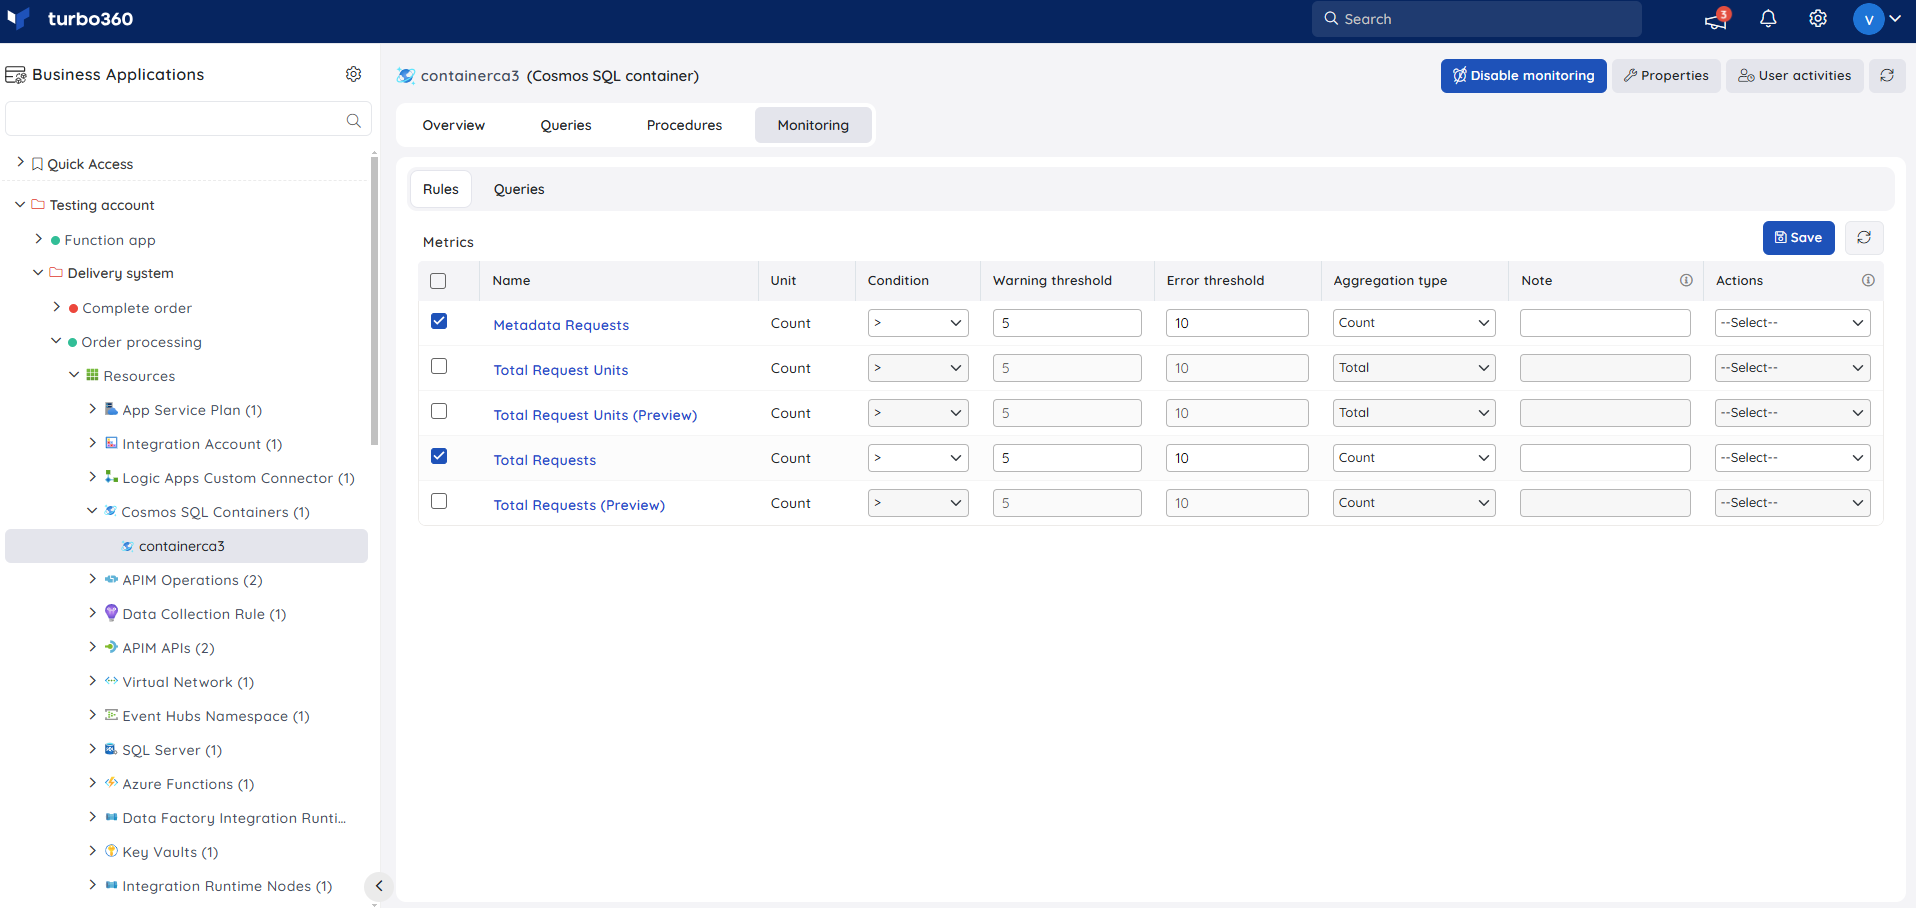
Monitoring rules will be saved for Cosmos SQL Container, and the monitoring state for the metrics will be reflected after every monitoring cycle.
Query monitoring
- Switch to the Queries tab to configure rules for query monitoring
- Click Add
- Enter a name to the query rule
- You can enter the desired query by choosing Enter query (or) select one from the list of saved queries by choosing Open from saved queries
- Click Validate to validate the query
- Click Save
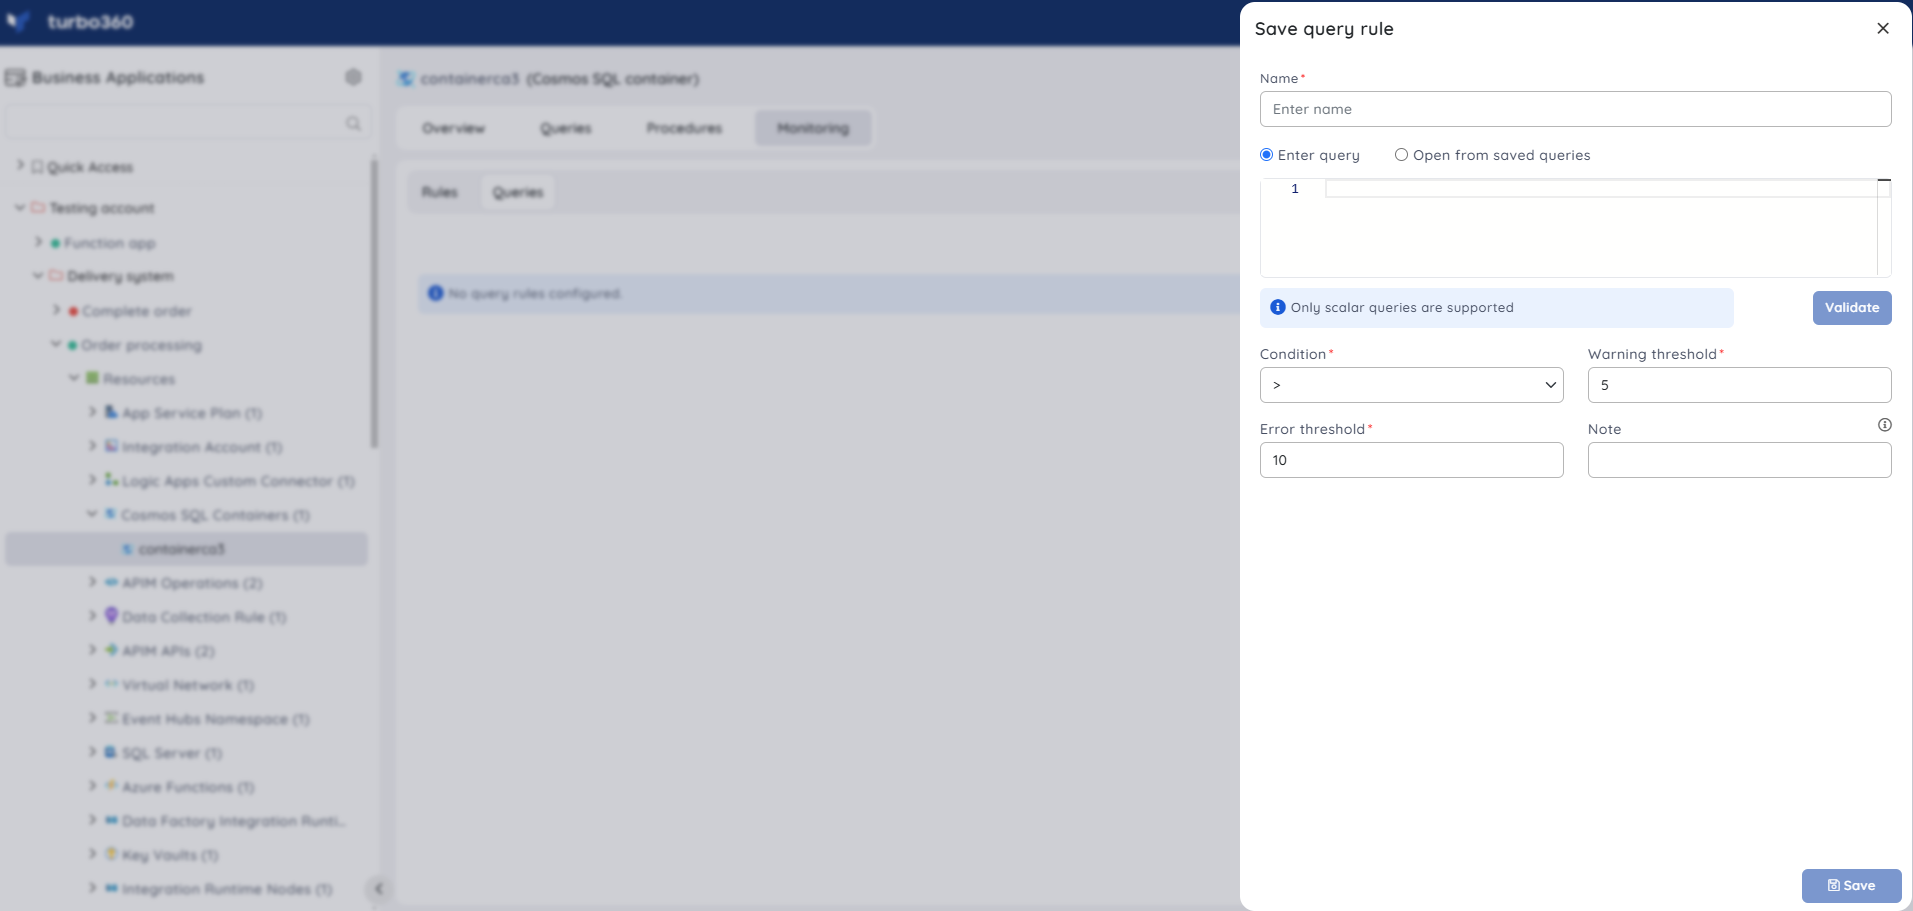
Query monitoring will be initiated once the rules are saved, and the query monitoring state will be reflected after every monitoring cycle.
Was this article helpful?