- 19 Nov 2024
- 1 Minute to read
- Print
- DarkLight
- PDF
Cosmos Table
- Updated on 19 Nov 2024
- 1 Minute to read
- Print
- DarkLight
- PDF
Introduction
Azure Cosmos DB provides Table API (Table storage) that is designed to support cloud-scale applications that can contain billions of entities ("rows" in relational database terminology) of data, or for datasets that must support high transaction volumes.
Turbo360 provides managing support to hasten this complex solution.
Managing Cosmos Table entities
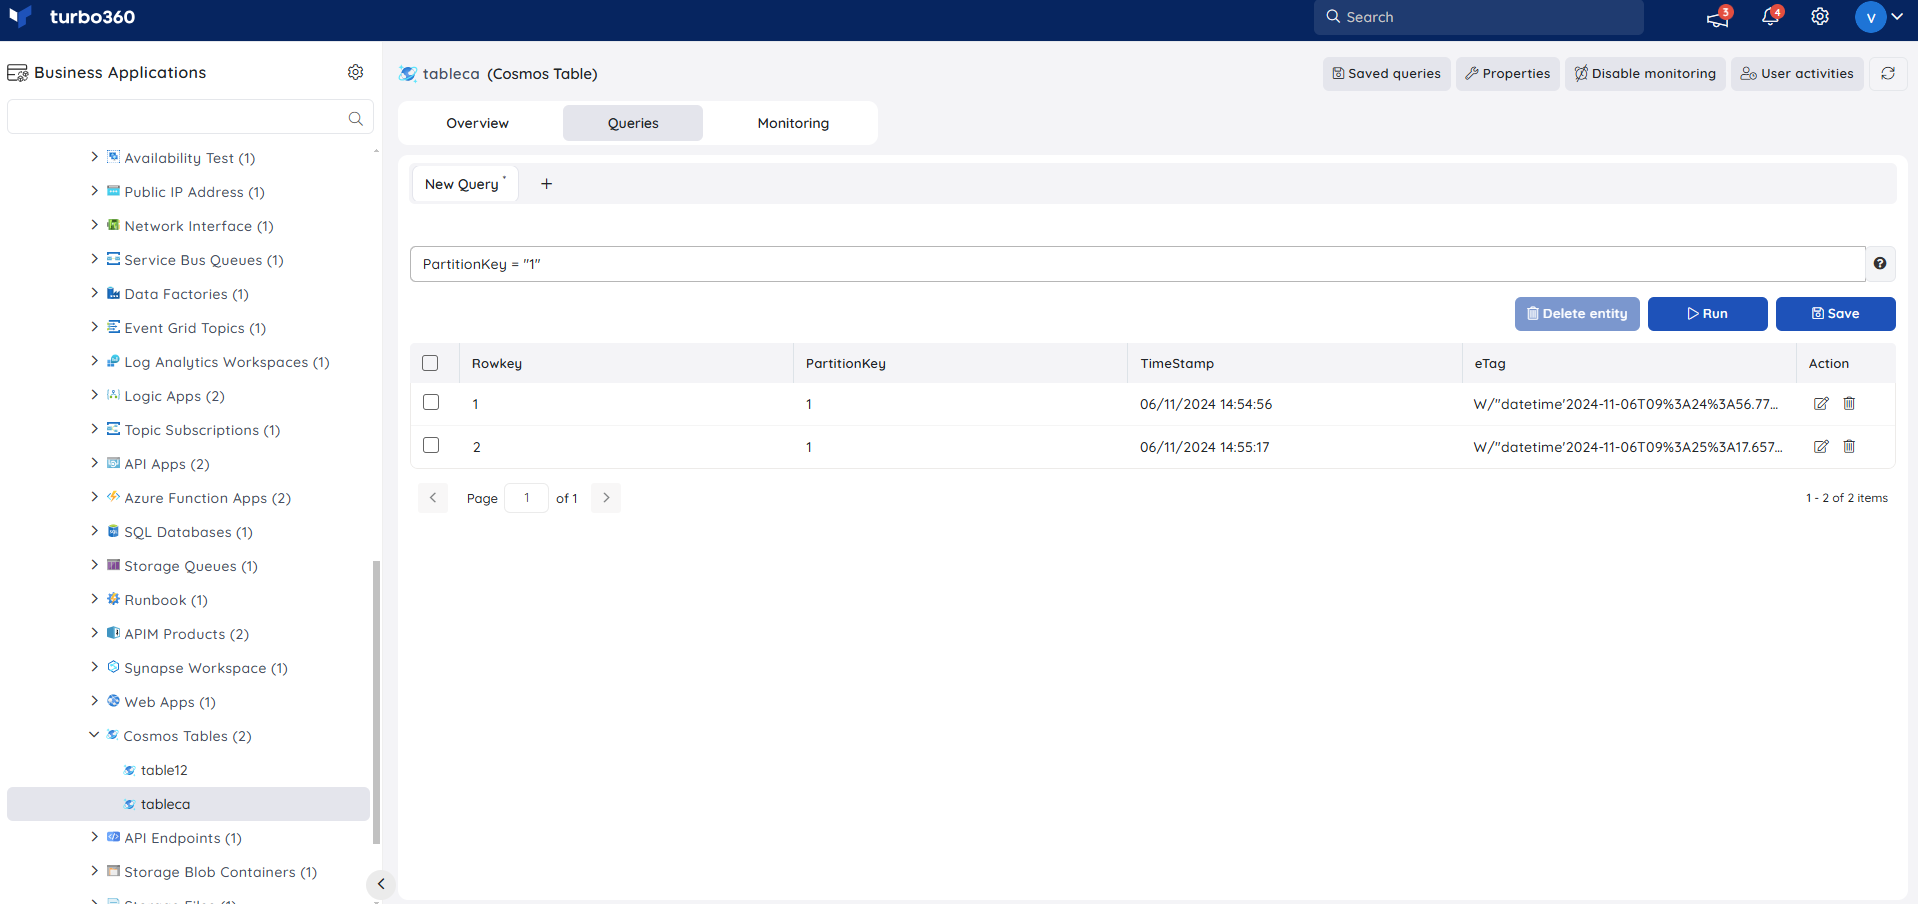
Users can retrieve table entities by executing queries and perform updates and deletion operations based on their needs using Turbo360.
Bulk deletion of entities is also an option.

Resource Dashboard
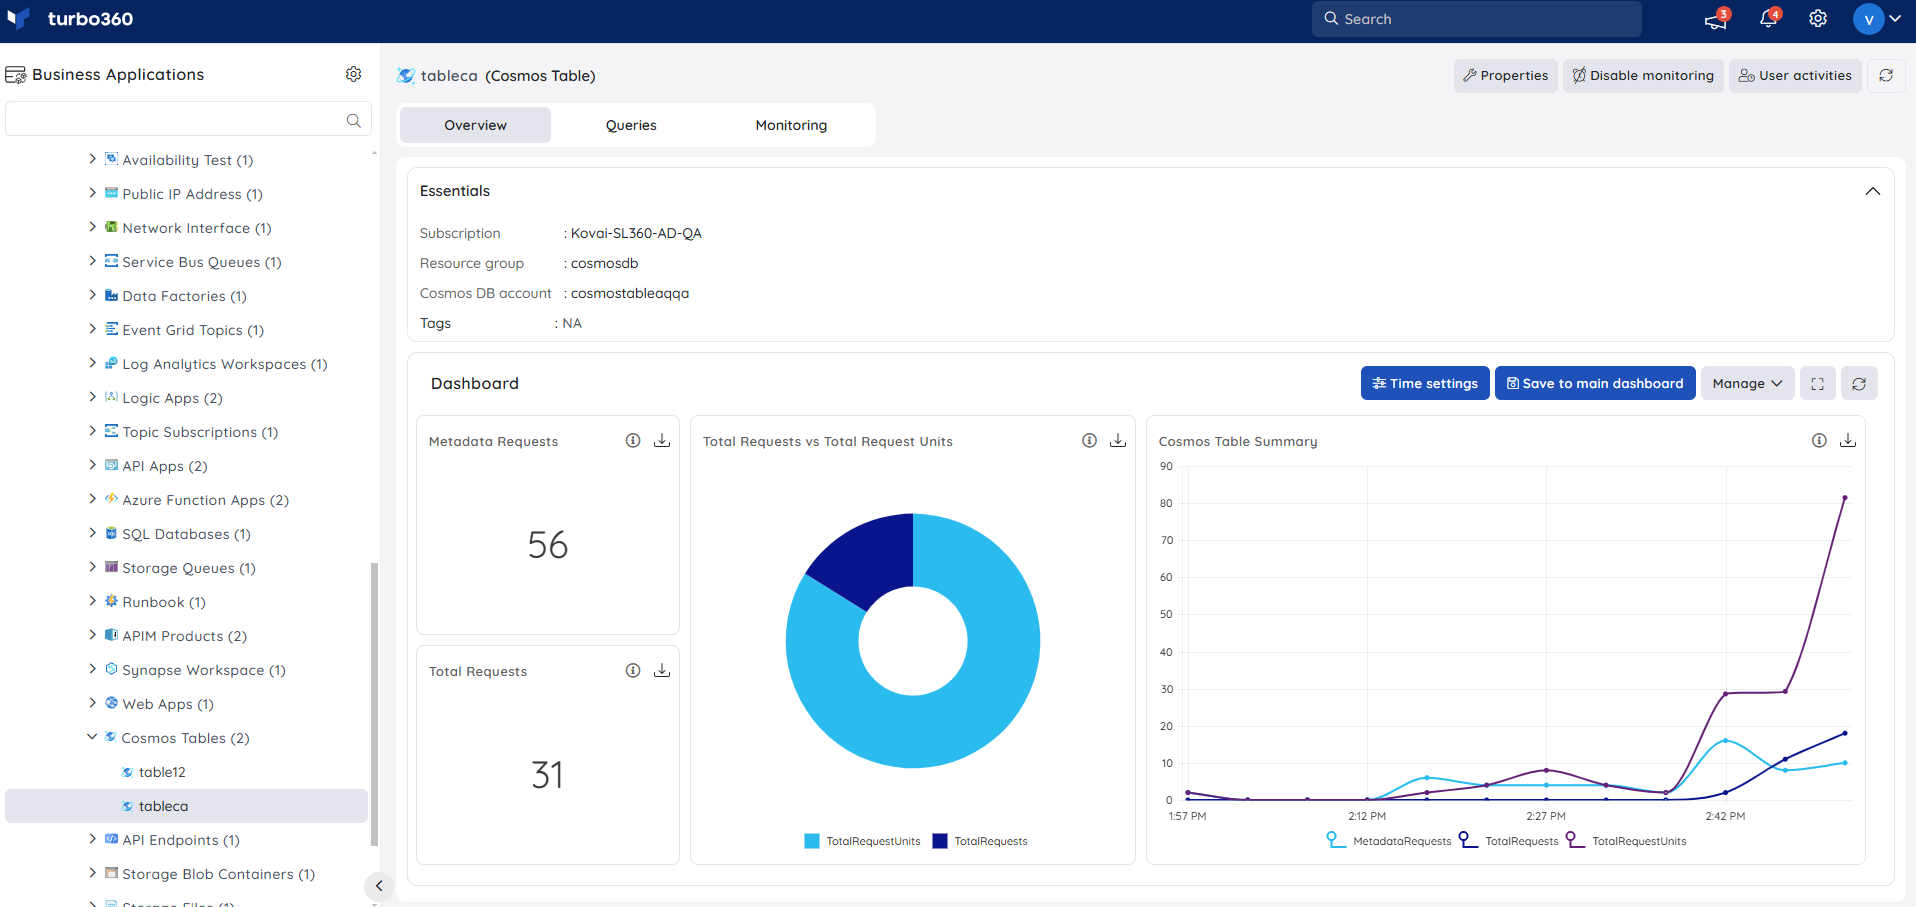
A default resource dashboard is available for Cosmos Table resources in the Overview section, allowing for enhanced data visualization and tracking of real-time data.

Users are provided with the following pre-defined Dashboard widgets, which can be customised to meet their specific needs.
1. Metadata Requests
2. Total Requests vs Total Request Units
3. Cosmos Table Summary
4. Total Requests
Monitoring
- Navigate to Cosmos Table -> Monitoring to configure monitoring rules.
- You can configure the monitoring metrics under the Metrics and Properties tab and query rules under the Queries tab.
Metric monitoring
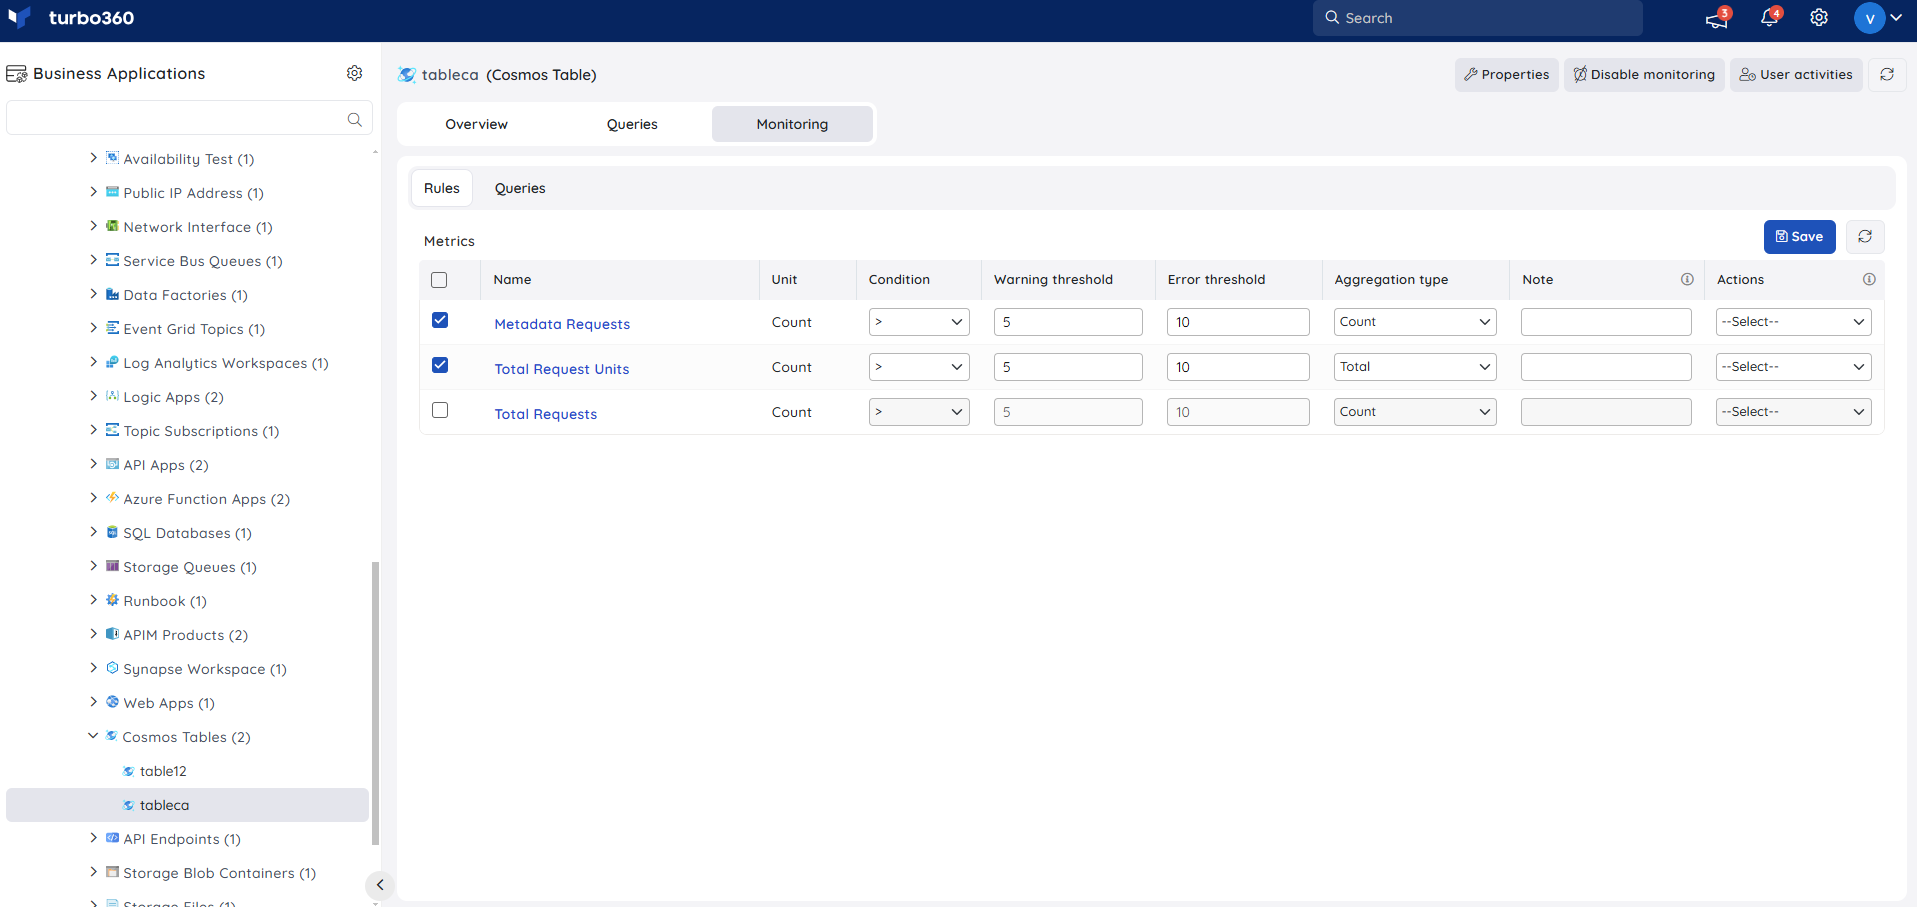
- Switch to the Metrics and properties tab to configure rules for metric monitoring
- Select the necessary monitoring metrics and configure the threshold values
- Click Save
The threshold values can also be provided with any metric name, defining the monitoring rule to be violated when the metric value configured at threshold field is met.

Monitoring rules will be saved for Cosmos Table , and the monitoring state for the metrics will be reflected after every monitoring cycle.
Query monitoring
- Switch to the Queries tab to configure rules for query monitoring
- Click Add
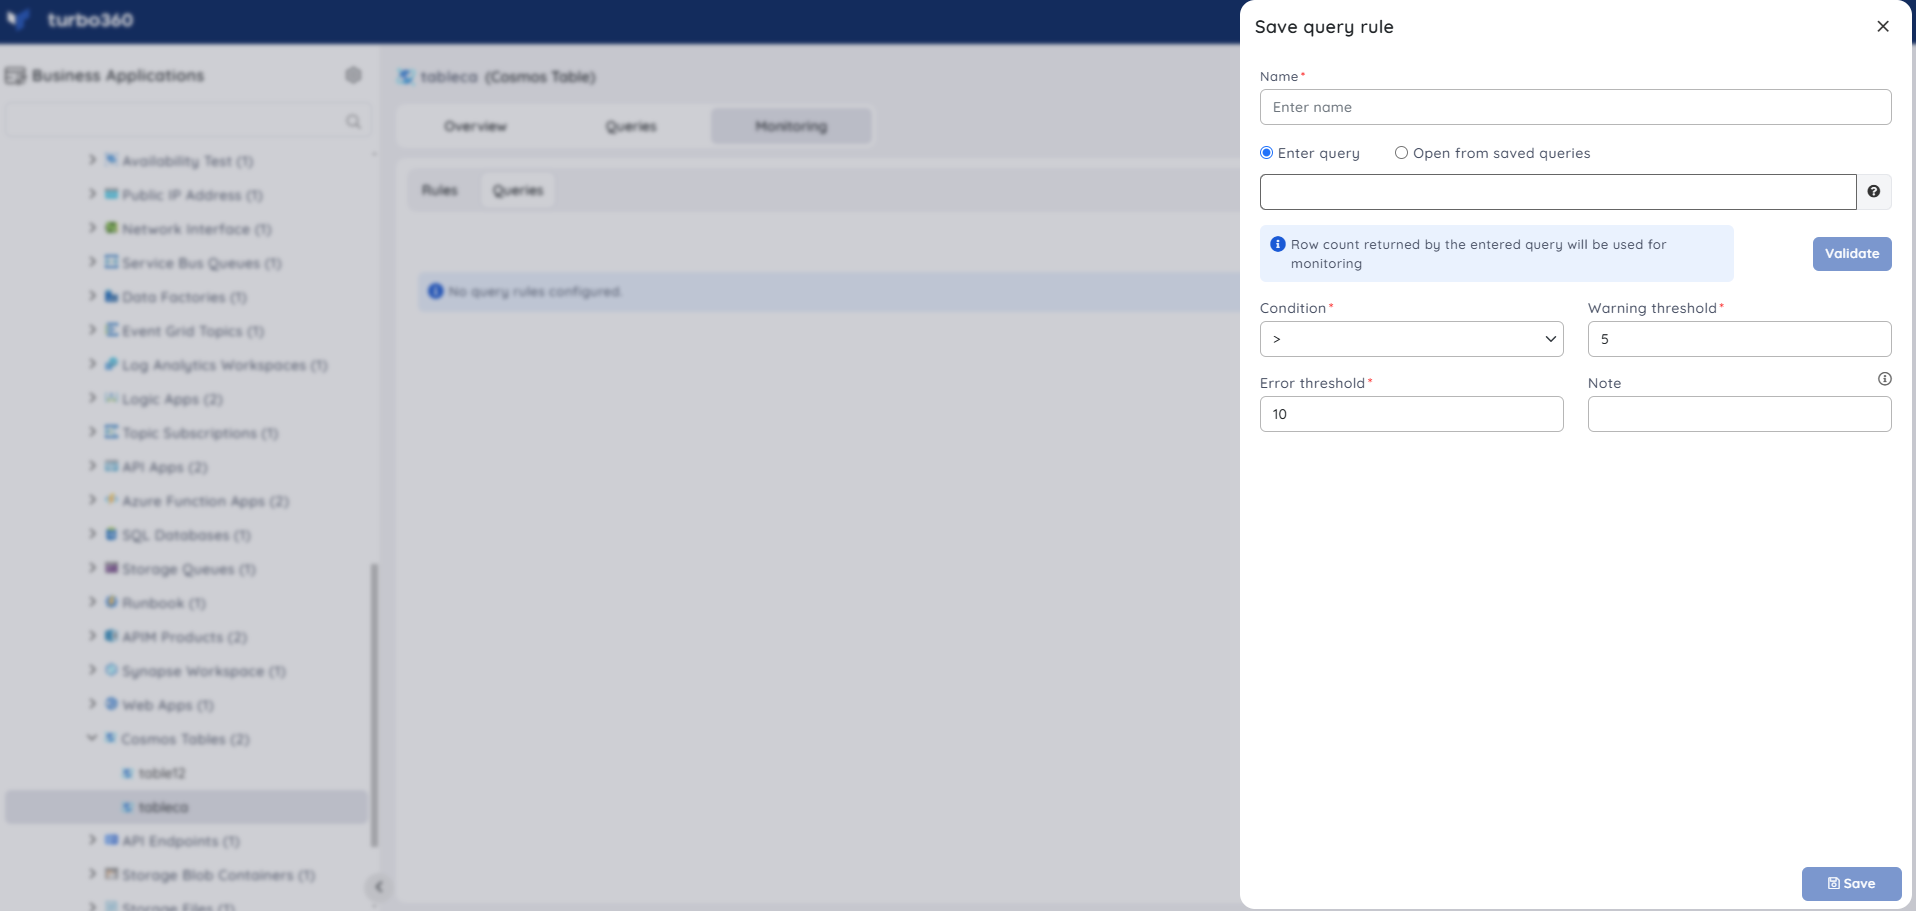
- Enter a name to the query rule
- You can enter the desired query by choosing Enter query (or) select one from the list of saved queries by choosing Open from saved queries
- Click Validate to validate the query
- Click Save

Query monitoring will be initiated once the rules are saved, and the query monitoring state will be reflected after every monitoring cycle.

