- 19 Nov 2024
- 2 Minutes to read
- Print
- DarkLight
- PDF
Data Factory
- Updated on 19 Nov 2024
- 2 Minutes to read
- Print
- DarkLight
- PDF
Introduction
Data Factory is a cloud-based data integration service that allows you to create cloud-based data-driven workflows to orchestrate and automate the movement and transformation of data.
Once a Data Factory is associated with a Turbo360 Business Application, it is possible to perform a number of operations, which will be covered in this section.
Pipeline Triggers
Turbo360 introduces a feasible solution for managing all the trigger operations by providing Triggers functionality in Data Factory resources and continues to meet the needs of its customers on a regular basis.
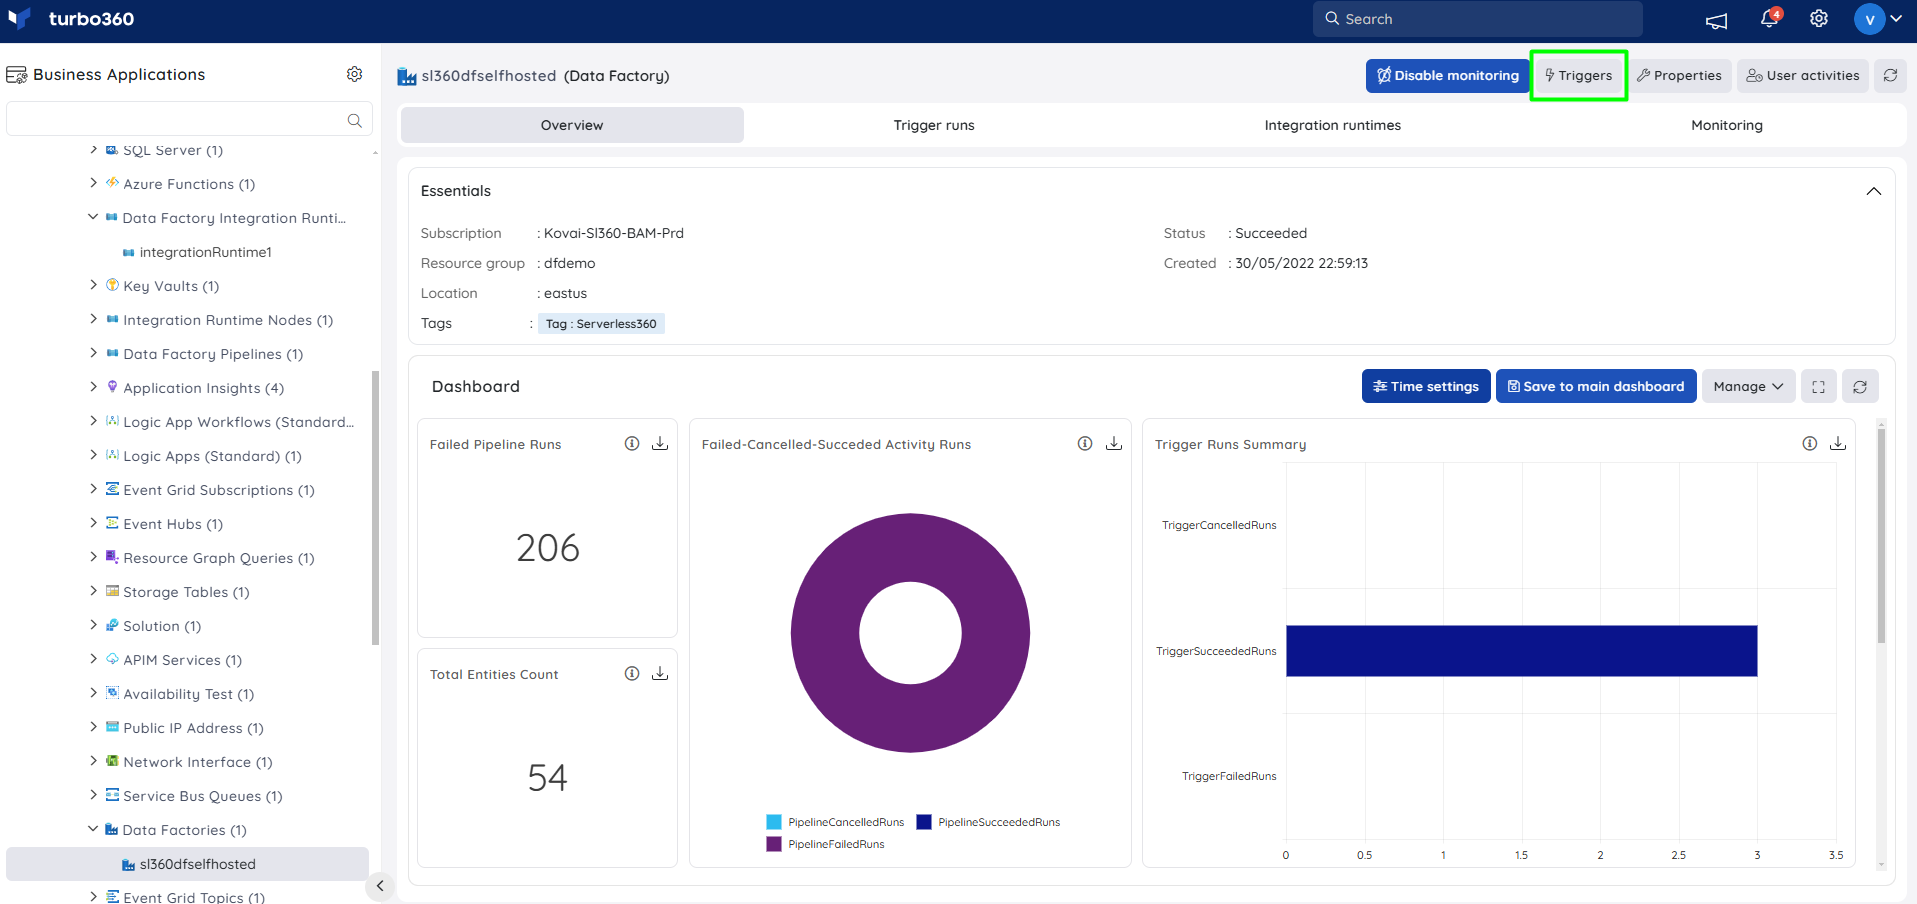
The main function of this latest implementation is to start and stop Data Factory triggers directly from Turbo360.
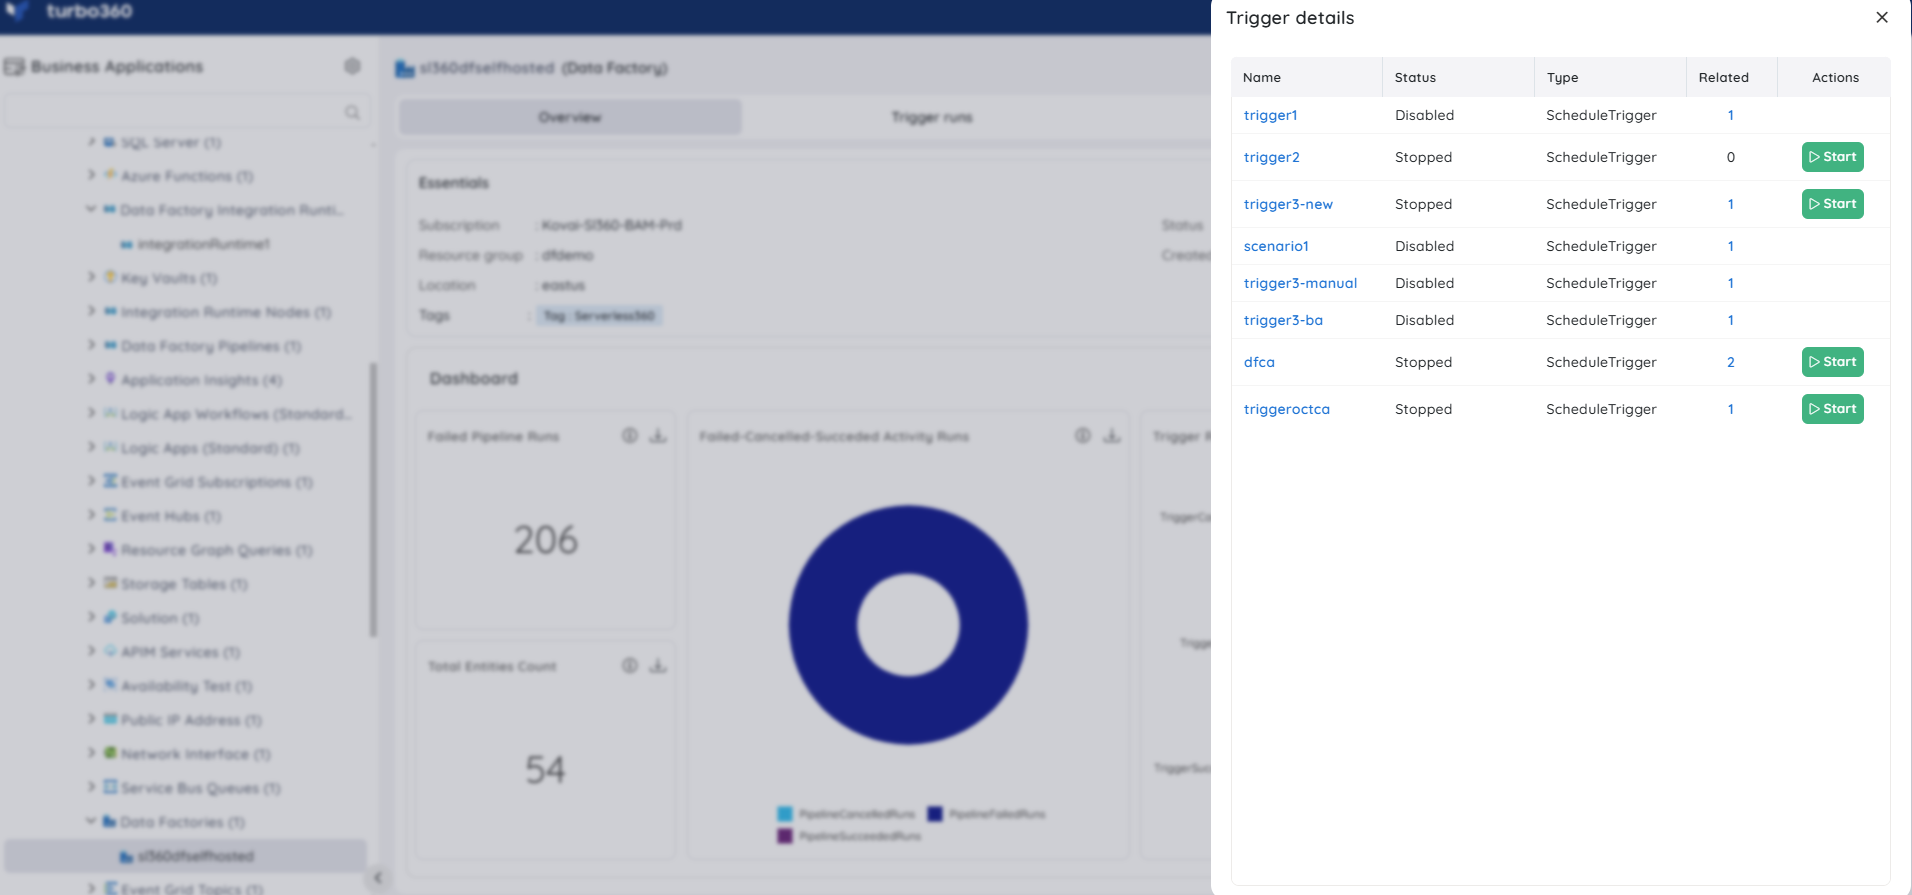
Clicking on a trigger will display the specifics of triggers associated with the respective Data Factory resource.
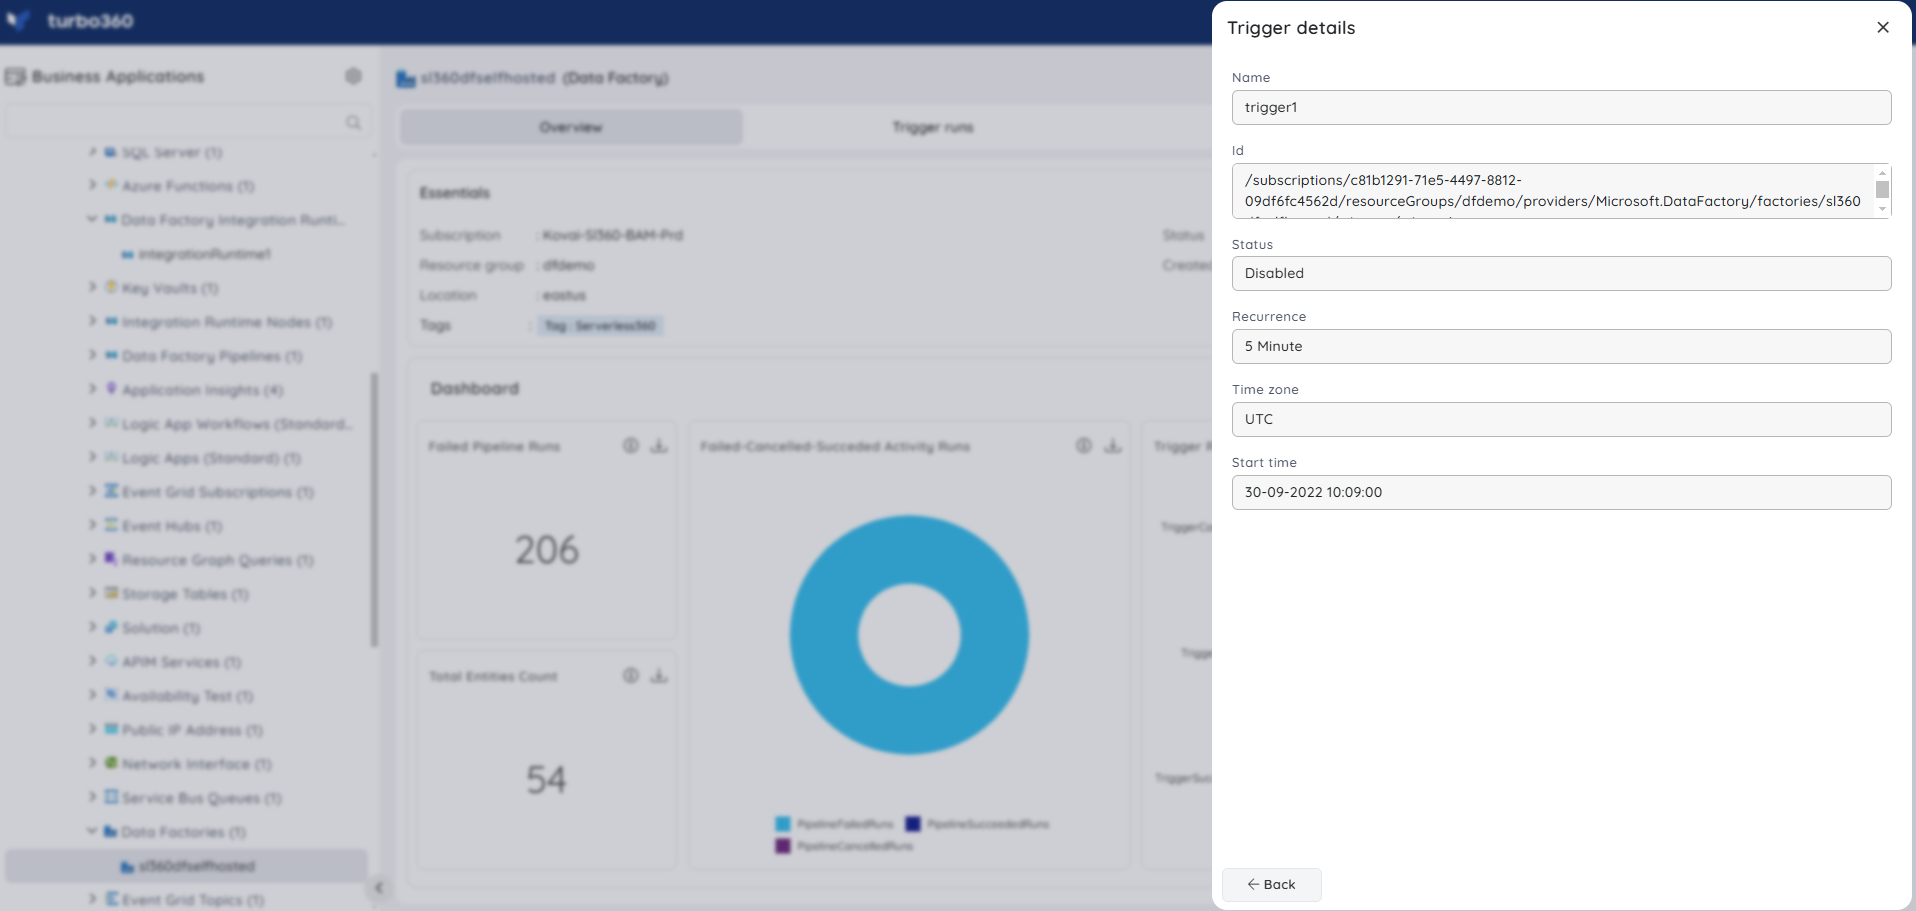
Field values such as Description, End Time, and Annotation will be displayed in Trigger details only if values for the same are available in Azure portal.
Trigger Runs
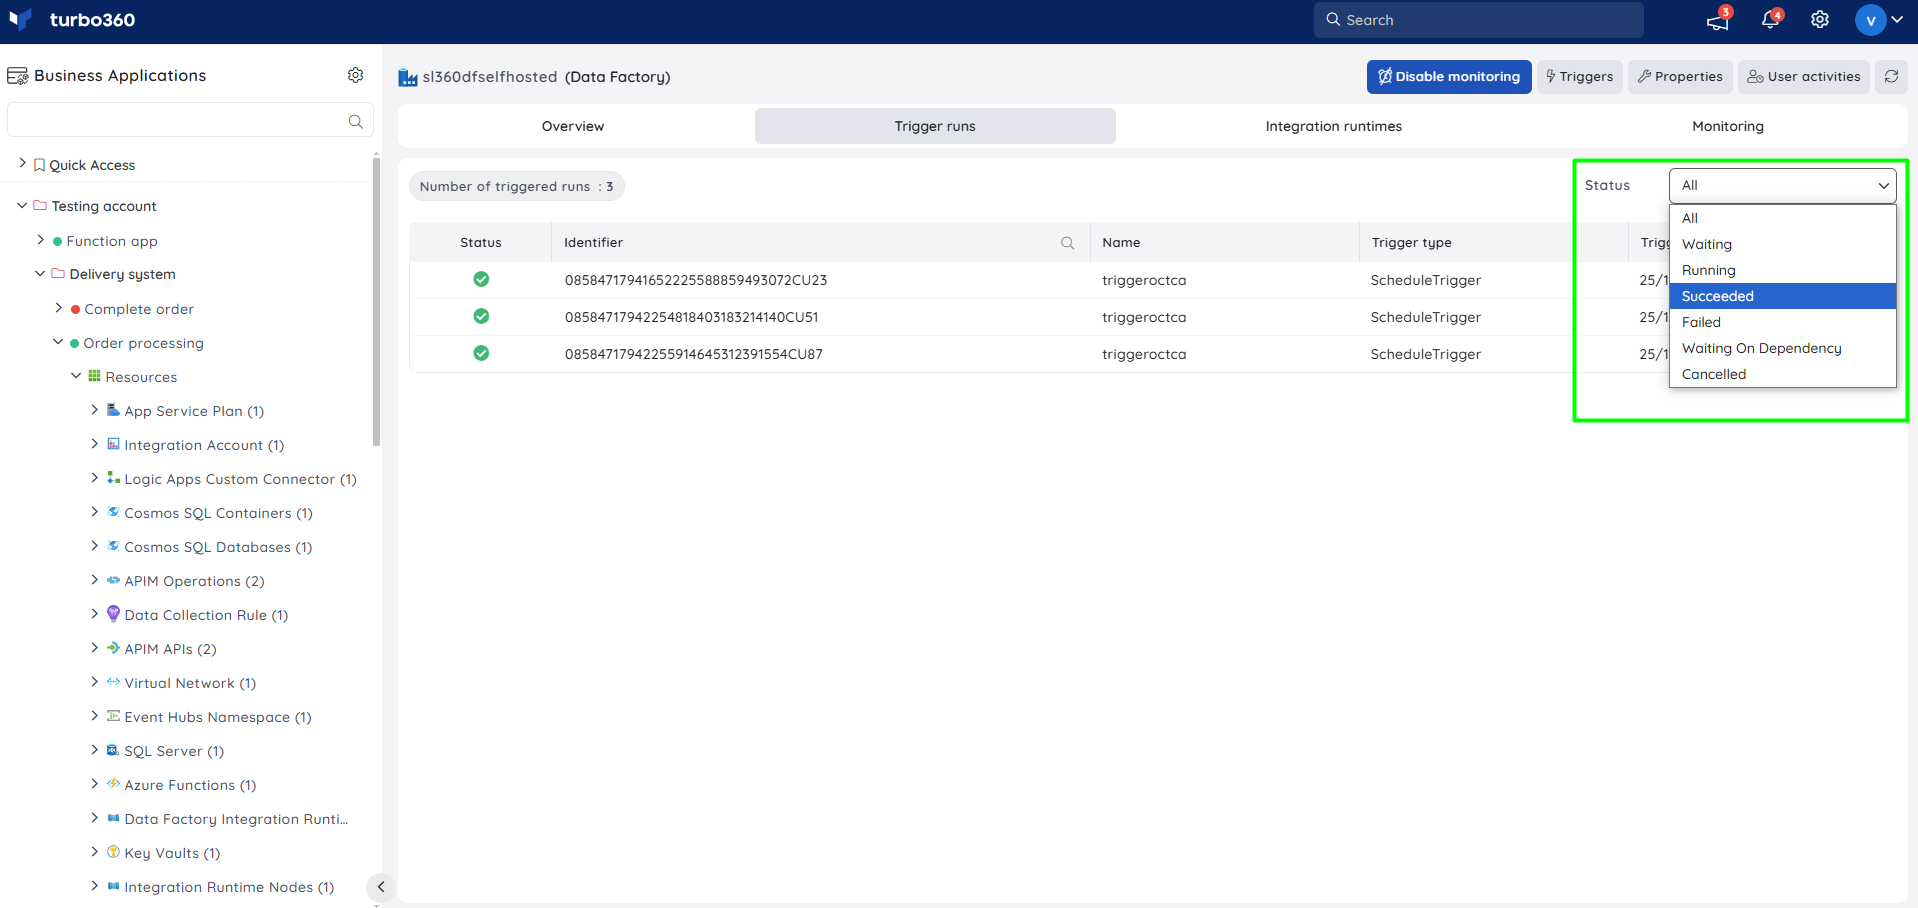
Turbo360 allows users to view all the trigger runs, including details such as the trigger type and the time the trigger was executed.
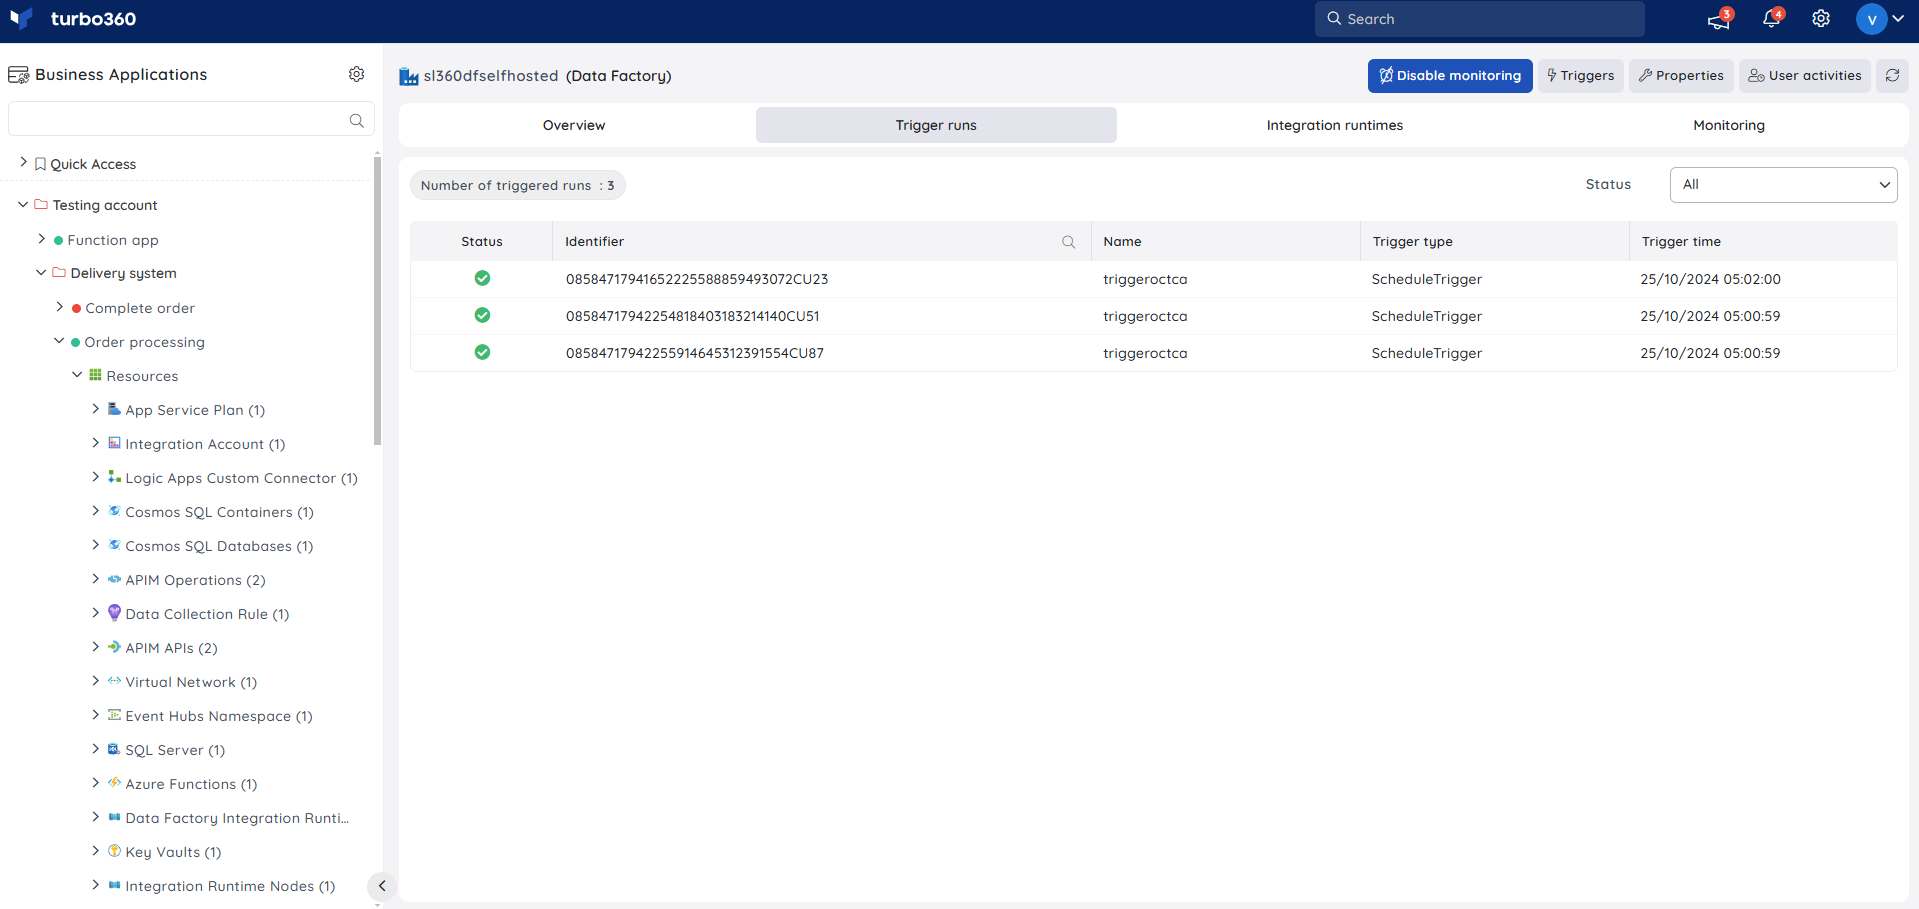
The trigger runs can be filtered based on their status. Following are the statuses of the trigger runs that helps in its filtration:
- Waiting
- Running
- Succeeded
- Failed
- Waiting on Dependency
- Cancelled
Integration Runtimes
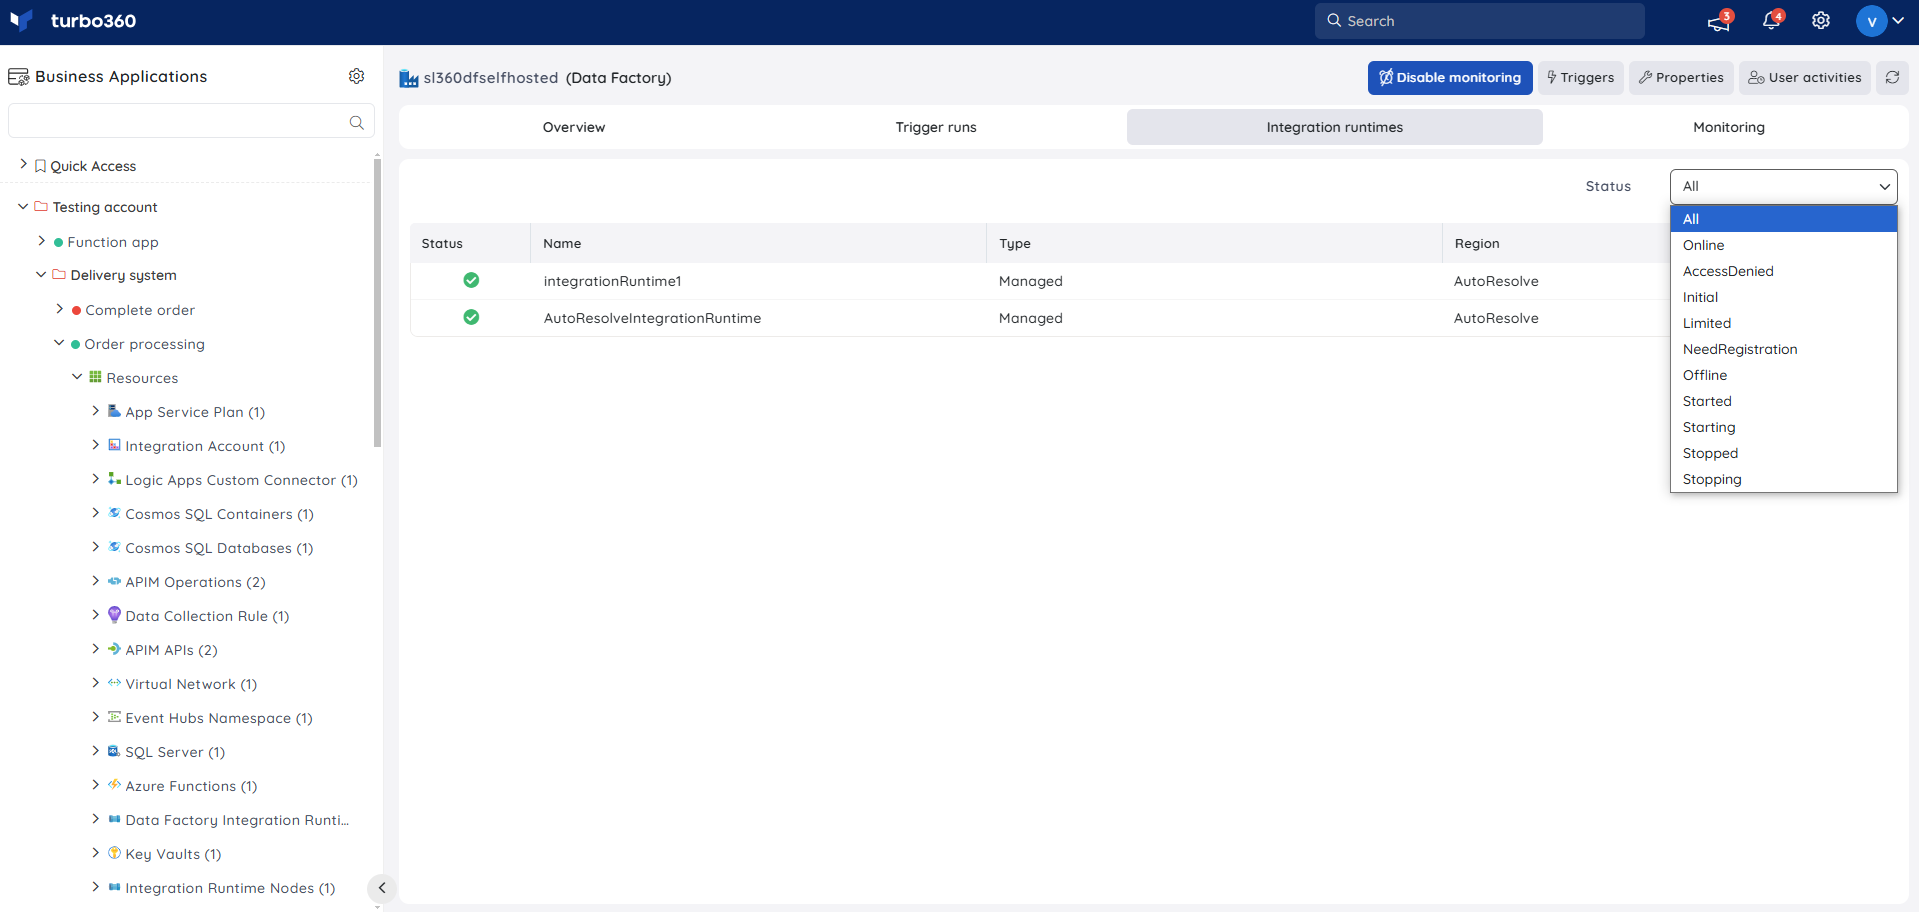
Integration Runtimes can be viewed and filtered based on the following statuses:
- Online
- Access Denied
- Initial
- Limited
- Need Registration
- Offline
- Started
- Starting
- Stopped
- Stopping
Resource Dashboard
A default resource dashboard is available for Data Factory resources in the Overview section, allowing for enhanced data visualization and tracking of real-time data.
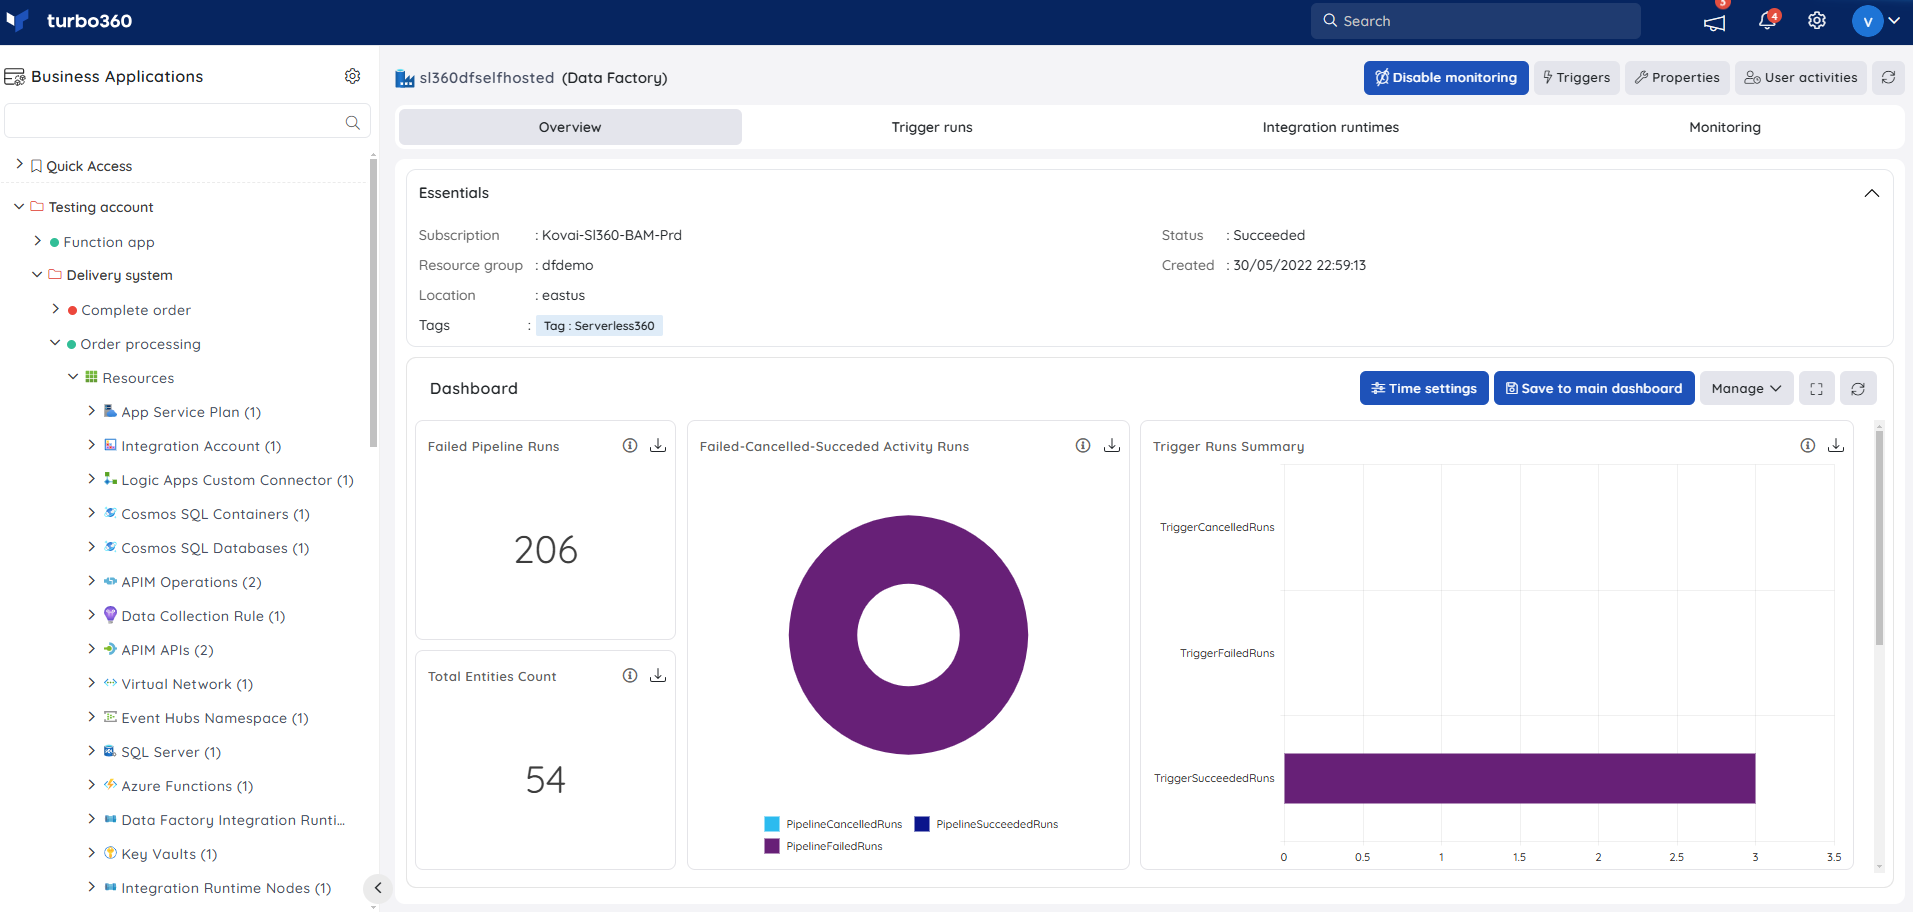
Users are provided with the following pre-defined Dashboard widgets, which can be customised to meet their specific needs.
1. Failed Pipeline Runs
2. Failed-Cancelled-Succeded Activity Runs
3. Trigger Runs Summary
4. Total Entities Count
5. Factory Details
6. SSIS Summary
Monitoring
Availability status monitoring
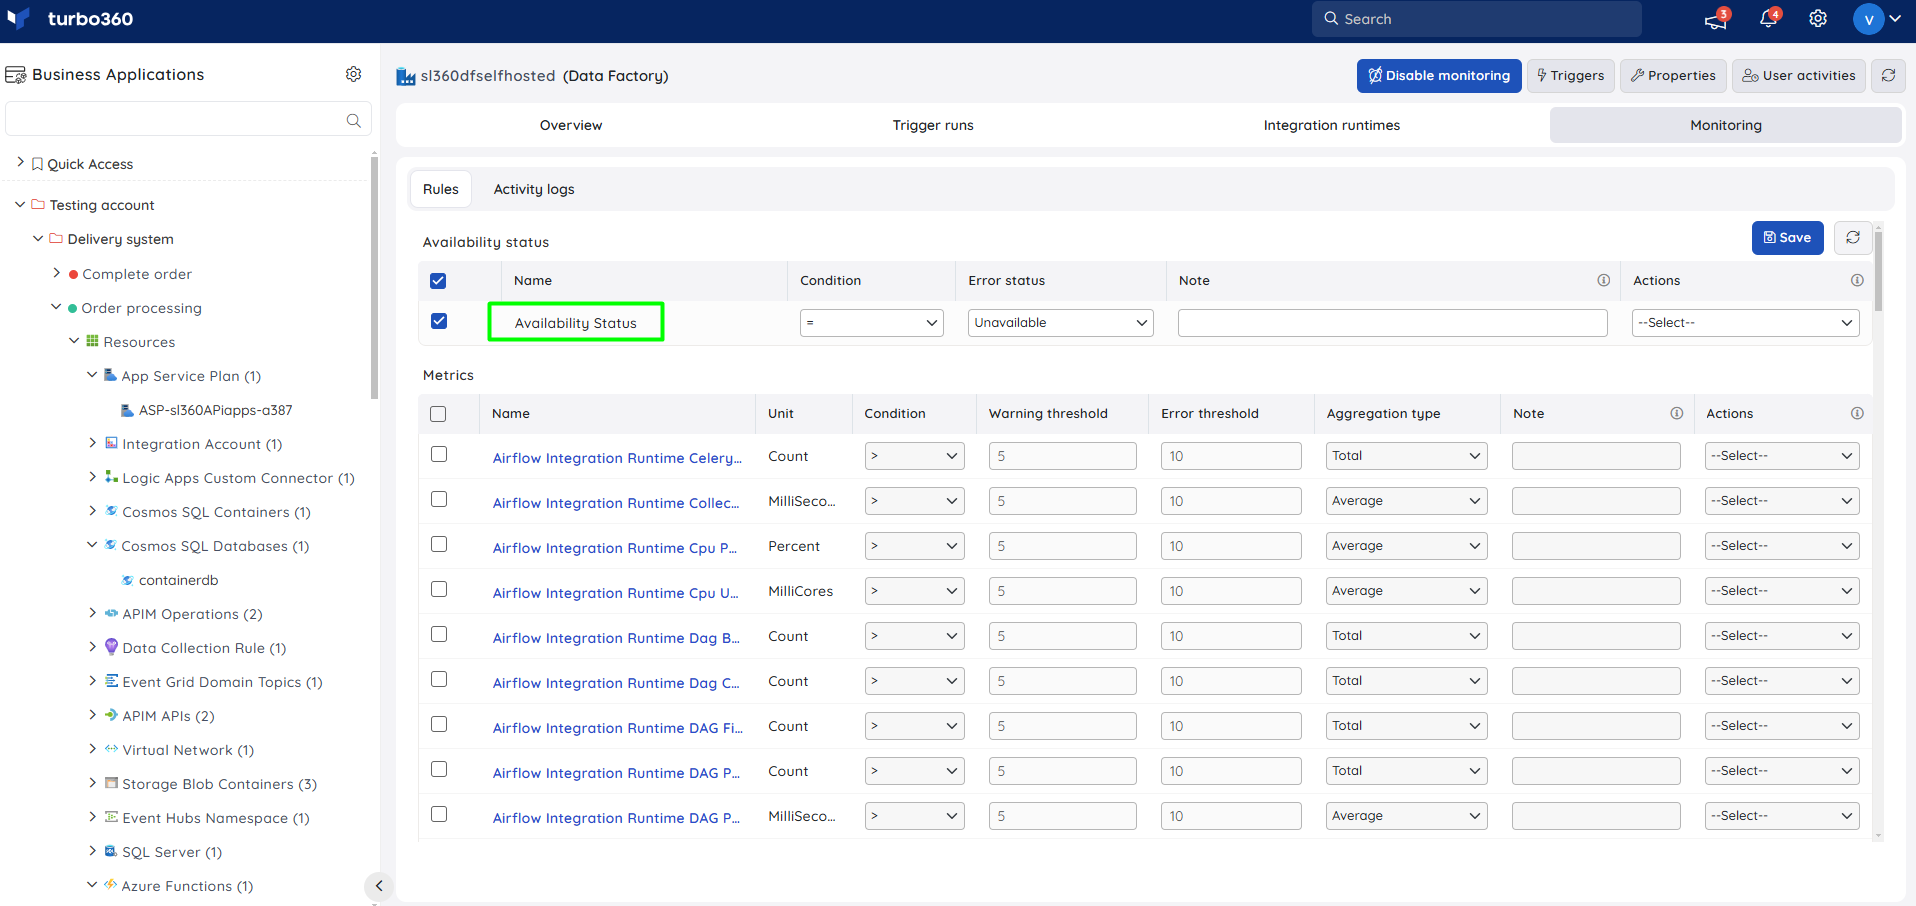
The resource health status of Data Factories can be monitored by using the Availability status rule.
- Navigate to Data Factory -> Monitoring
- Configure Availability status rule with the desired threshold
- Click Save
Metric monitoring
- Navigate to Data Factory -> Monitoring to configure the monitoring rules for Data Factories
- Select the necessary monitoring metrics and configure the threshold values
- Click Save
The threshold values can also be provided with any metric name, defining the monitoring rule to be violated when the metric value configured at threshold field is met.
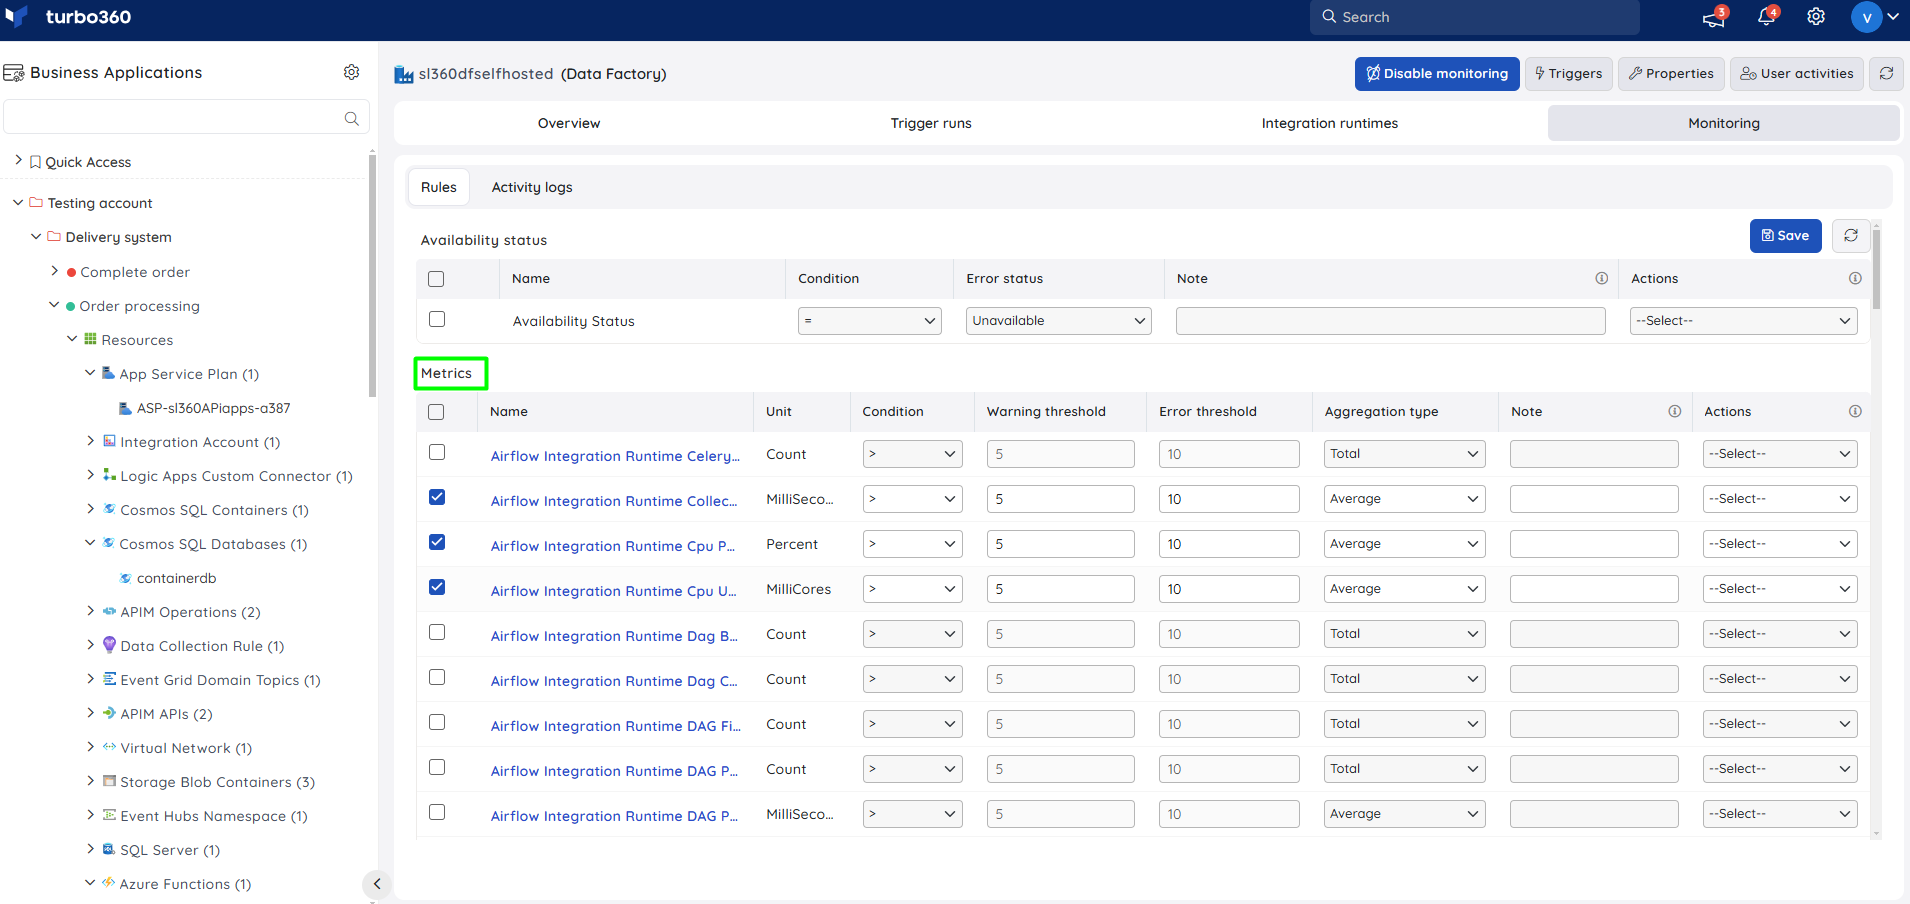
Monitoring rules will be saved for Data Factory, and the monitoring state for the metrics will be reflected after every monitoring cycle.

