Event Hub
- 19 Nov 2024
- 2 Minutes to read
- Print
- DarkLight
- Download PDF
Event Hub
- Updated on 19 Nov 2024
- 2 Minutes to read
- Print
- DarkLight
- Download PDF
Article summary
Did you find this summary helpful?
Thank you for your feedback!
Introduction
Azure Event Hub is a highly scalable data streaming platform and event ingestion service that can receive and process millions of events per second. Events, data, and telemetry generated by distributed software and devices can be processed and stored by Event Hubs.
Any real-time analytics provider or batching/storage adapter can be used to transform and store data sent to an Event Hub.
Event Hubs serve as the on ramp for Big Data because of their ability to provide publish-subscribe capabilities with low latency and at massive scale.
Update status
Users can update the status of the Event Hub resource by clicking on the Update status option and selecting one among the list of available options.
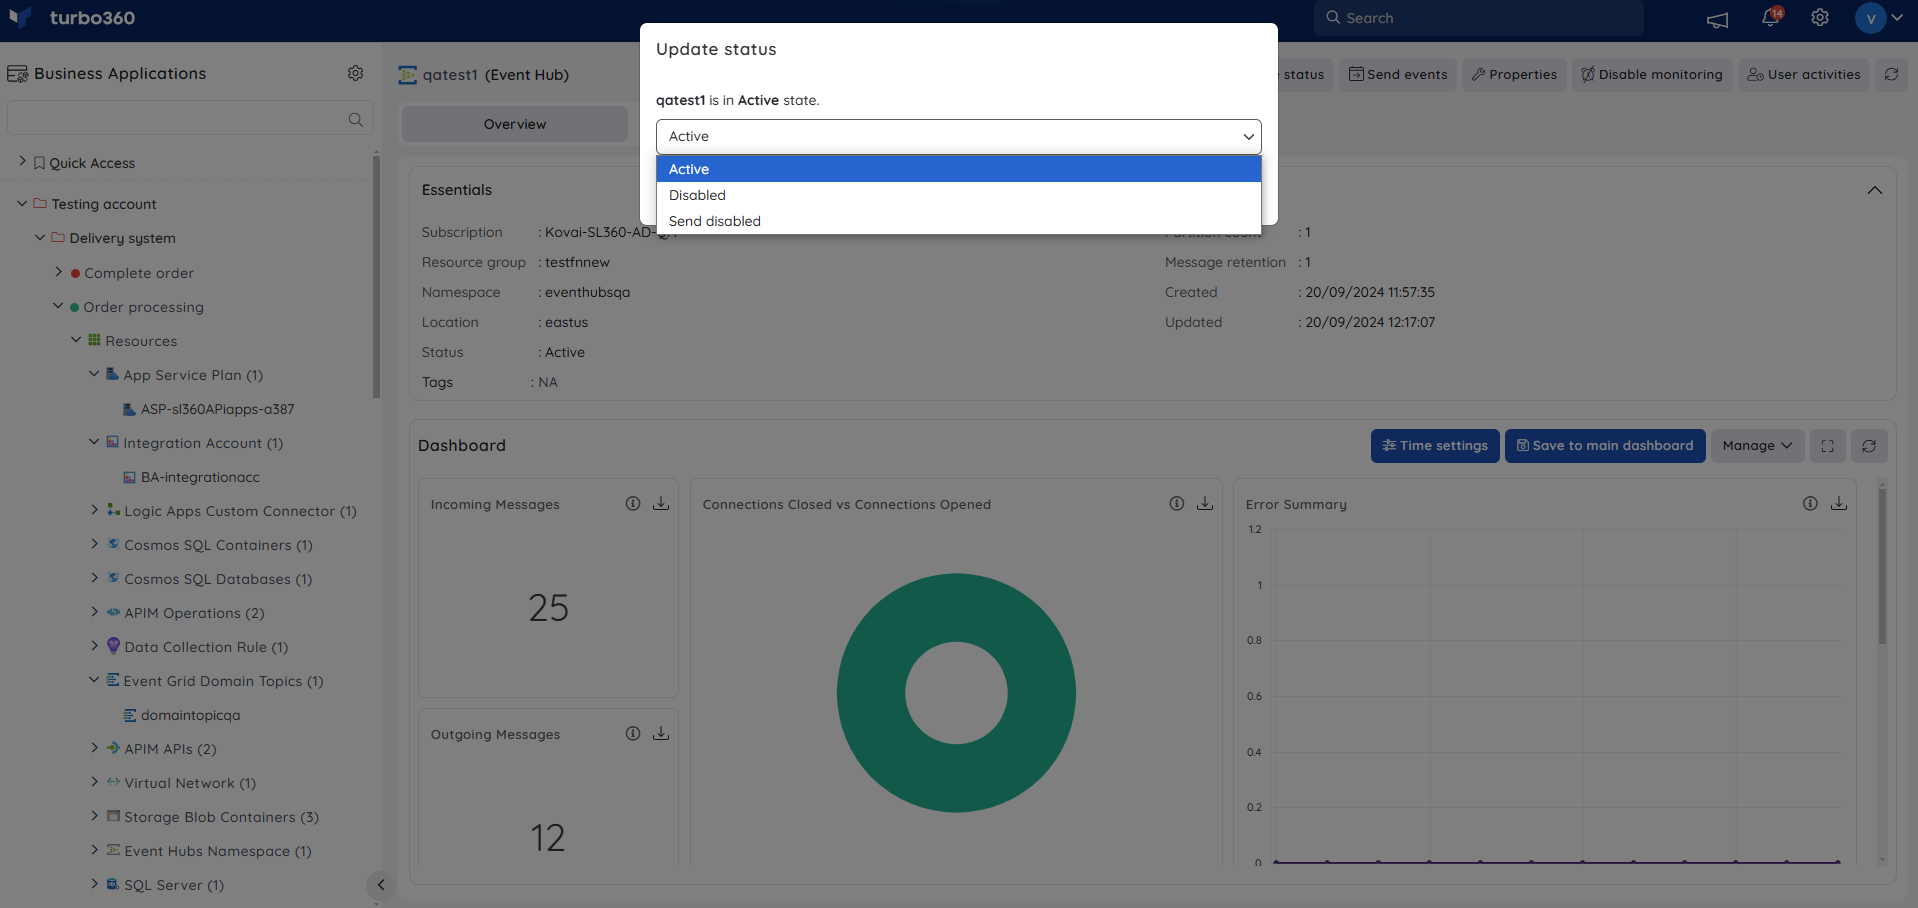
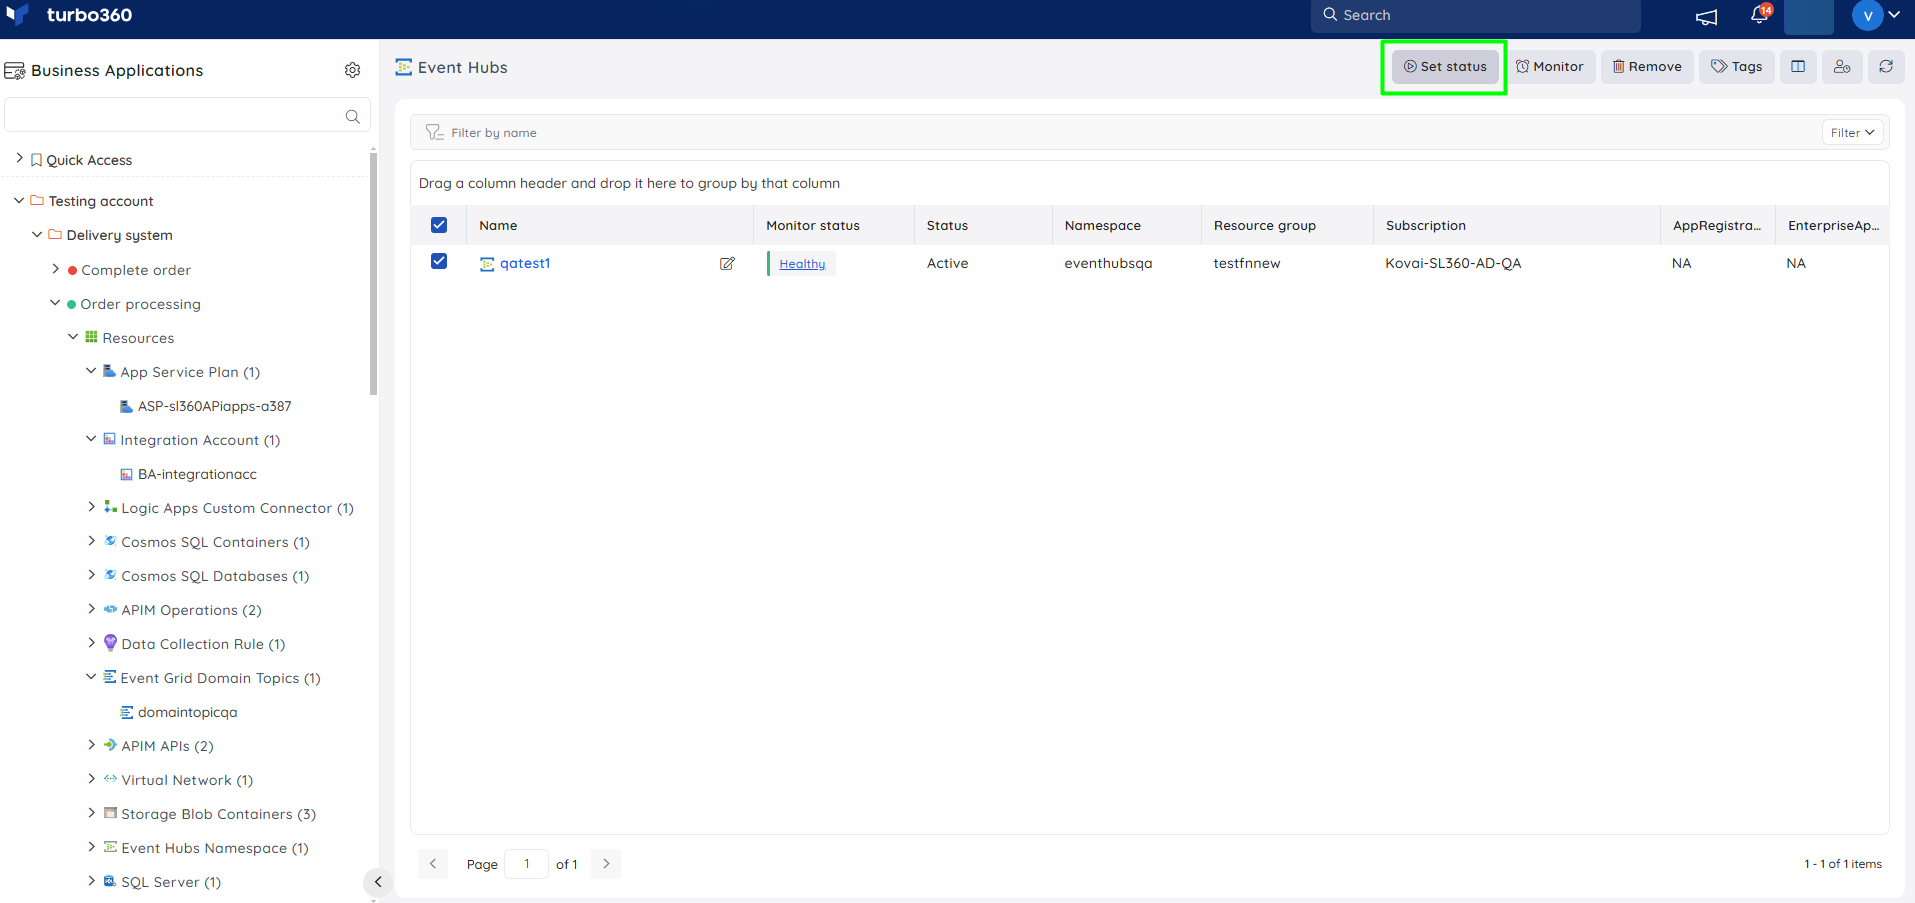
Users can also update status for multiple Event Hubs simultaneously by performing bulk operation in the Event Hub resource section.
Inline task
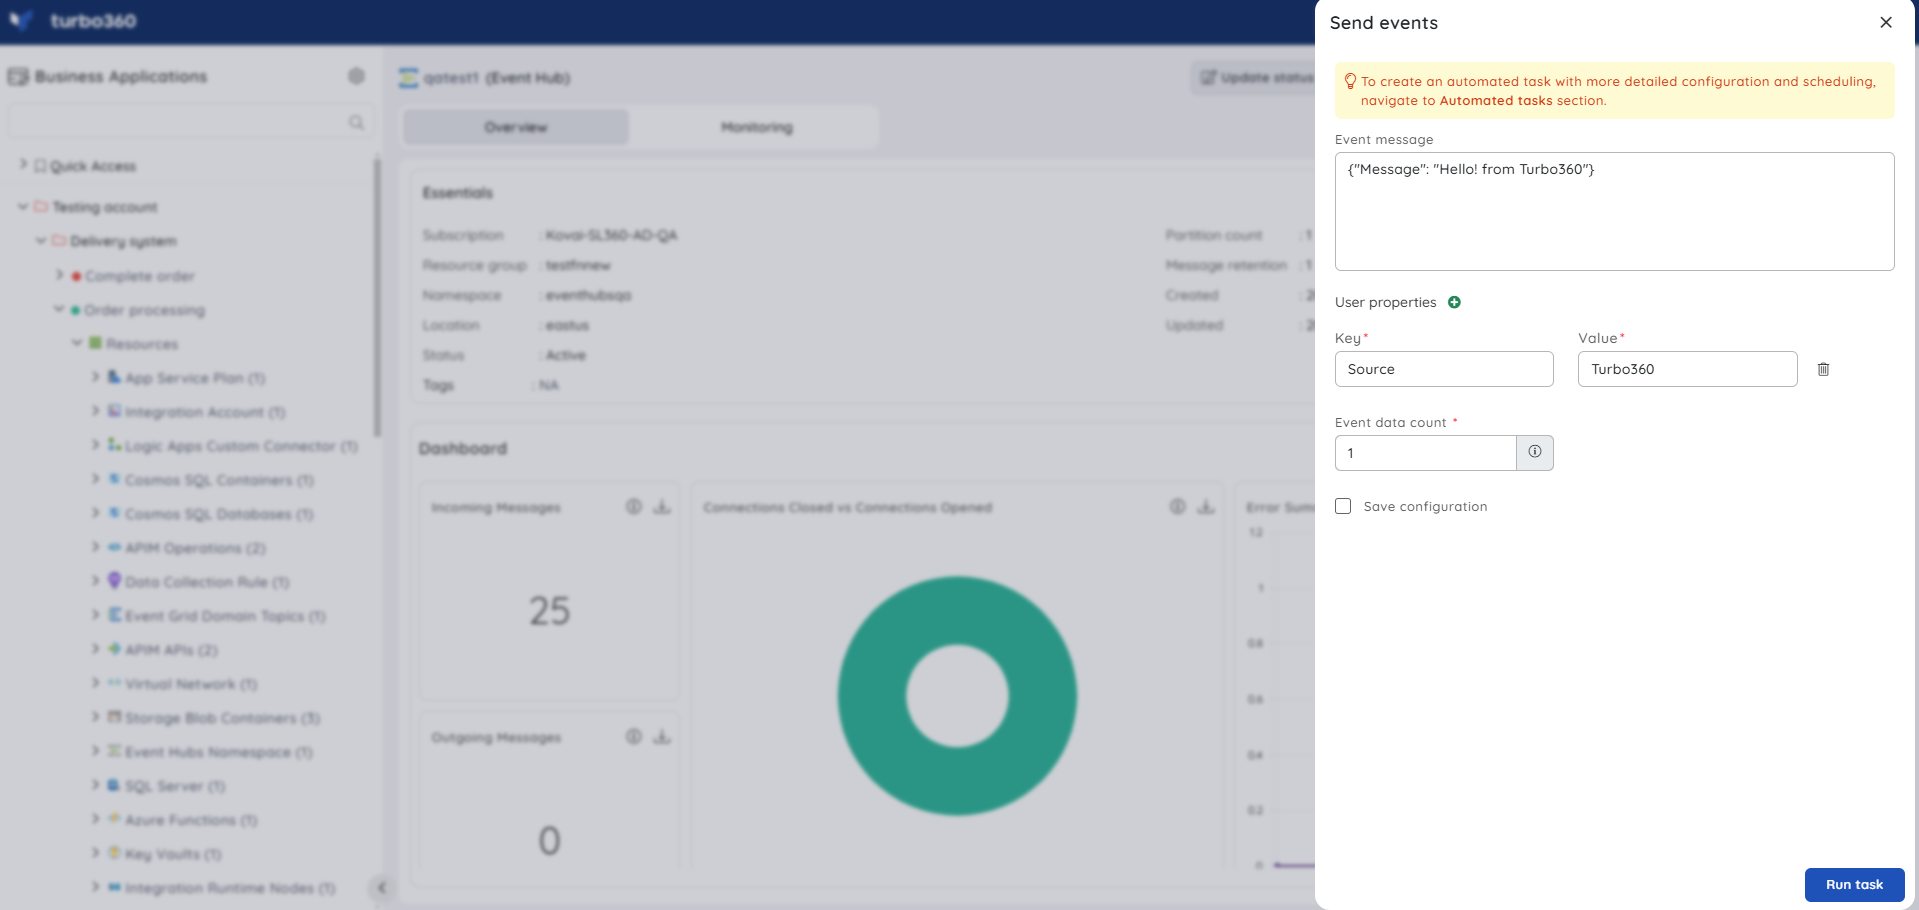
In the Event Hub section, users can create a really quick task to send events from the source Event Hub that is being explored.
The configuration created to run immediately can also be saved for future use in the Automated Tasks section.
Inline task to send events
This feature allows users to quickly send events to Event Hub by providing the following inputs:
- Event message
- Key
- Value
- Event data count
- Configuration name (if Save configuration is enabled)
Task status can be viewed by navigating to the Automated Tasks section and switching to the Task history tab.
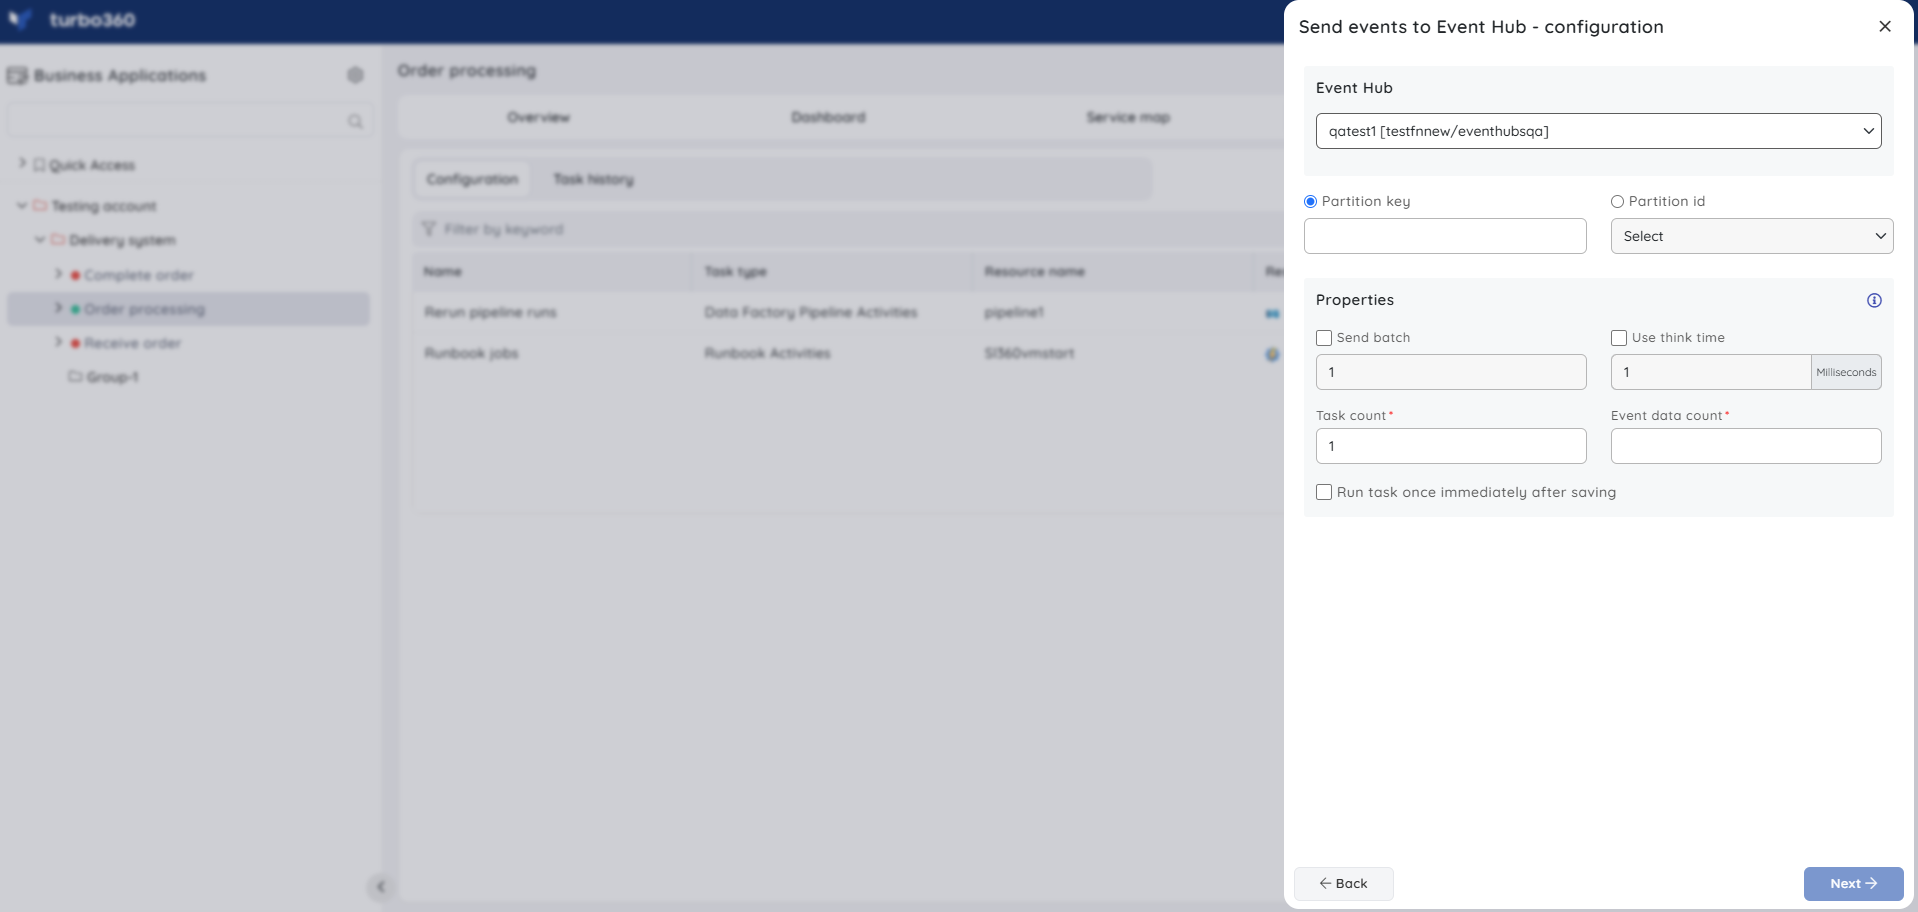
Automated task
Consider a scenario in which a single Azure Subscription contains multiple Event Hubs, and the customer wants to send events to the desired Event Hub.
The Automated Task feature of Turbo360 makes it possible to accomplish such scenarios.
Resource Dashboard
A default resource dashboard is available for Event Hub resources in the Overview section, allowing for enhanced data visualization and tracking of real-time data.
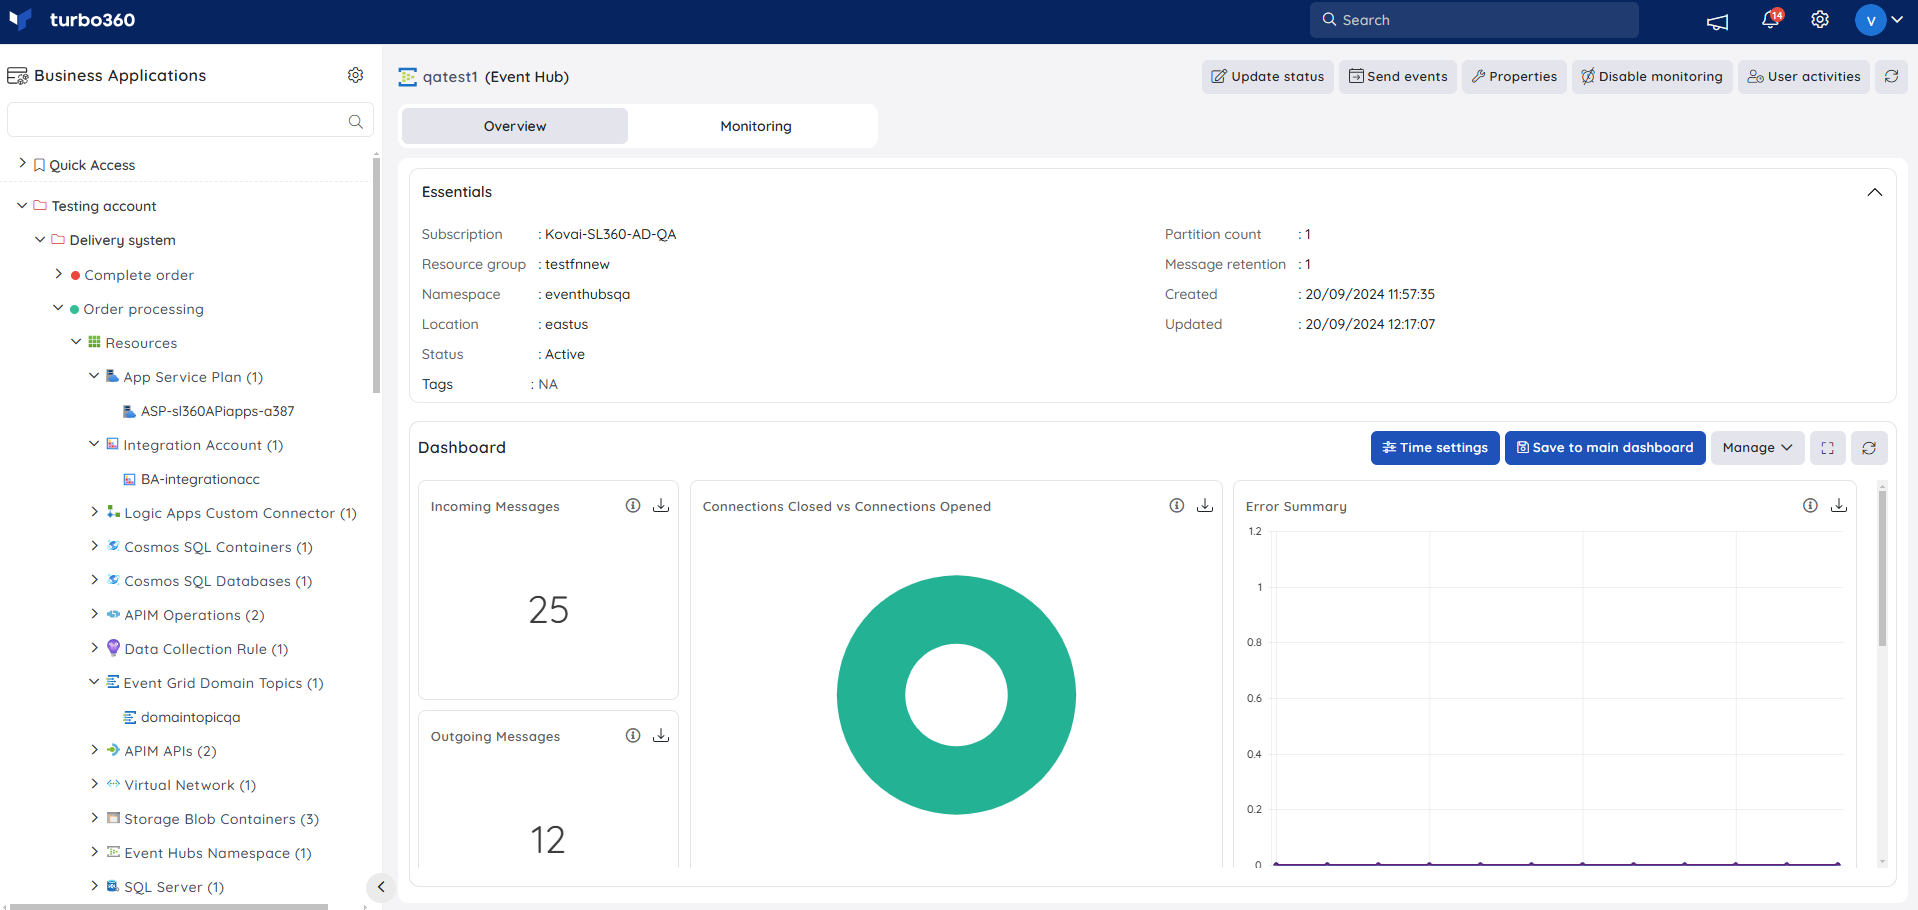
Users are provided with the following pre-defined Dashboard widgets, which can be customised to meet their specific needs.
1. Incoming Messages
2. Connections Closed vs Connections Opened
3. Error Summary
4. Outgoing Messages
5. Incoming and Outgoing Summary
6. Event Hub Summary
Monitoring
- Navigate to Event Hub -> Monitoring to configure the monitoring rules for Event Hubs
- Select the necessary monitoring metrics and configure the threshold values
- Click Save
The threshold values can also be provided with any metric name, defining the monitoring rule to be violated when the metric value configured at threshold field is met.
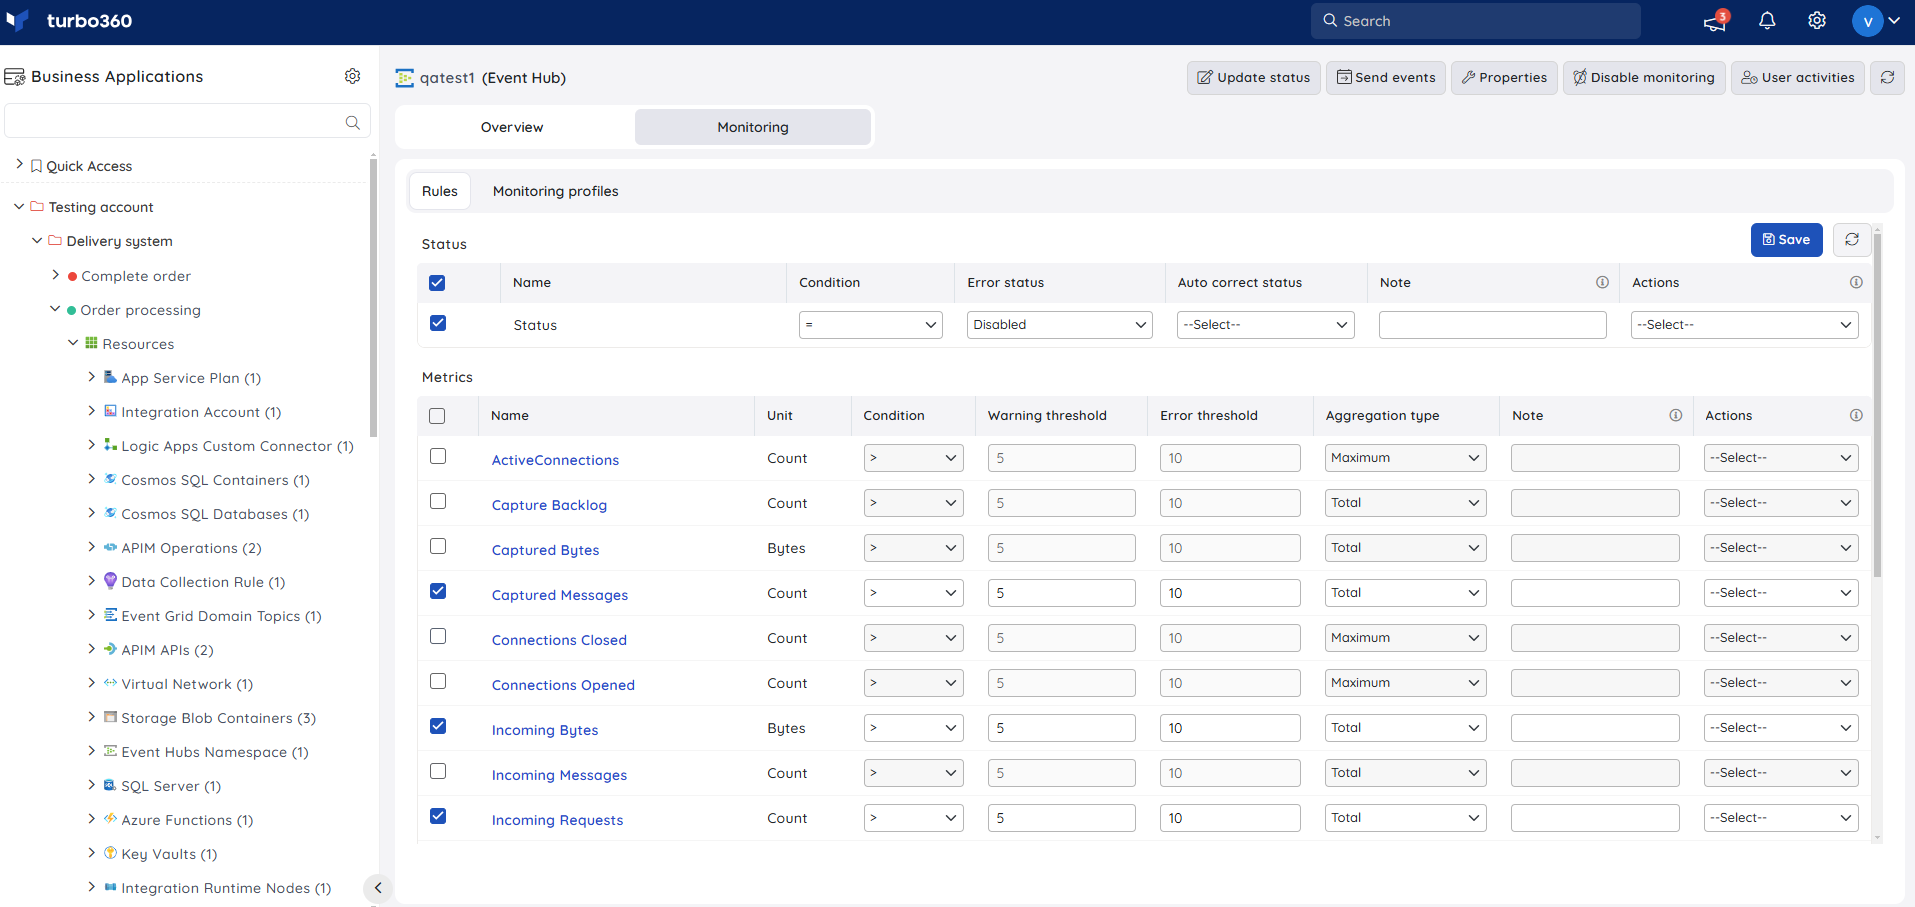
Monitoring rules will be saved for Event Hub, and the monitoring state for the metrics will be reflected after every monitoring cycle.
Was this article helpful?