

Explain with AI in Analysis
- 24 Jun 2026
- 1 Minute to read
- Print
- DarkLight
- Download PDF
Explain with AI in Analysis
- Updated on 24 Jun 2026
- 1 Minute to read
- Print
- DarkLight
- Download PDF
Article summary
Did you find this summary helpful?
Thank you for your feedback!
Overview
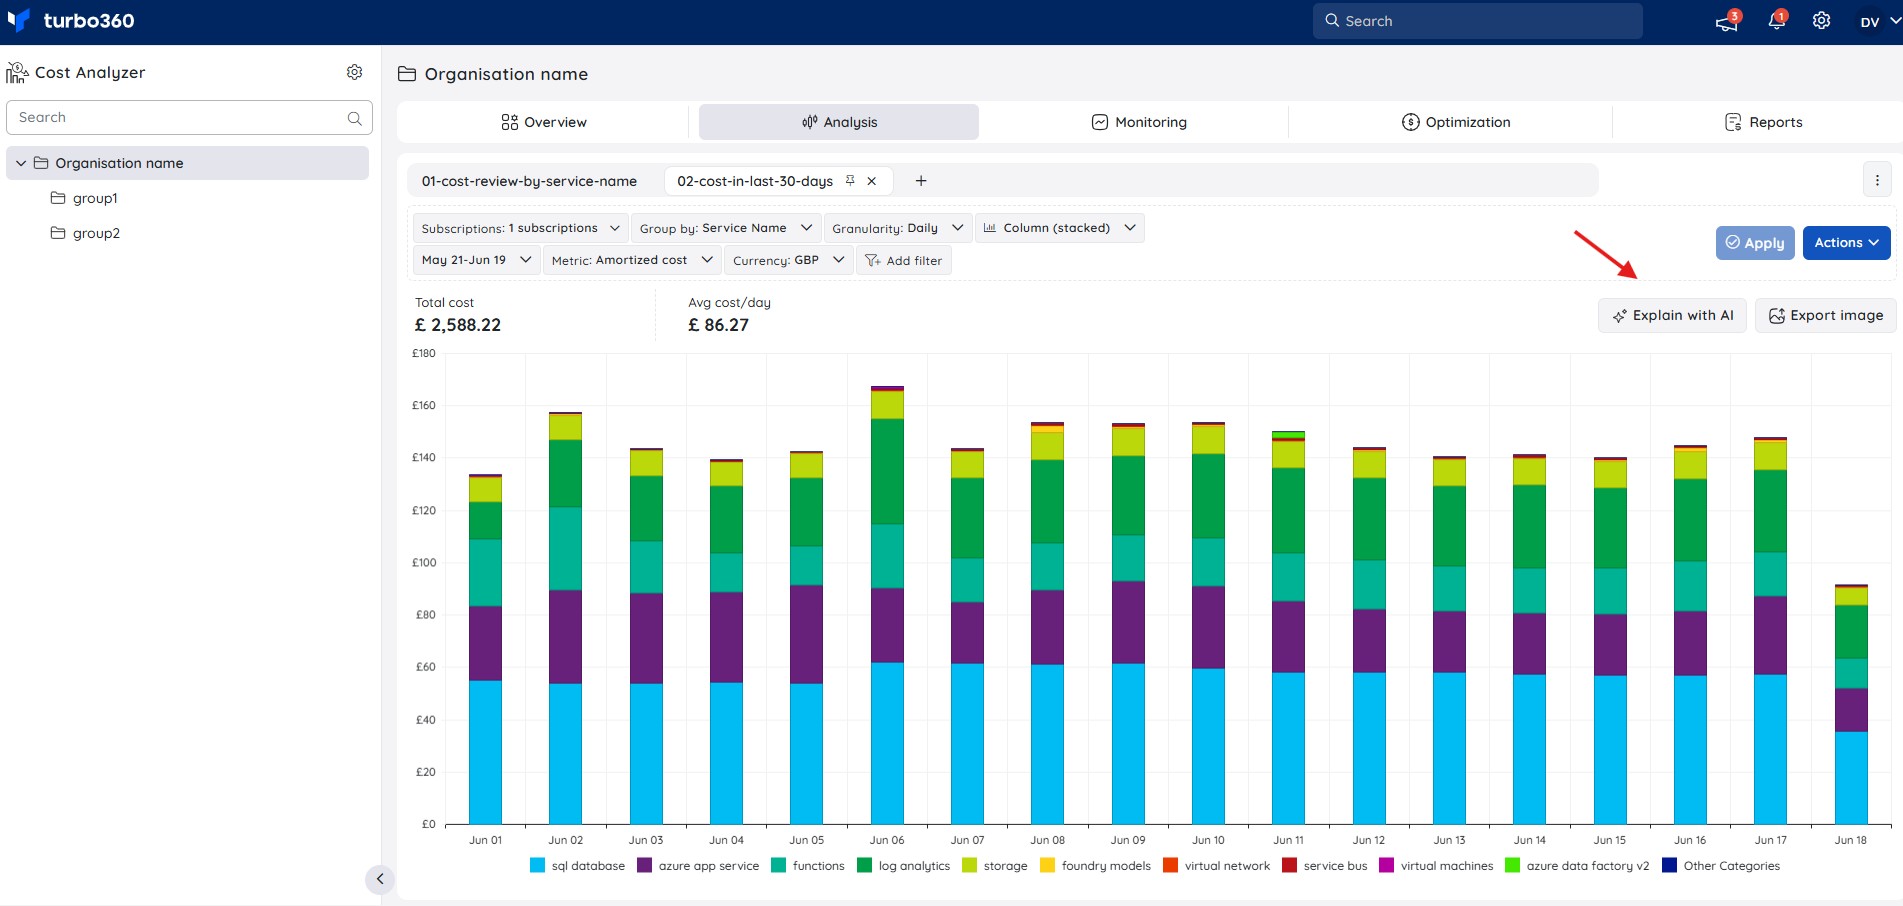
The Analysis view in Cost Analyzer includes a built-in AI capability, Explain with AI, that generates a structured breakdown of the chart data — covering cost drivers, spend patterns, anomalies, and optimization opportunities.
How to use
- Navigate to Cost Analyzer → Analysis.
- Open or configure a chart view for the desired subscription and date range.
- Click the Explain with AI button on the top-right corner of the chart.
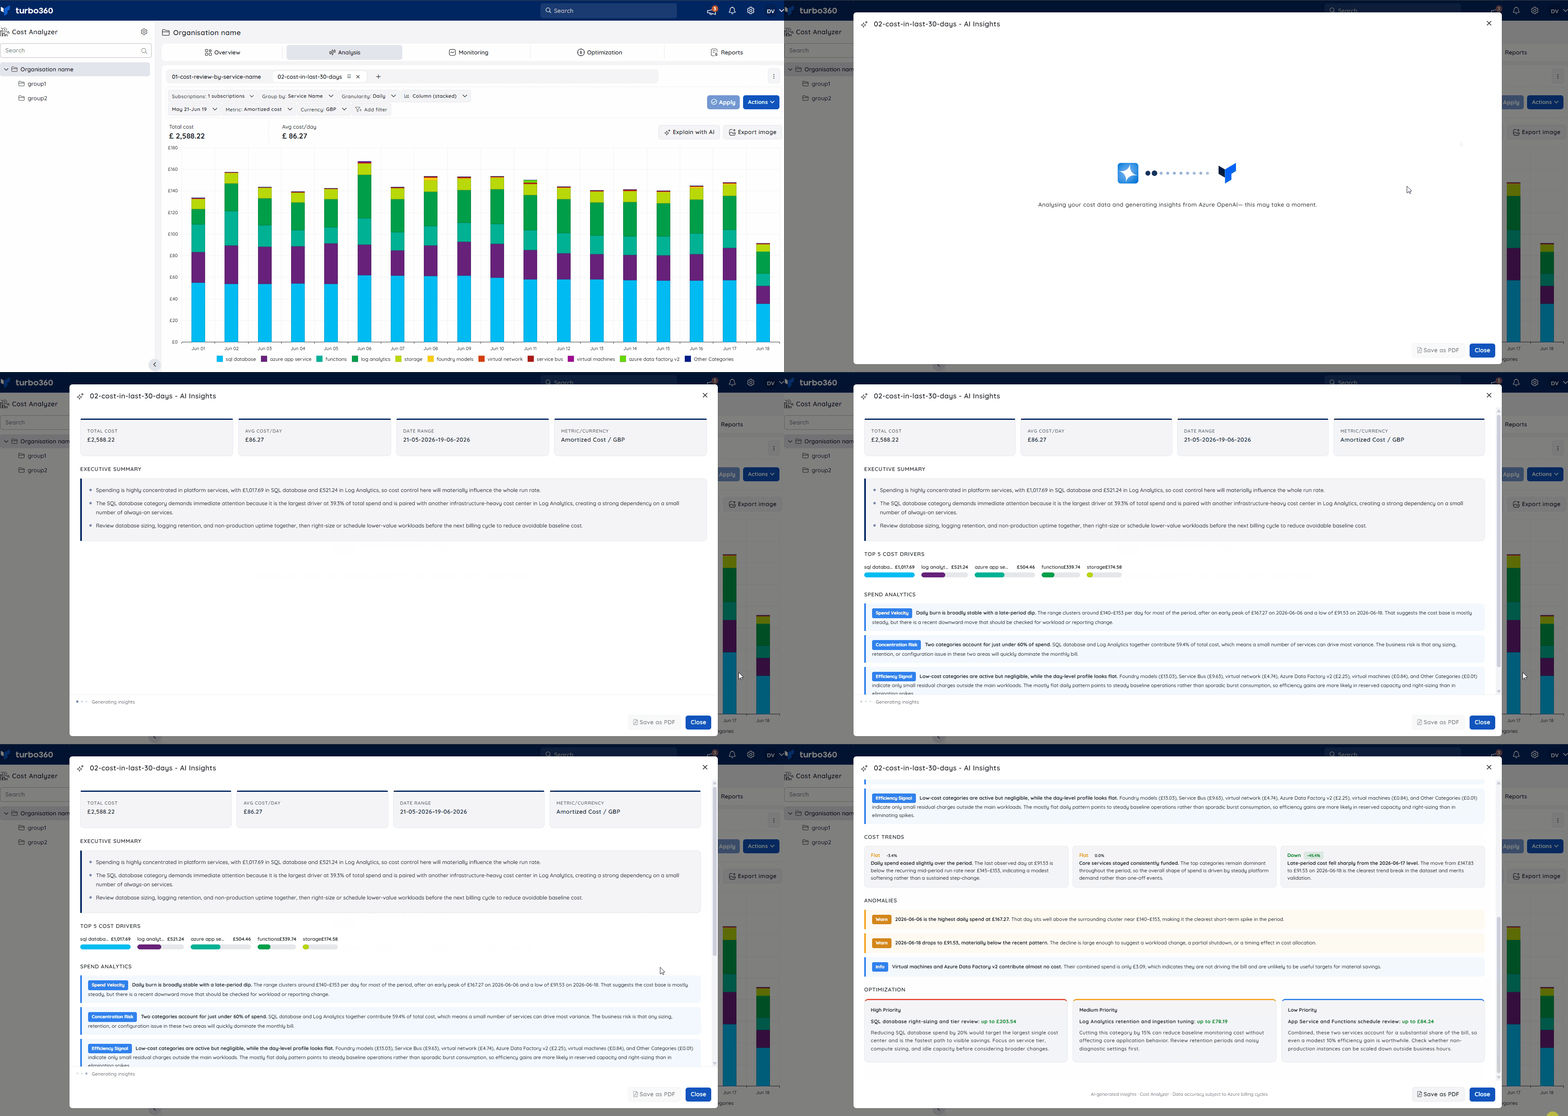
- The AI Insights panel opens with a full analysis of the current chart data
Insight breakdown
1. Executive Summary
A concise overview of the dominant spending categories, the largest cost lever, and the most impactful area to prioritize.
2. Top 5 Cost Drivers
The five highest-spend categories ranked by total cost, with a proportional bar for quick comparison
3. Spend Analytics
- Spend Velocity — daily burn rate pattern across the period.
- Concentration Risk — flags when few categories drive a disproportionate share of cost.
- Efficiency Signal — highlights near-zero or always-on services that may indicate idle resources.
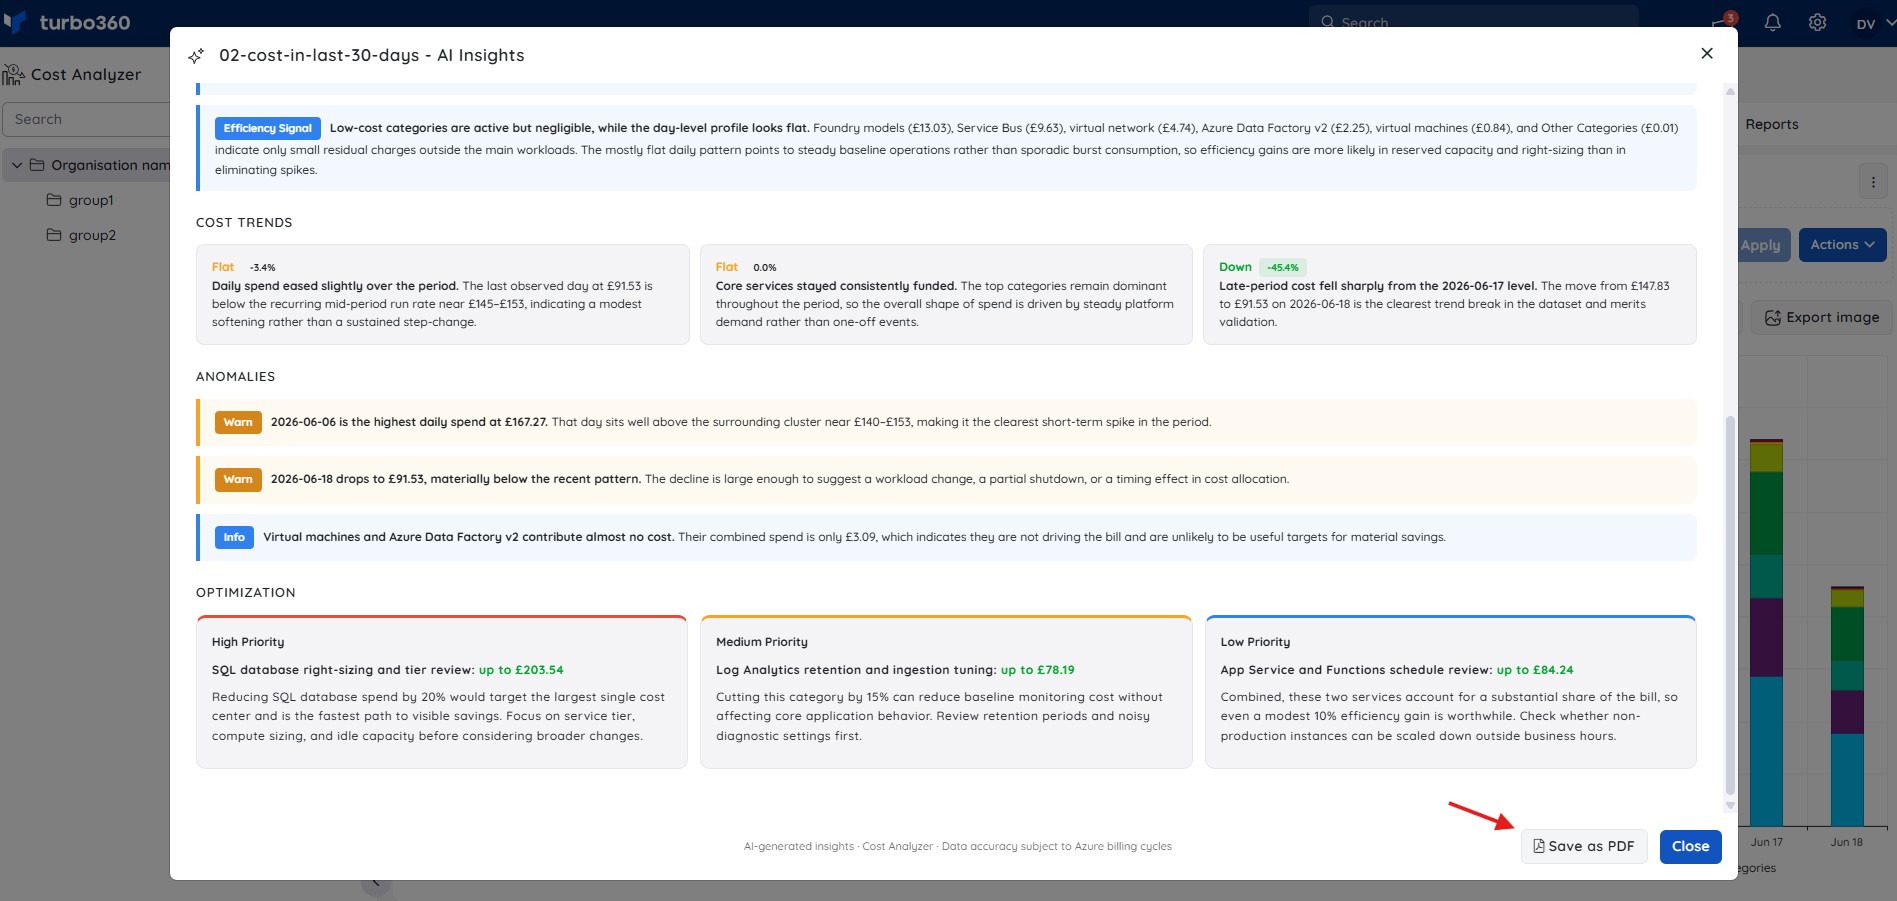
4. Cost Trends
Directional patterns across the date range using labeled trend cards — Stable, Peak Pressure, or similar — with a percentage change and brief explanation.
5. Anomalies
Notable deviations from baseline spend — spikes, unexpected drops, or low-activity categories — with context on possible causes.
6. Optimization
Prioritized recommendations across High, Medium, and Low Priority, each with an estimated monthly reduction.
Export
The full AI Insights report can be saved using the Save as PDF button at the bottom of the panel.
Was this article helpful?