- 19 Nov 2024
- 3 Minutes to read
- Print
- DarkLight
- PDF
Log Analytics Workspace
- Updated on 19 Nov 2024
- 3 Minutes to read
- Print
- DarkLight
- PDF
Introduction
Log Analytics Workspace is a logical storage unit in Azure that stores all log data from Azure Monitors. Azure Log Analytics Workspace simplifies the management of log data collected from various data sources such as Azure Virtual Machines.
Azure log analytics can be used to query and retrieve data from multiple monitor logs that meet certain criteria to provide better insights of the data.
Queries
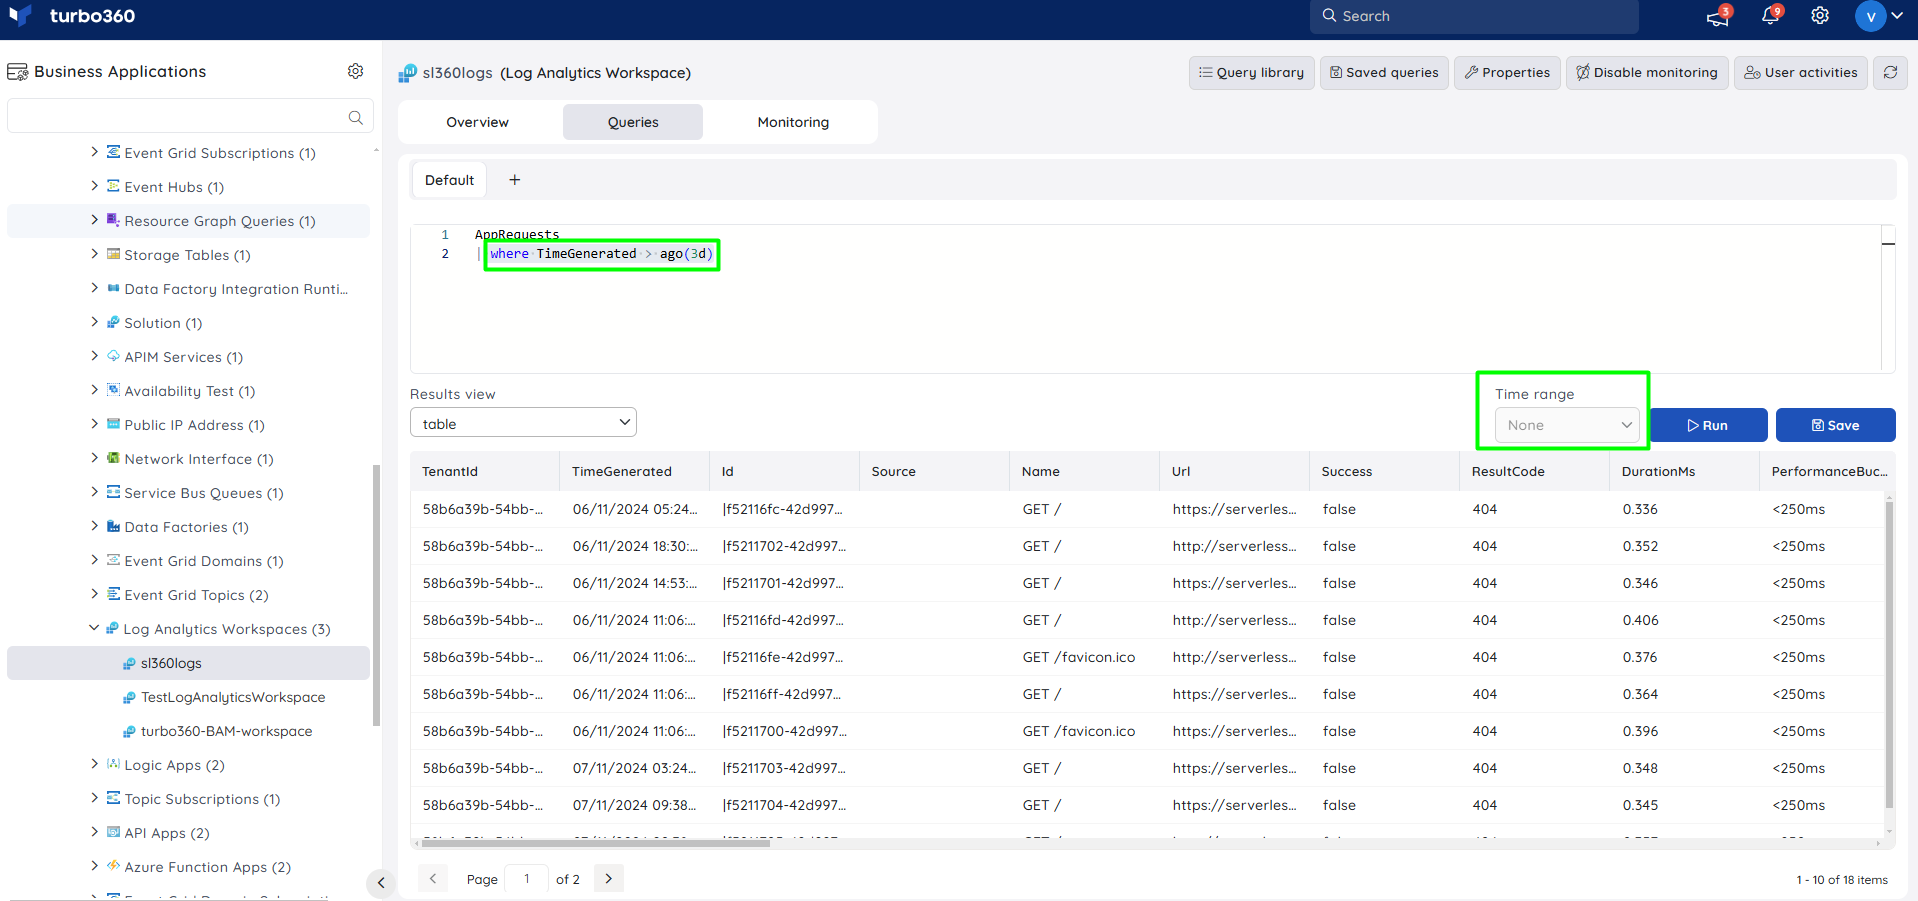
The Queries section in the Log Analytics Workspace resource offers a number of Query-related operations.
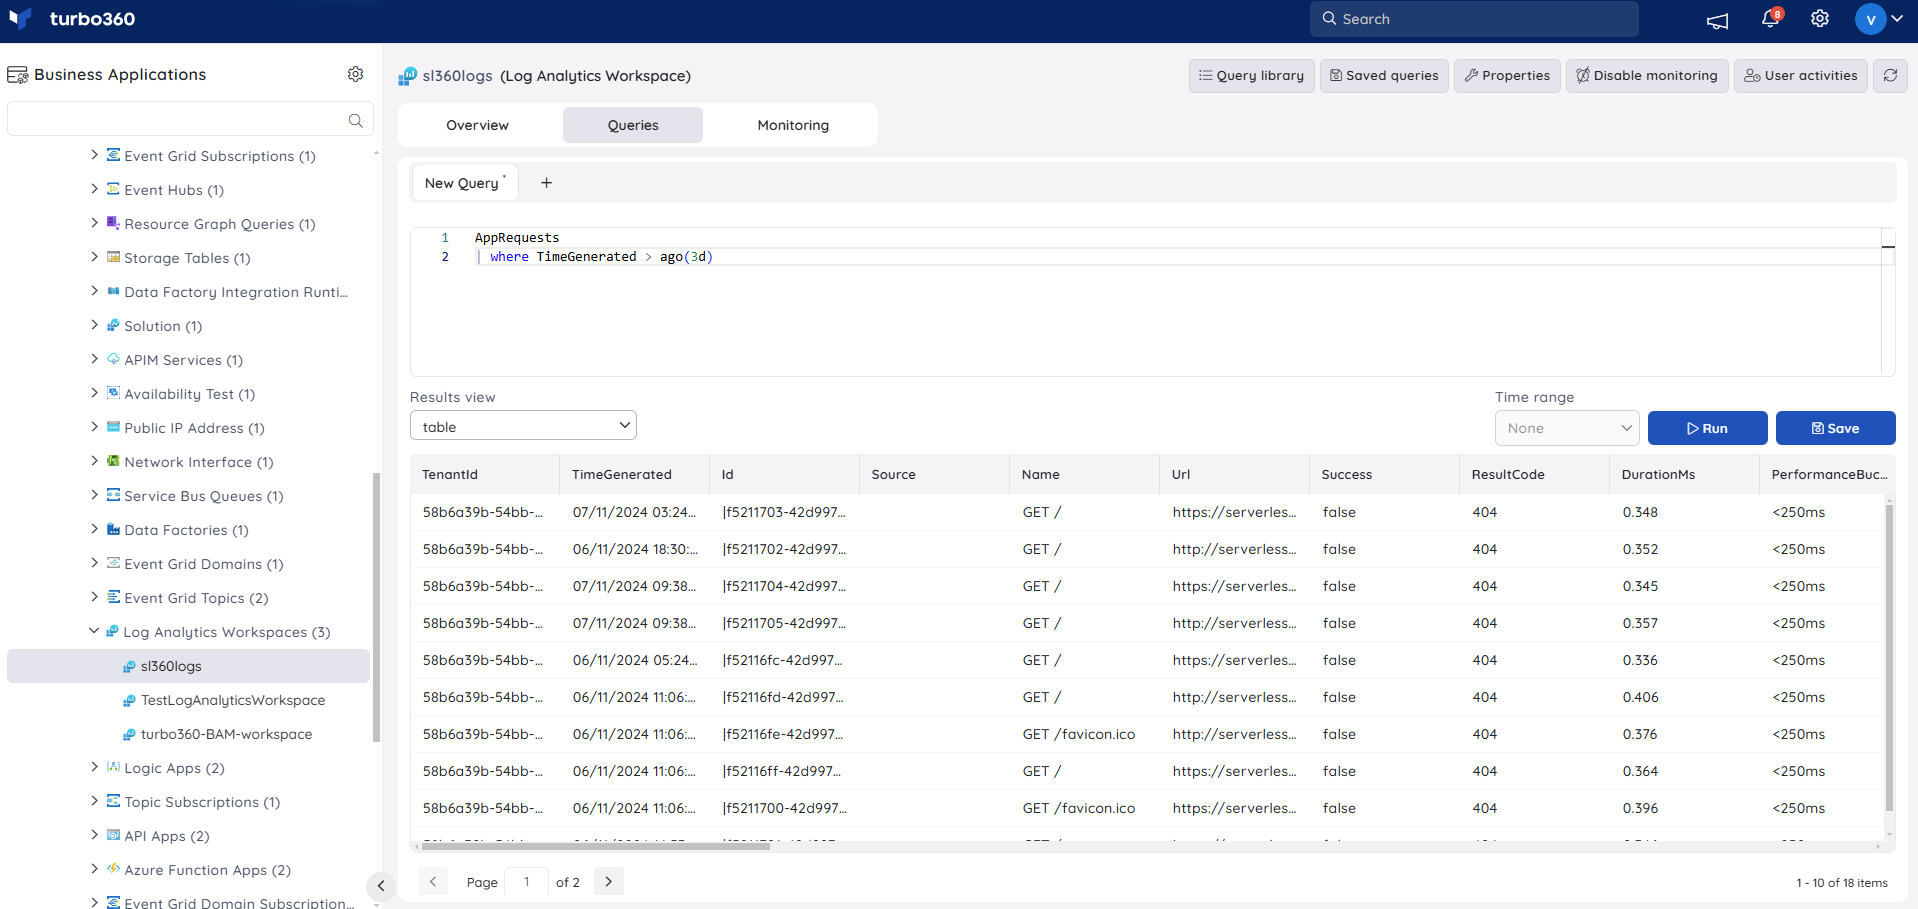
Users can write a query in the Query field to generate query data that meets their needs.
The Query data can be viewed in any of the available formats:
- table
- line
- bar
- column
- donut
- area
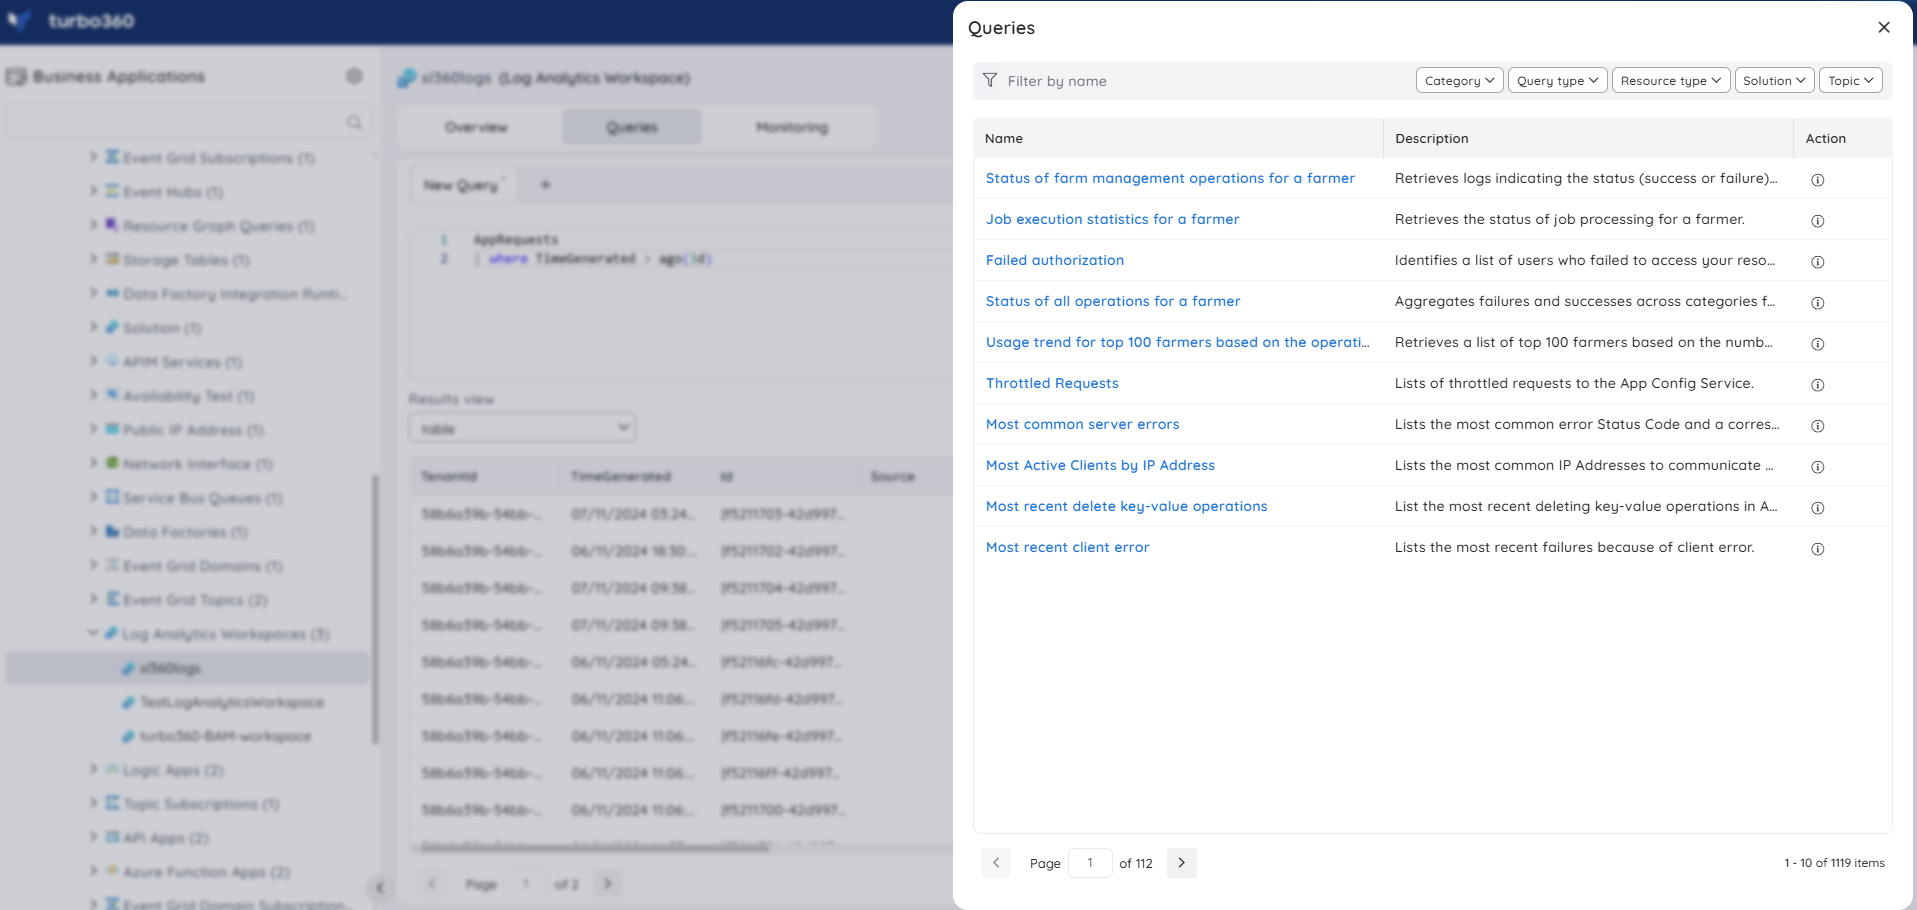
The Query library option in the Execute Queries section allows users to access the preset queries from the Azure portal directly in Turbo360. Users can easily add any of those queries to their Saved queries by using the Save icon found on each query.
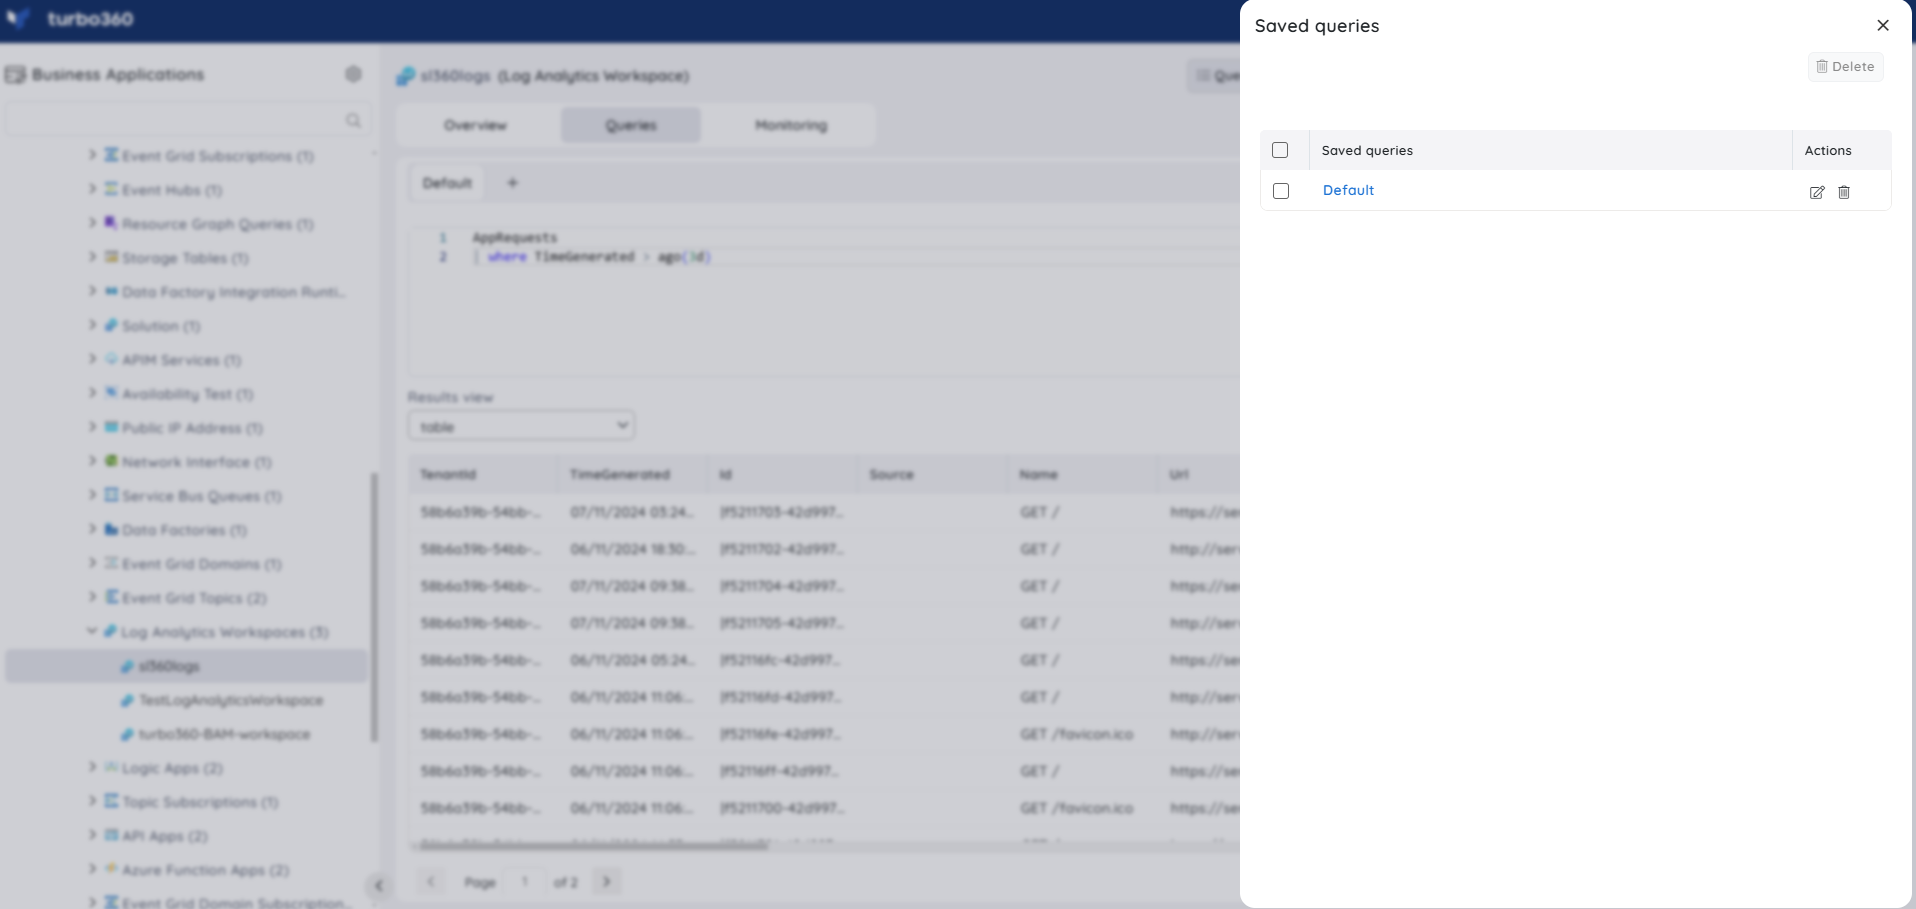
The Saved queries option in the Queries tab allows users to access all the saved queries and easily generate Query data. Users can also edit their saved queries and update the favorite query.
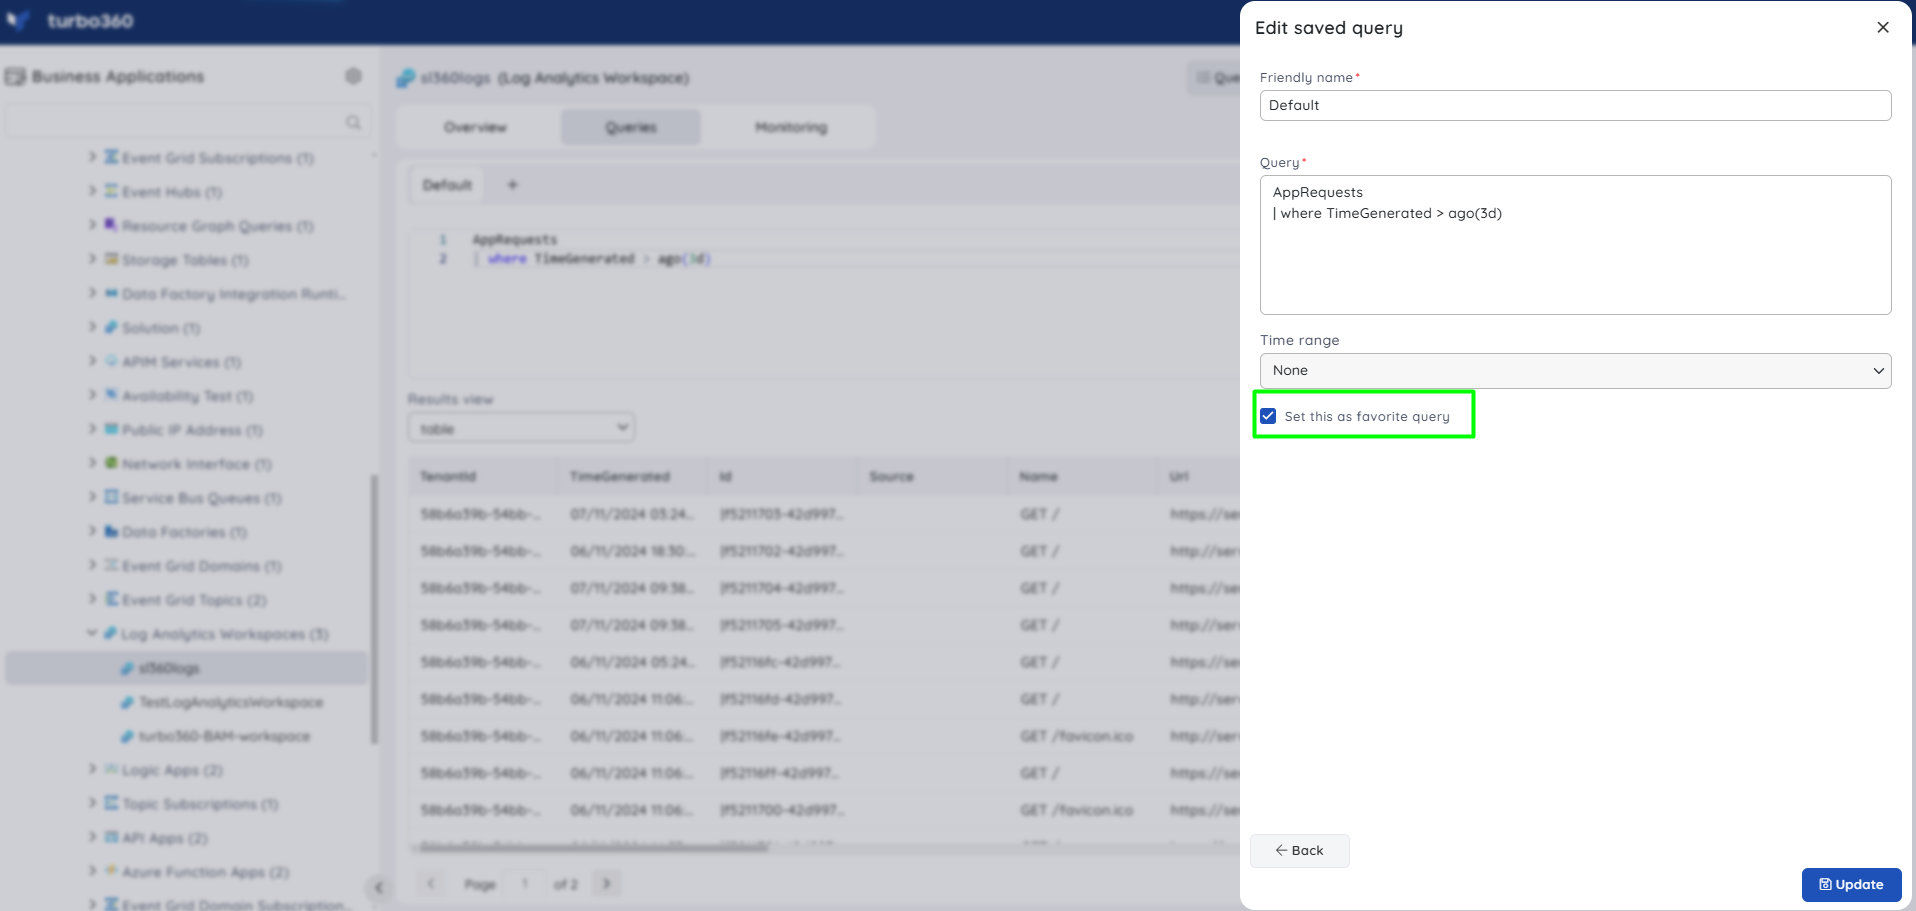
A Favorite query is one that is automatically available in the Queries tab. To mark a query as a favorite, simply edit a saved query or save a new one.
Time range
A time range filter can be applied to the queries to retrieve the subset of required data. The time can be provided in the query or by choosing from the time range filter.
Resource Dashboard
A default resource dashboard is available for Log Analytics Workspace resources in the Overview section, allowing for enhanced data visualization and tracking of real-time data.
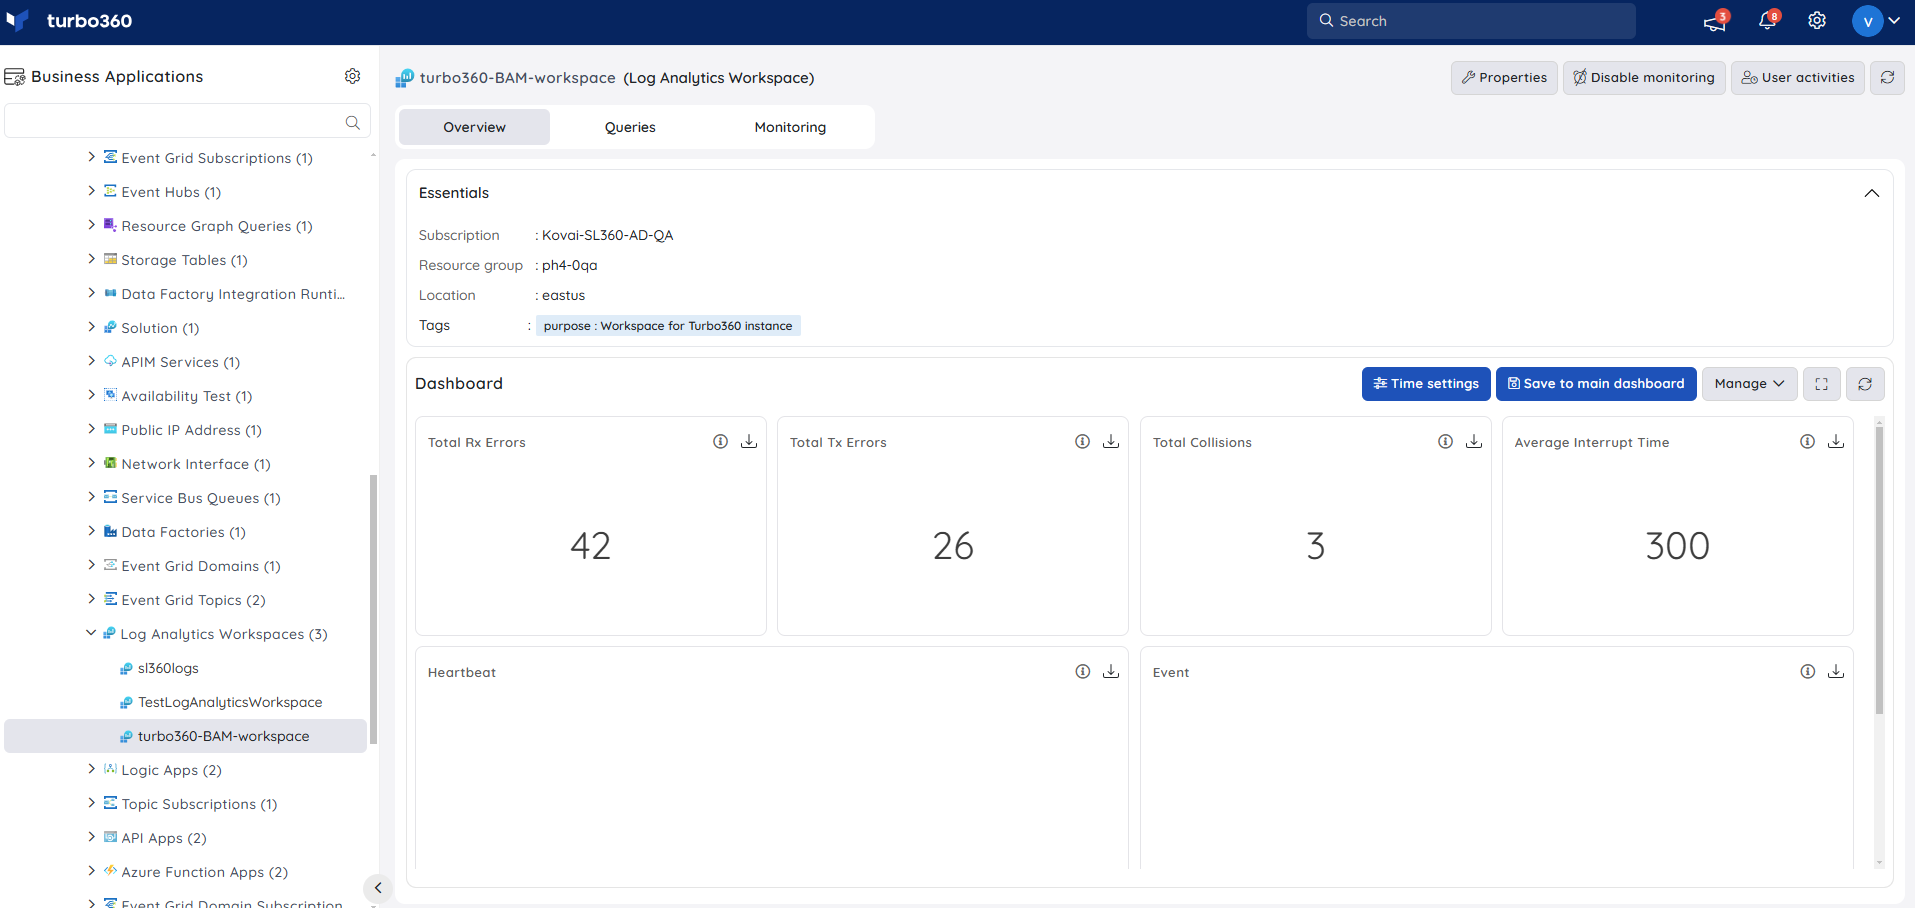
Users are provided with the following pre-defined Dashboard widgets, which can be customized to meet their specific needs.
1. Total Rx Errors
2. Total Tx Errors
3. Total Collisions
4. Average Interrupt Time
5. Heartbeat
6. Event
Query Widgets
Queries can also be used to generate real-time data in Dashboard widgets to provide a more personalized user experience.
Query widgets can be added to both the Business Application and the Resource Dashboard when the Data source value for the Log Analytic Workspace resource is set to Query in widget configuration.
In the query field, type a valid query and hit the Run button. Selecting the appropriate data label from the Y-axis dropdown and the X-axis checkboxes allows users to customize the values that appear on the x and y-axis.
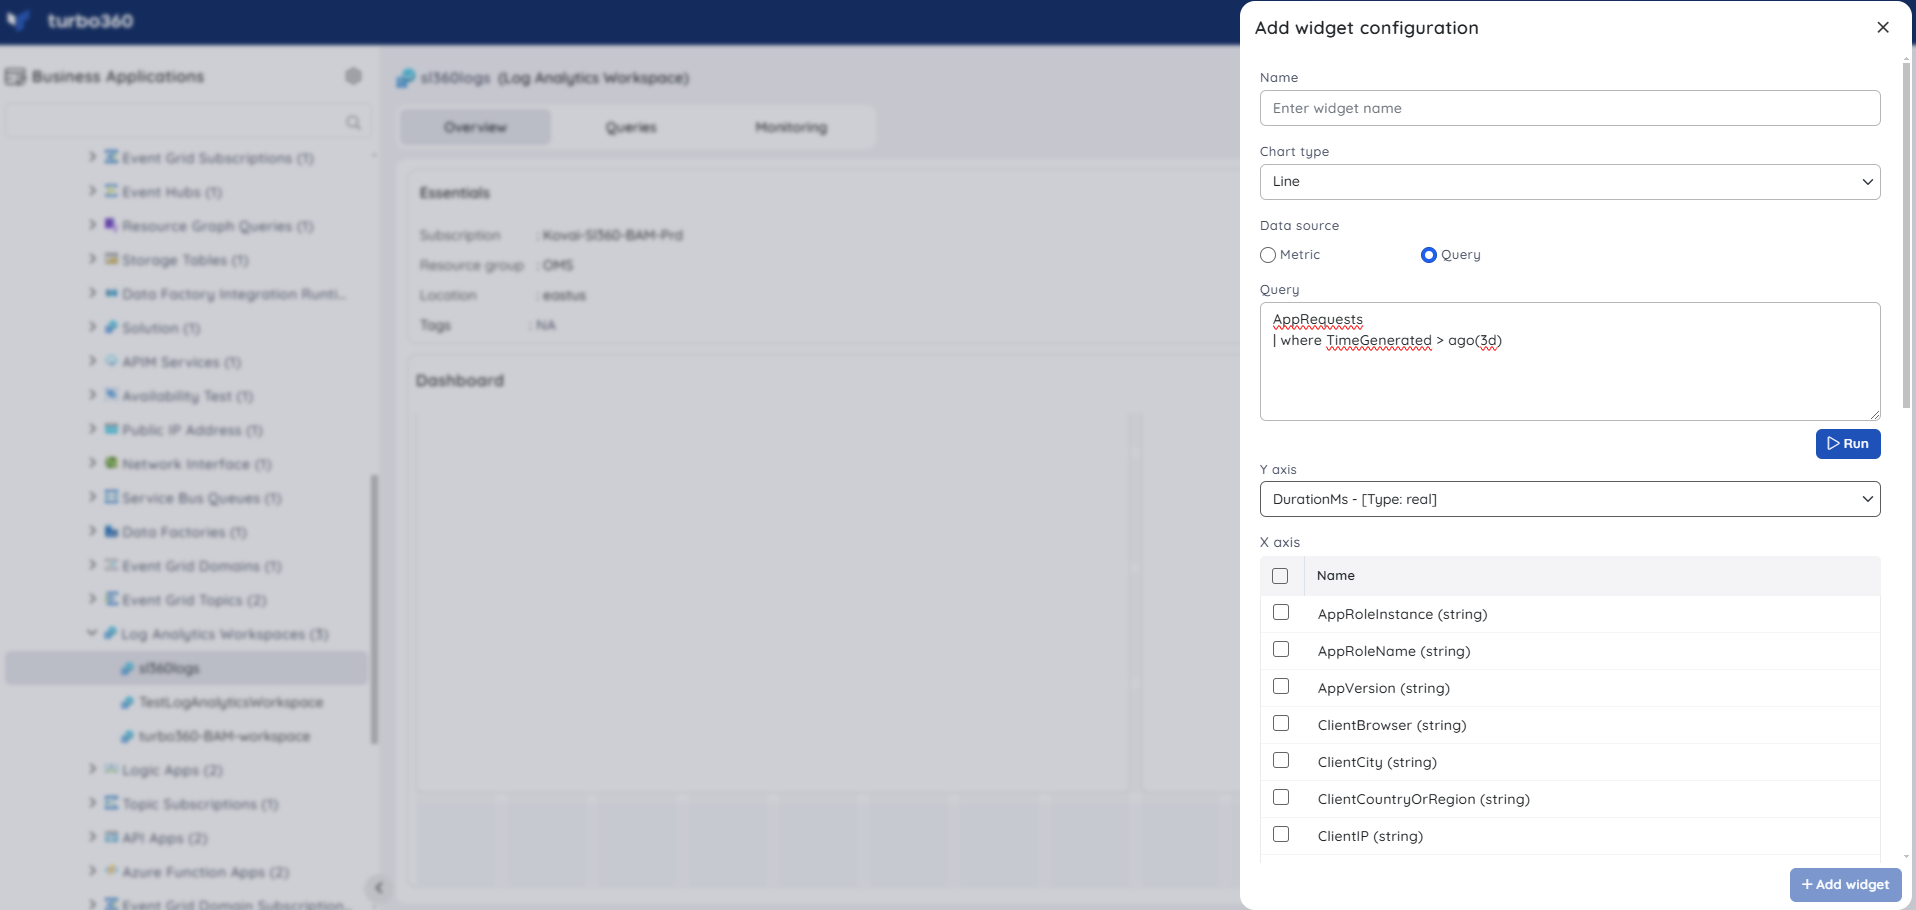
Query widgets do not display time settings information in their tooltip because the data is generated only for the desired query, regardless of time settings configuration.
Count charts do not support Query data sources.
Monitoring
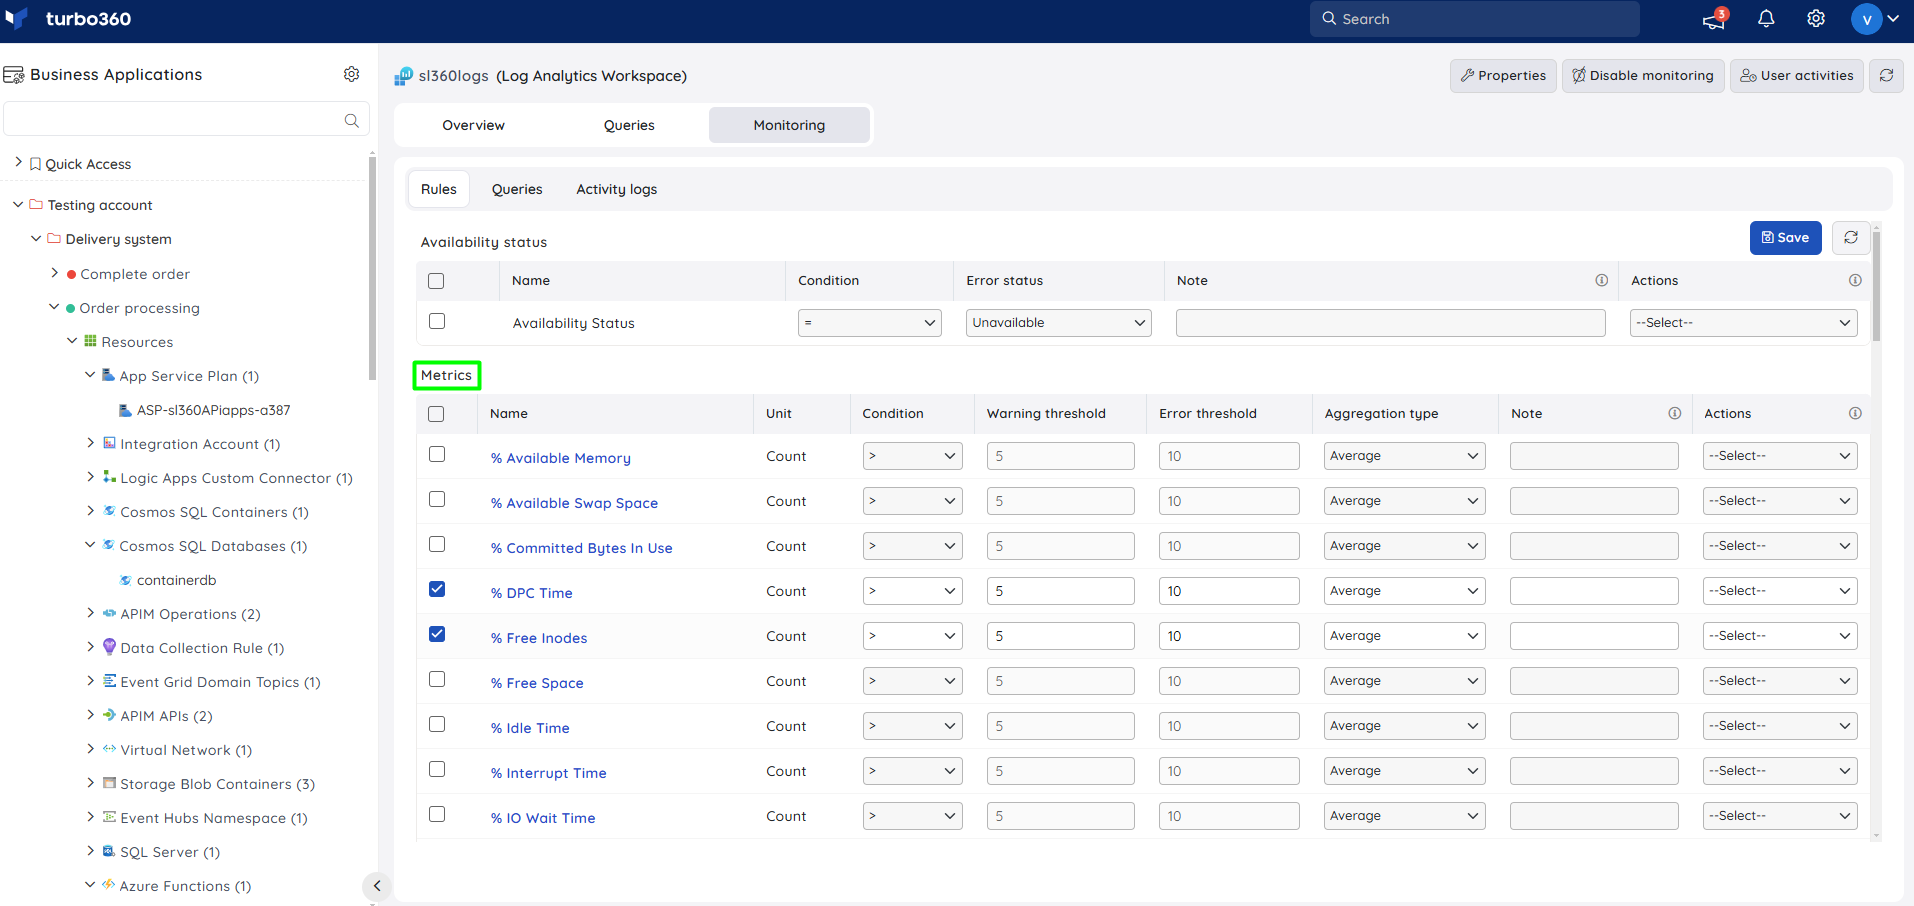
Availability status monitoring
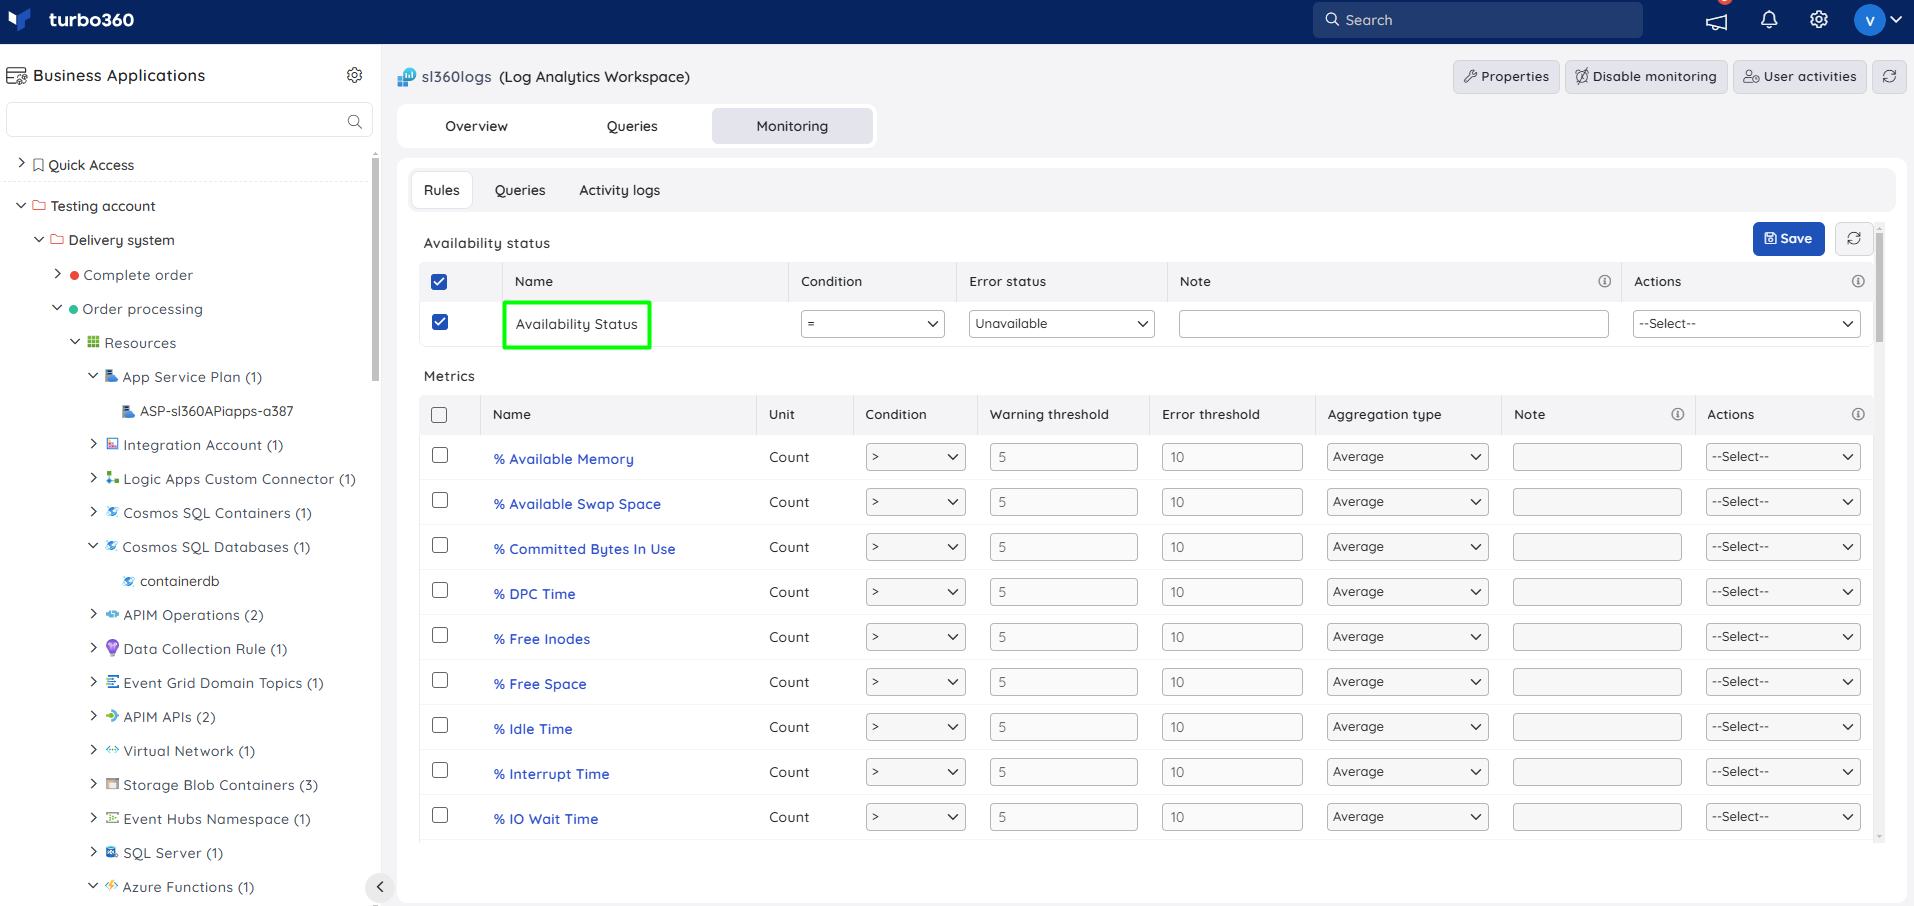
The resource health status of Log Analytics workspaces can be monitored with the help of Availability status rule.
- Navigate to Log Analytics Workspace -> Monitoring
- Configure the Availability status rule with the desired threshold
- Click Save
Metric monitoring
- Switch to the Metrics and properties tab to configure rules for metric monitoring
- Select the necessary monitoring metrics and configure the threshold values
- Click Save
Monitoring rules will be saved for Log Analytics, and the monitoring state for the metrics will be reflected after every monitoring cycle.
Query monitoring
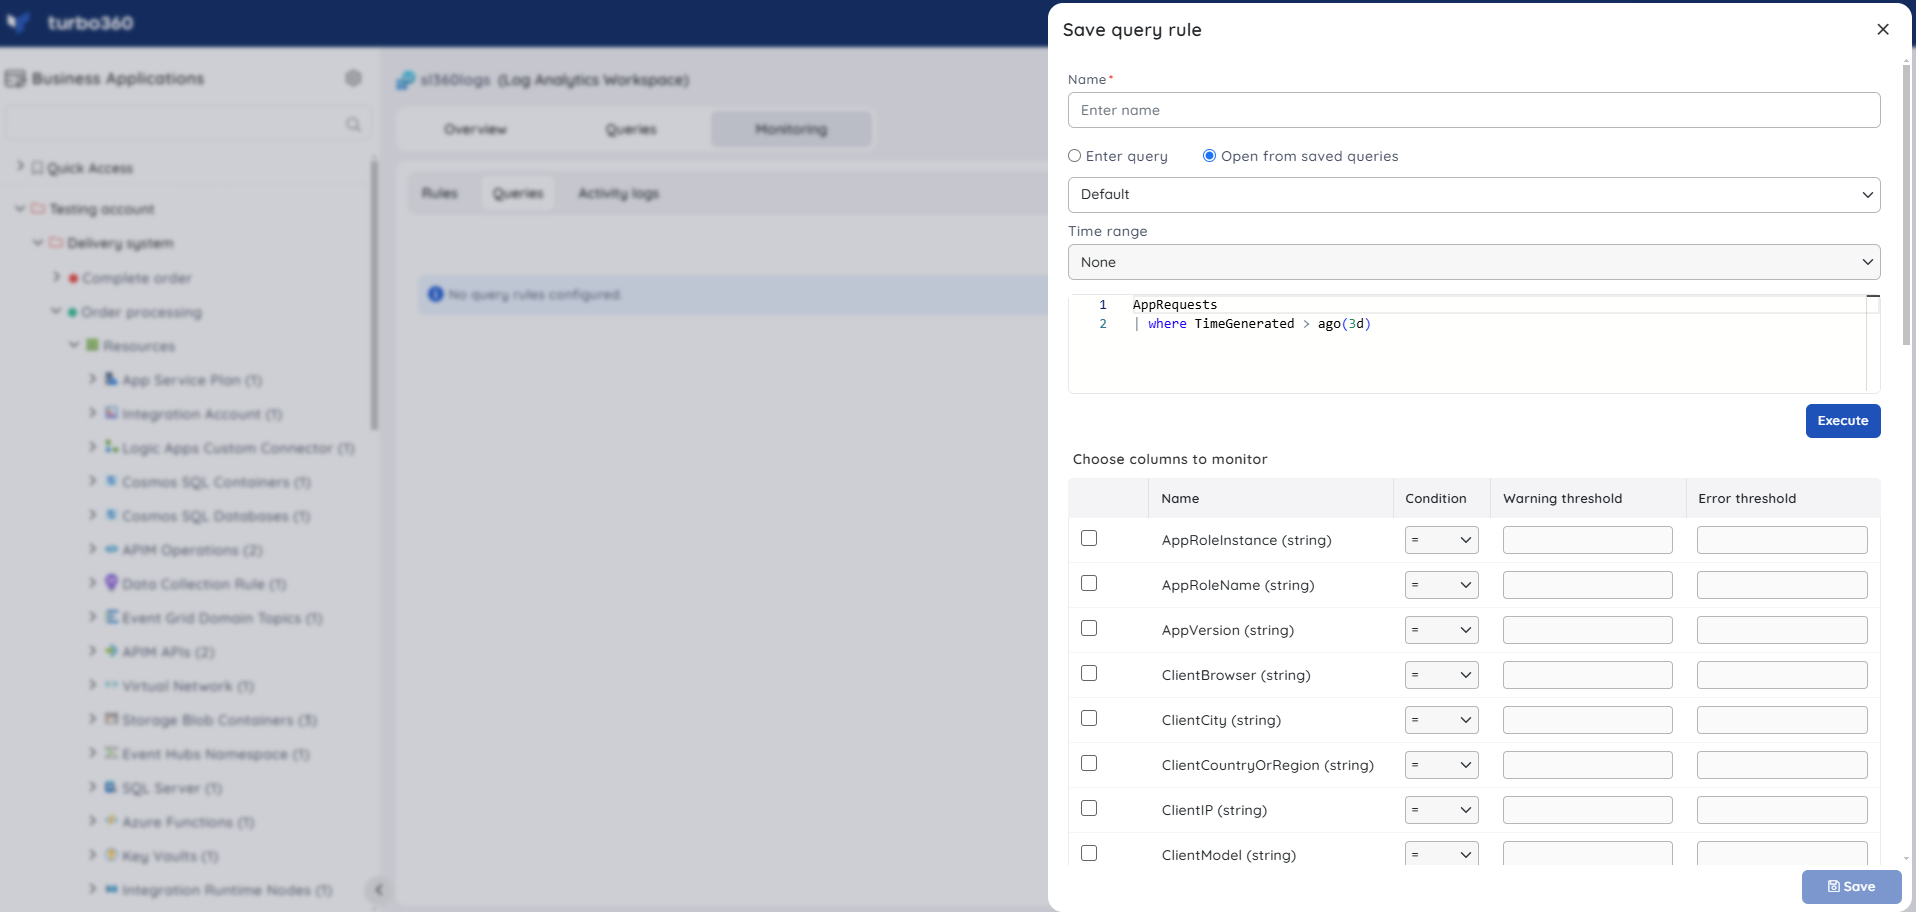
- Switch to the Queries tab to configure rules for query monitoring
- Click Add
- Enter a name to the query rule
- You can enter the desired query by choosing Enter query (or) select one from the list of saved queries by choosing Open from saved queries
- Select the preferred time range
- Click Execute to run the query
- Select the required query columns and configure the threshold values
- Click Save
Query monitoring will be initiated once the rules are saved, and the query monitoring state will be reflected after every monitoring cycle.
- The metric thresholds can also include any metric name as its value.
- Log Analytics allow both scalar and non-scalar queries for query monitoring.

