Logic App
- 15 Apr 2026
- 7 Minutes to read
- Print
- DarkLight
- Download PDF
Logic App
- Updated on 15 Apr 2026
- 7 Minutes to read
- Print
- DarkLight
- Download PDF
Article summary
Did you find this summary helpful?
Thank you for your feedback!
Introduction
Logic App is a cloud service that helps users to schedule, automate, and orchestrate tasks, business processes, and workflows when they need to integrate apps, data, systems and services across enterprises or organizations.
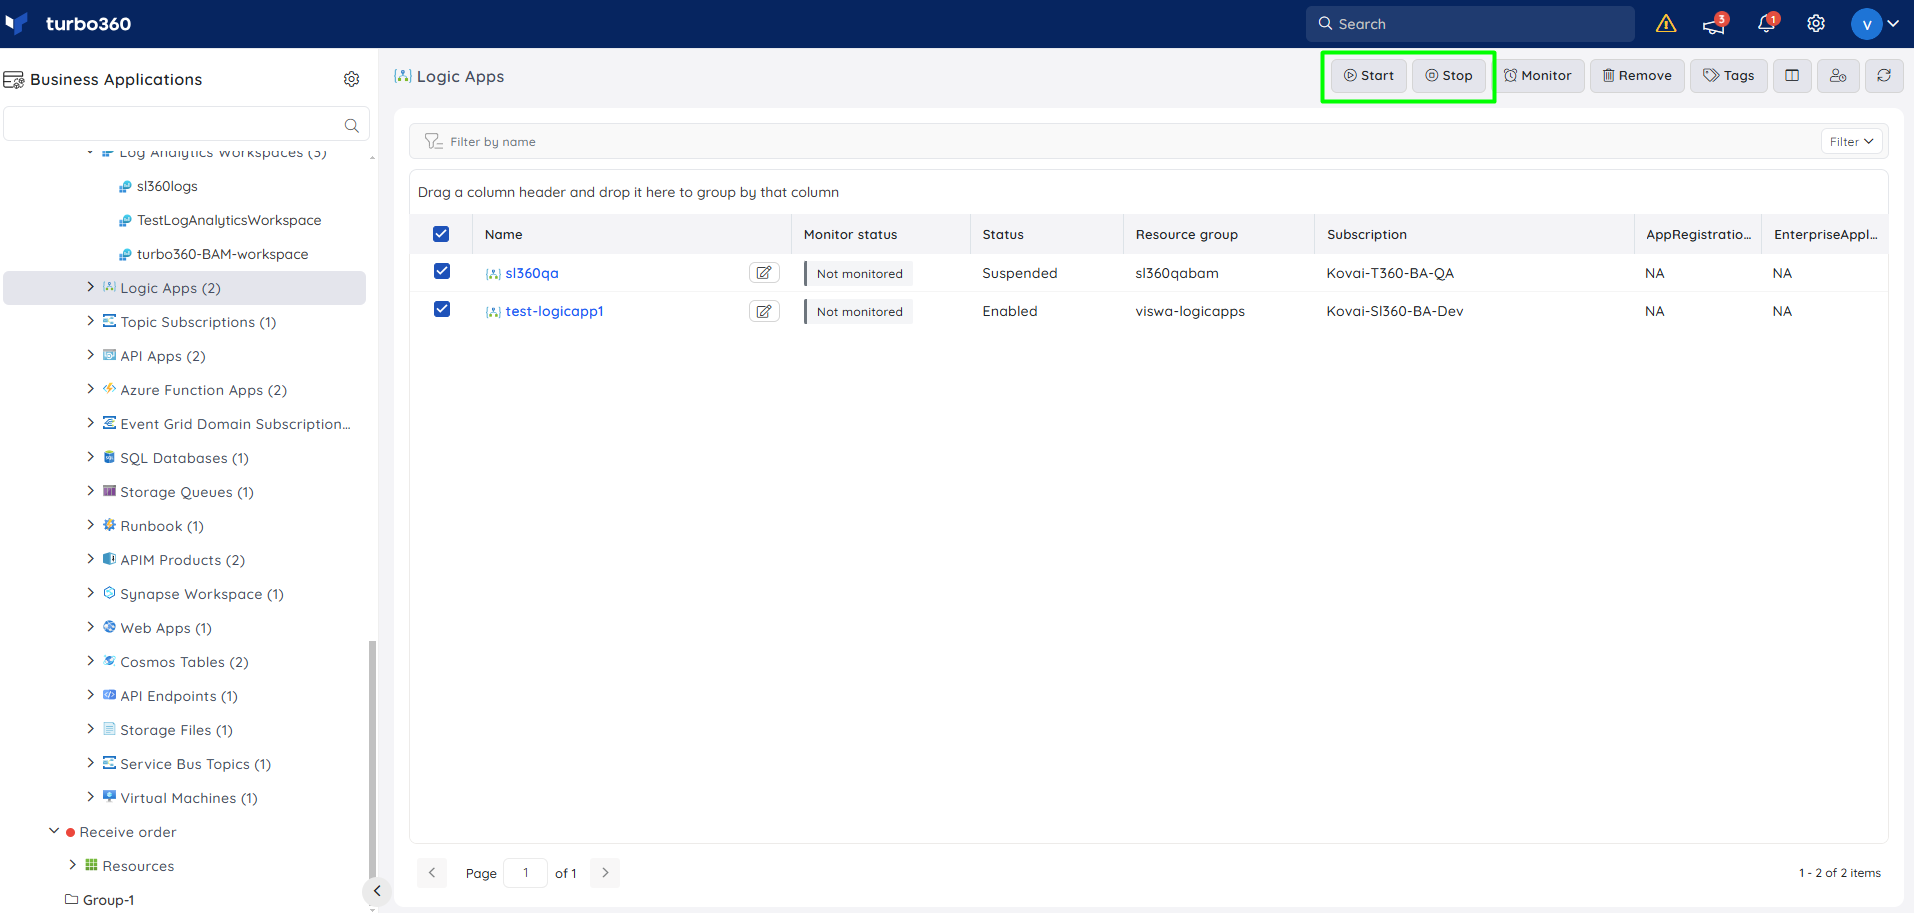
Enable & Disable
Users can perform the following actions using Turbo360:
Enable or Disable a Logic App to reflect its status in the Azure Subscription.
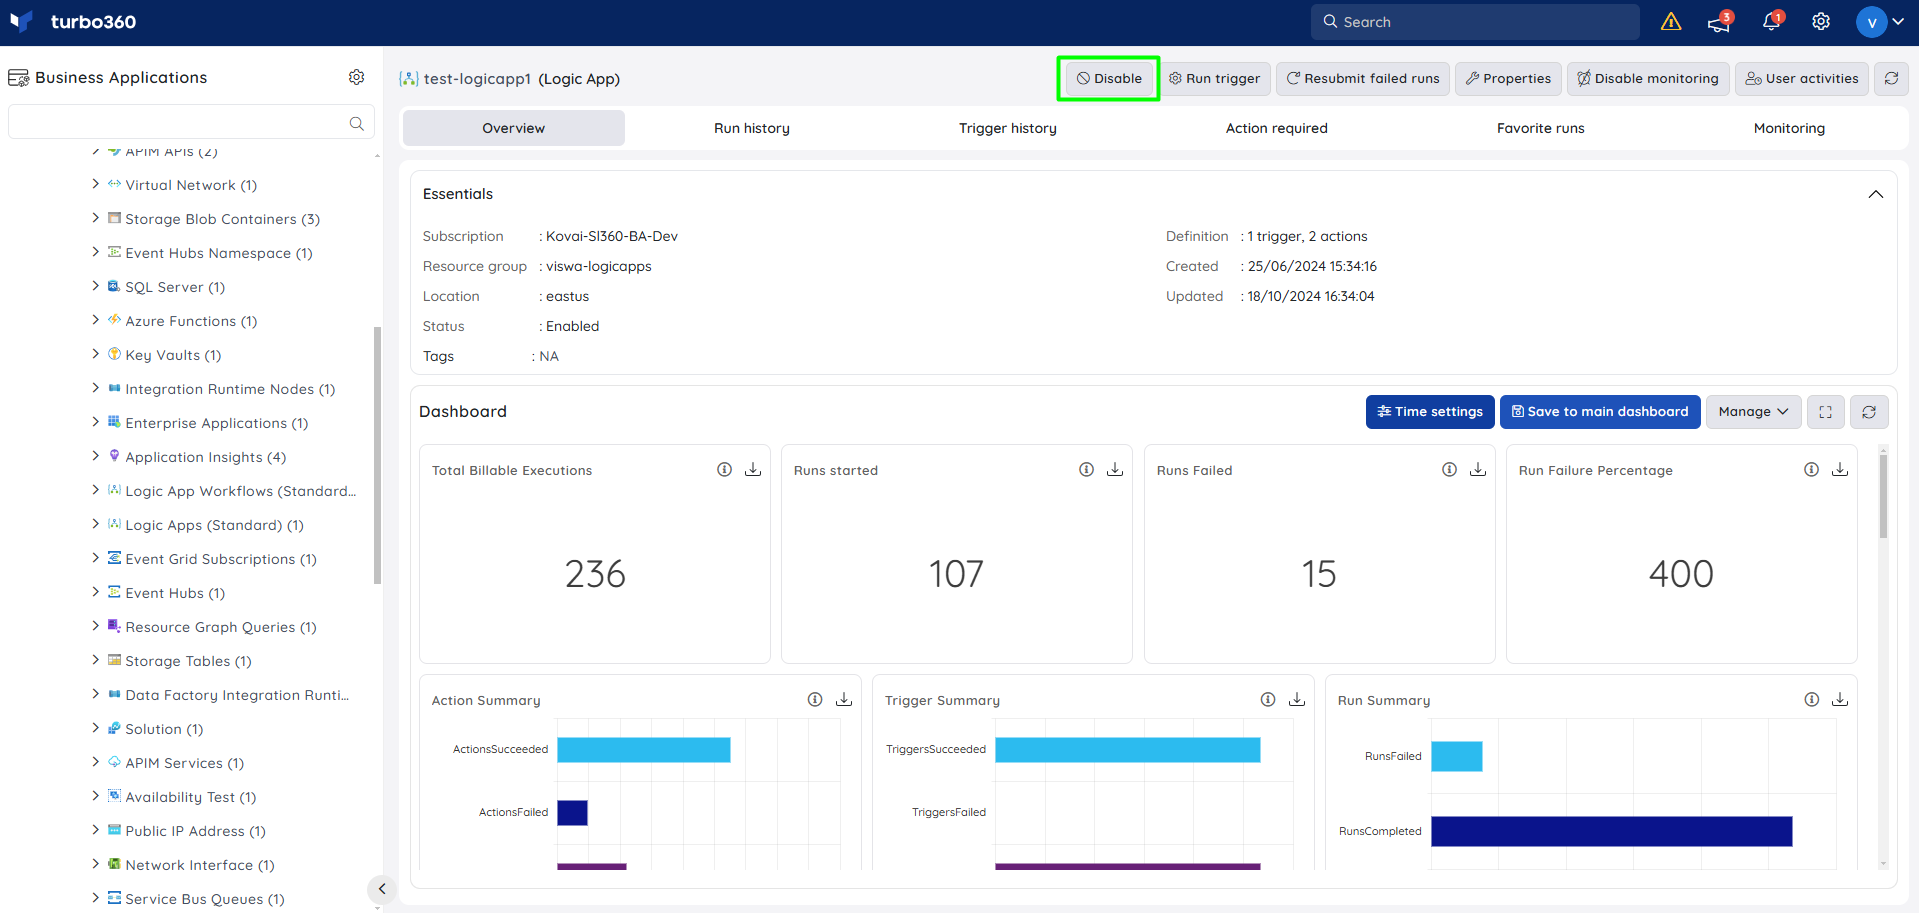
Bulk Start / Stop operations can be performed using a single click in the Logic App resources section.
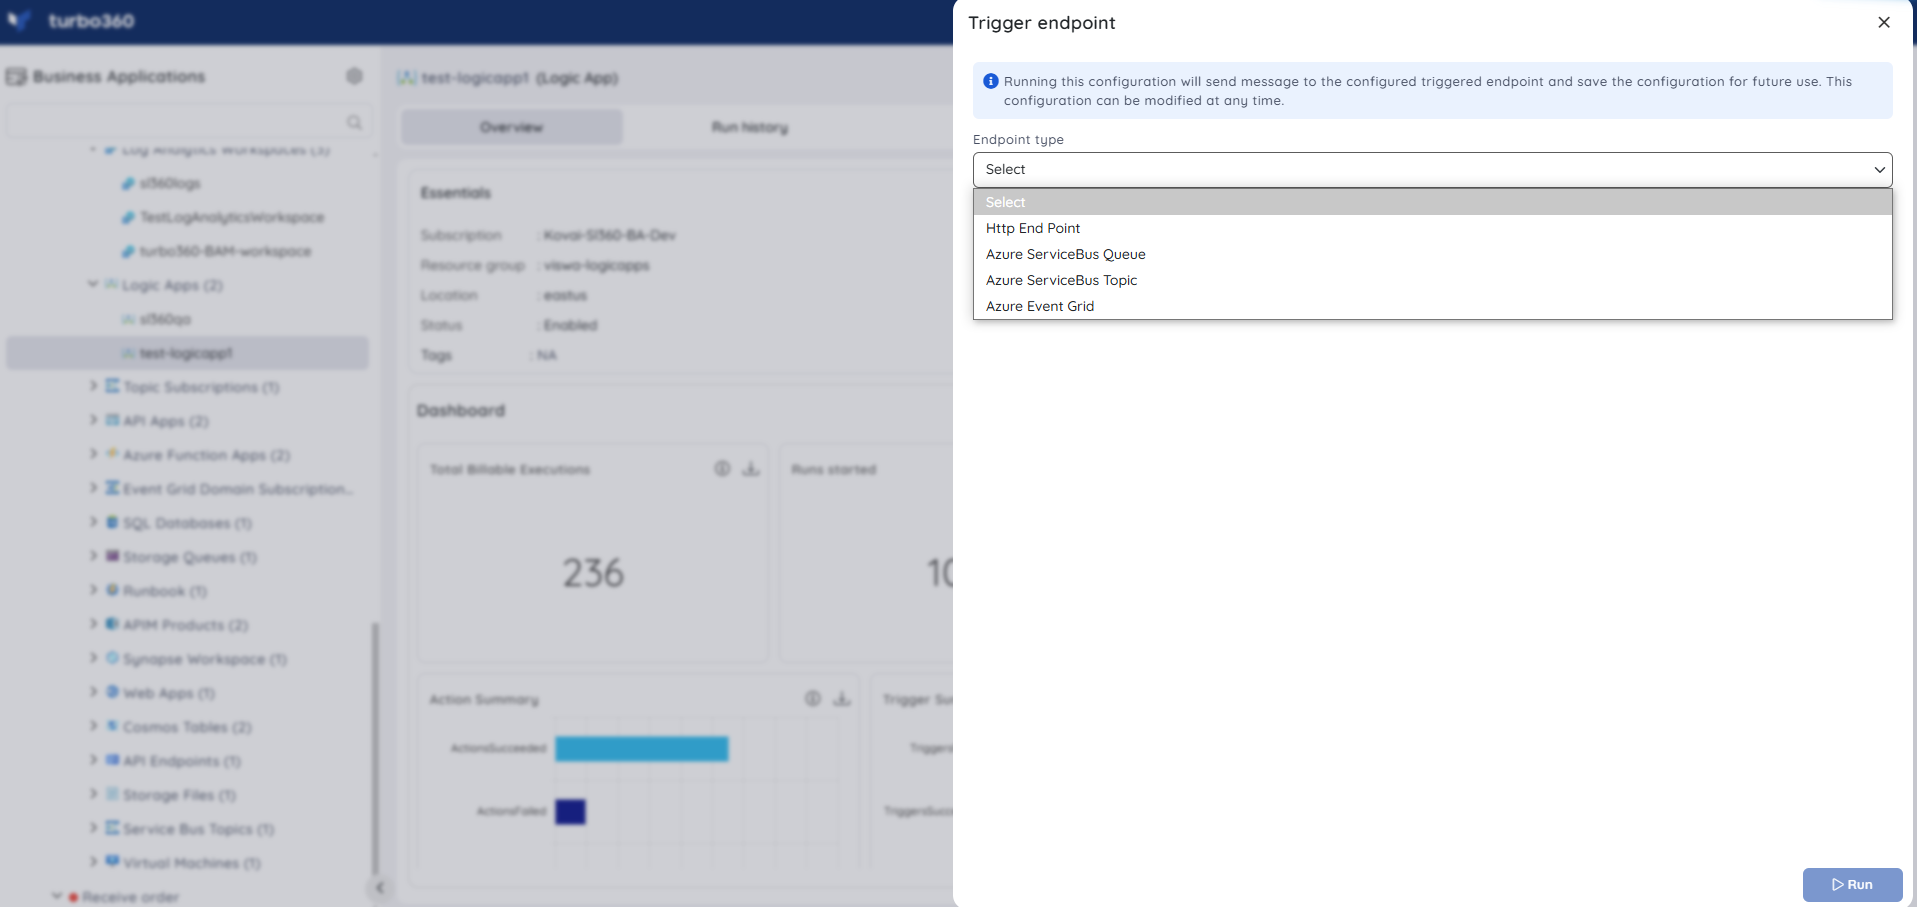
Run trigger
Turbo360 allows users to invoke the Logic App by sending a message to the trigger.
The Run trigger option allows users to modify a message and resubmit it to an endpoint, allowing their Logic App to be recovered from the error condition.
When a user enters a specific Logic App, the Run trigger option appears at the top to invoke the trigger. By providing the trigger details and sending the message, the triggering operation can be performed.
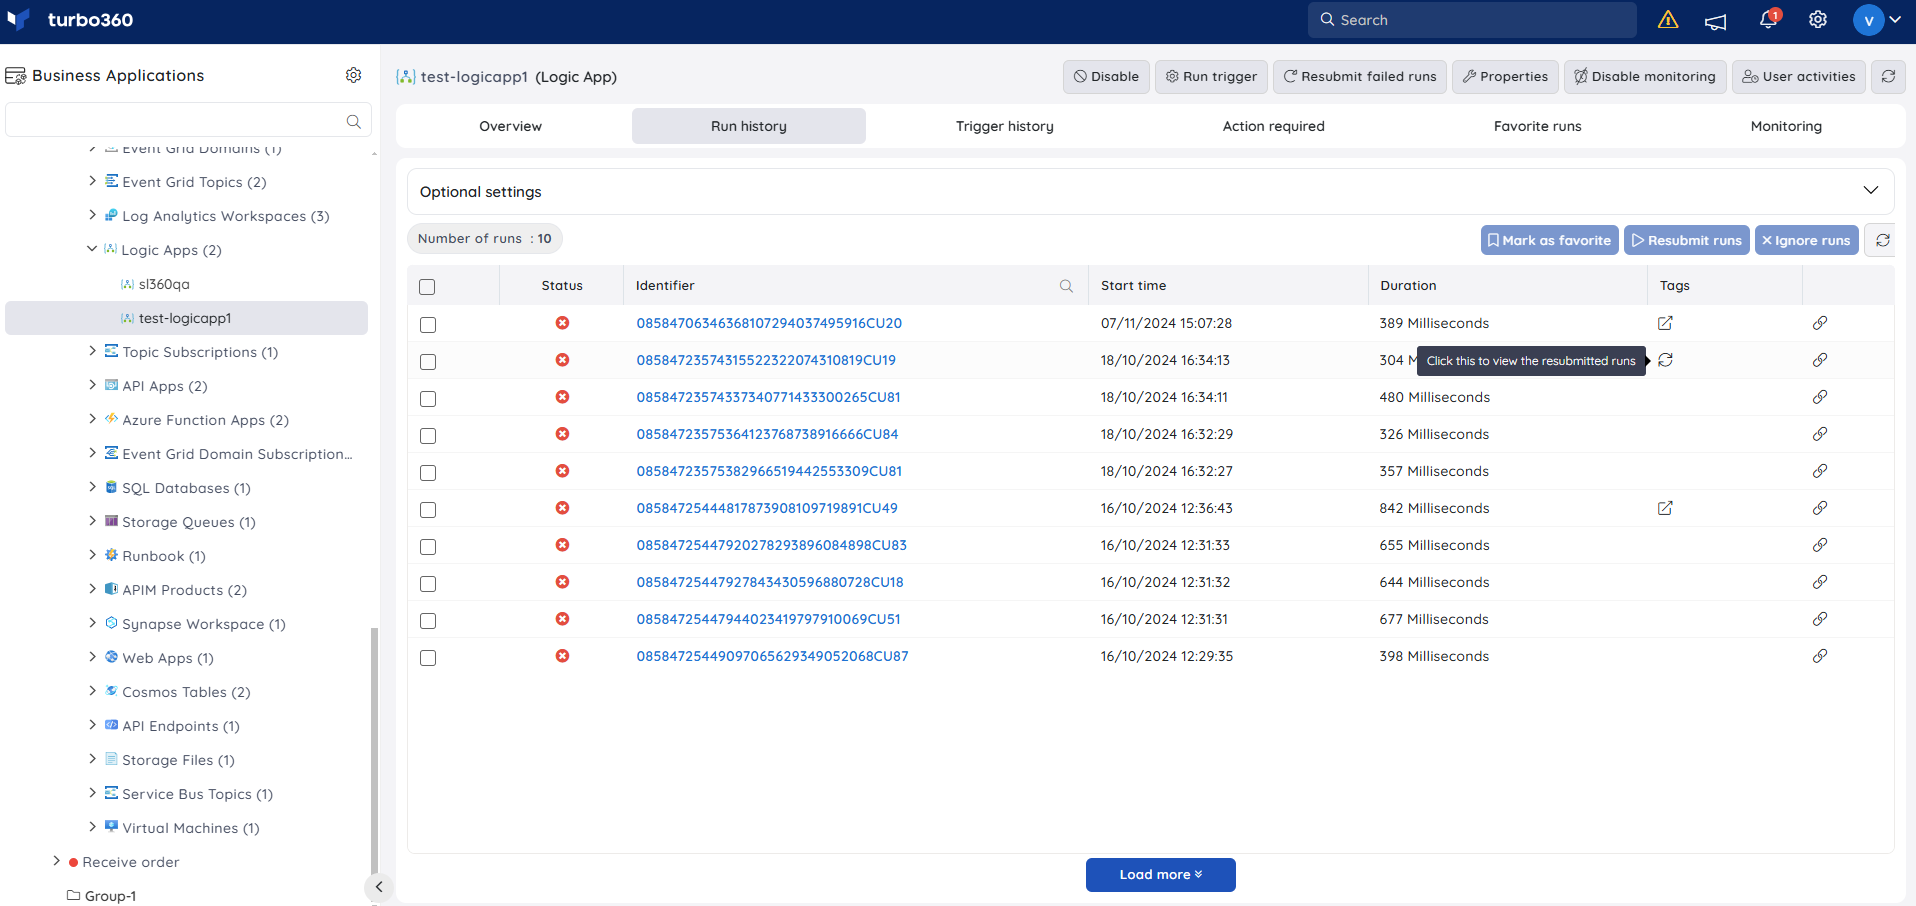
Run history
- Run history displays a list of Logic App executions, including their start time, duration, and associated tags.
.png)
- Clicking on a run identifier opens detailed information for that specific run. Users can drill down into each trigger and action within a run to analyze the workflow execution, including the trigger inputs and outputs.
.png)
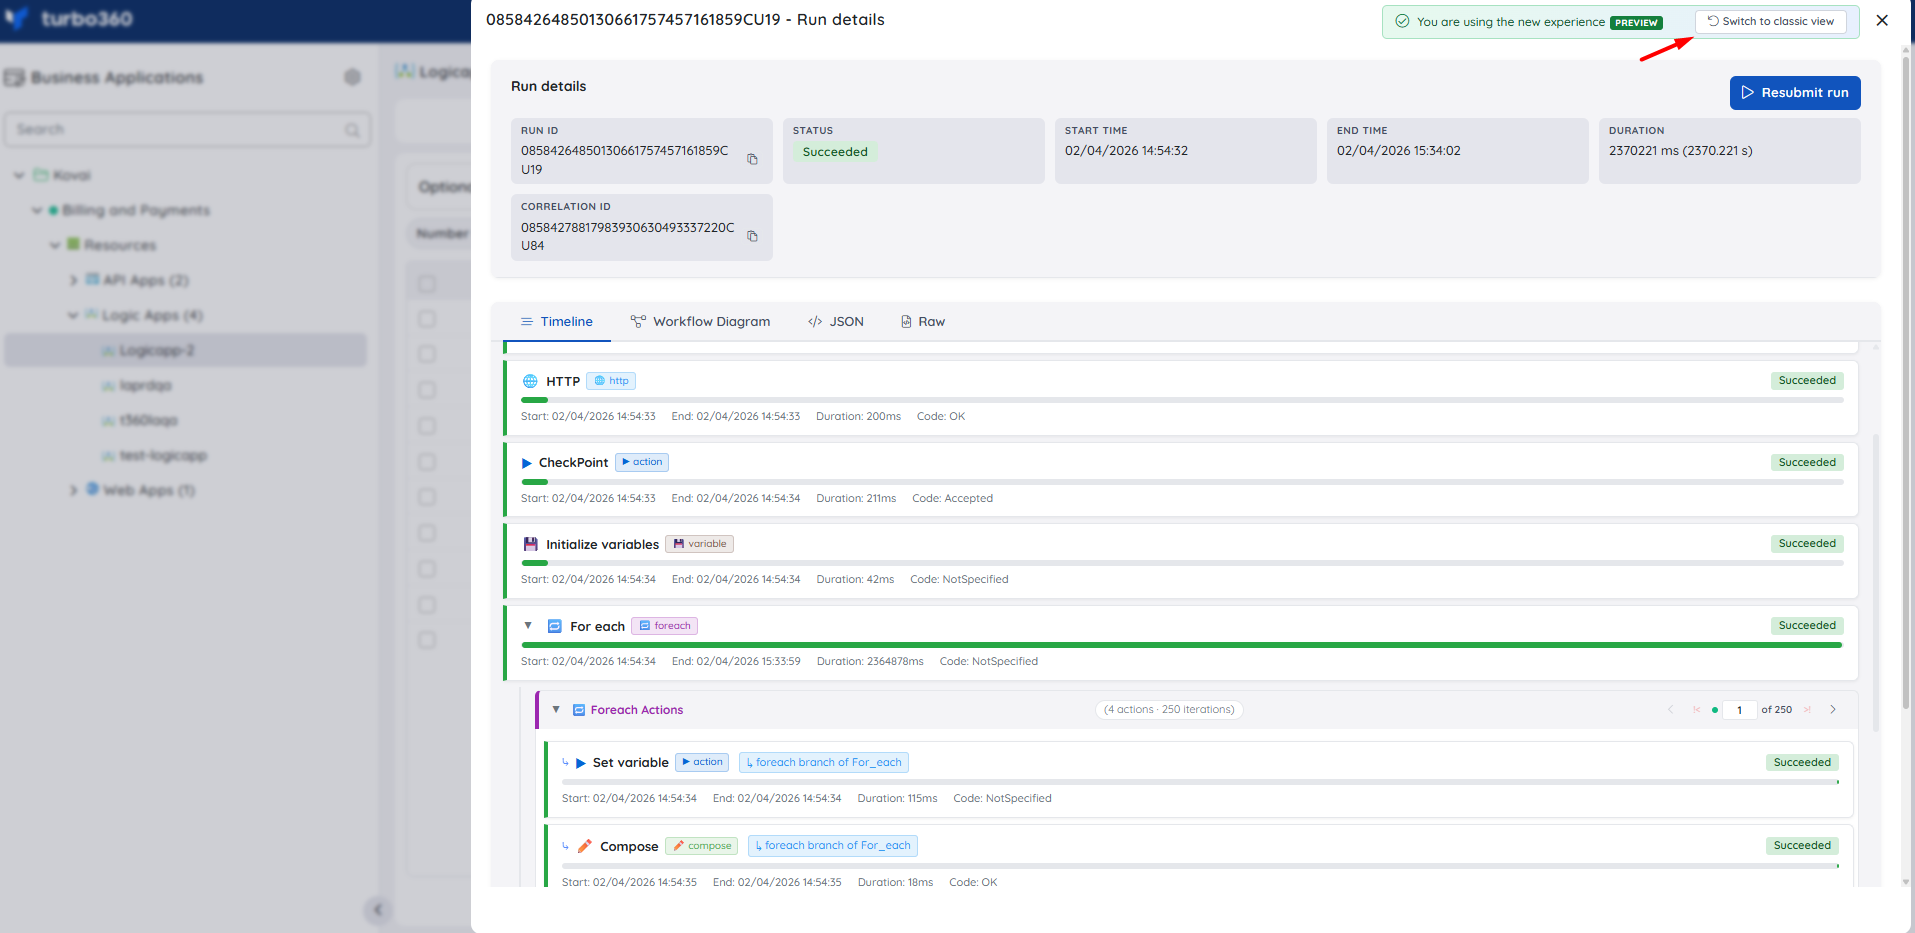
Enhanced Run history view
The improved Run history view enhances how users analyze Logic App executions by shifting from a static list to a more interactive and visual experience. This new approach provides greater clarity into how workflows execute over time, while also enabling users to resubmit runs directly from the same view for quicker recovery.
By organizing execution steps into a timeline, users can easily trace the path of a run, inspect individual actions, and access detailed inputs and outputs—all within a unified view. This streamlined experience supports faster troubleshooting, improved traceability, and more confident decision-making.
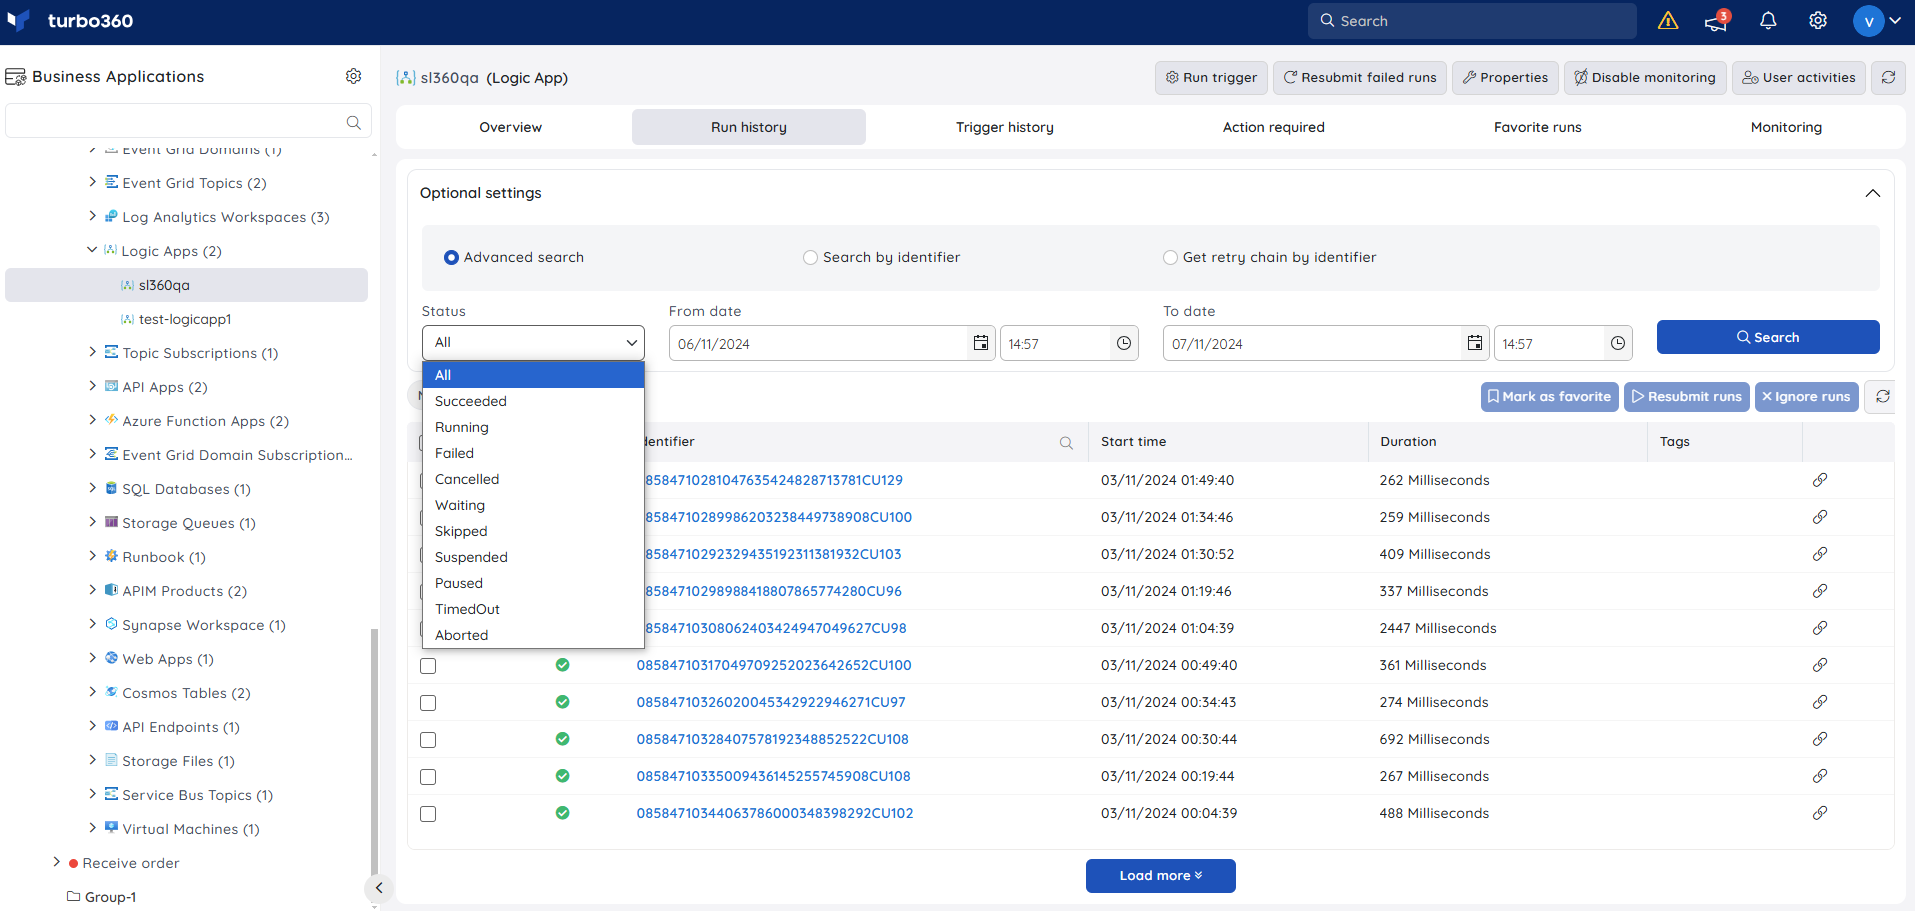
Optional settings
Users can make use of the Optional Settings in the Run history tab to perform the following options.
Advanced Search
Logic App runs can be filtered using Advanced search by choosing the From date and To date along with any one of the following statuses:
- Succeeded
- Running
- Failed
- Cancelled
- Waiting
- Skipped
- Suspended
- Paused
- Timed Out
- Aborted
Search by identifier
Search by identifier allows users to retrieve the run details for the identifier they input.
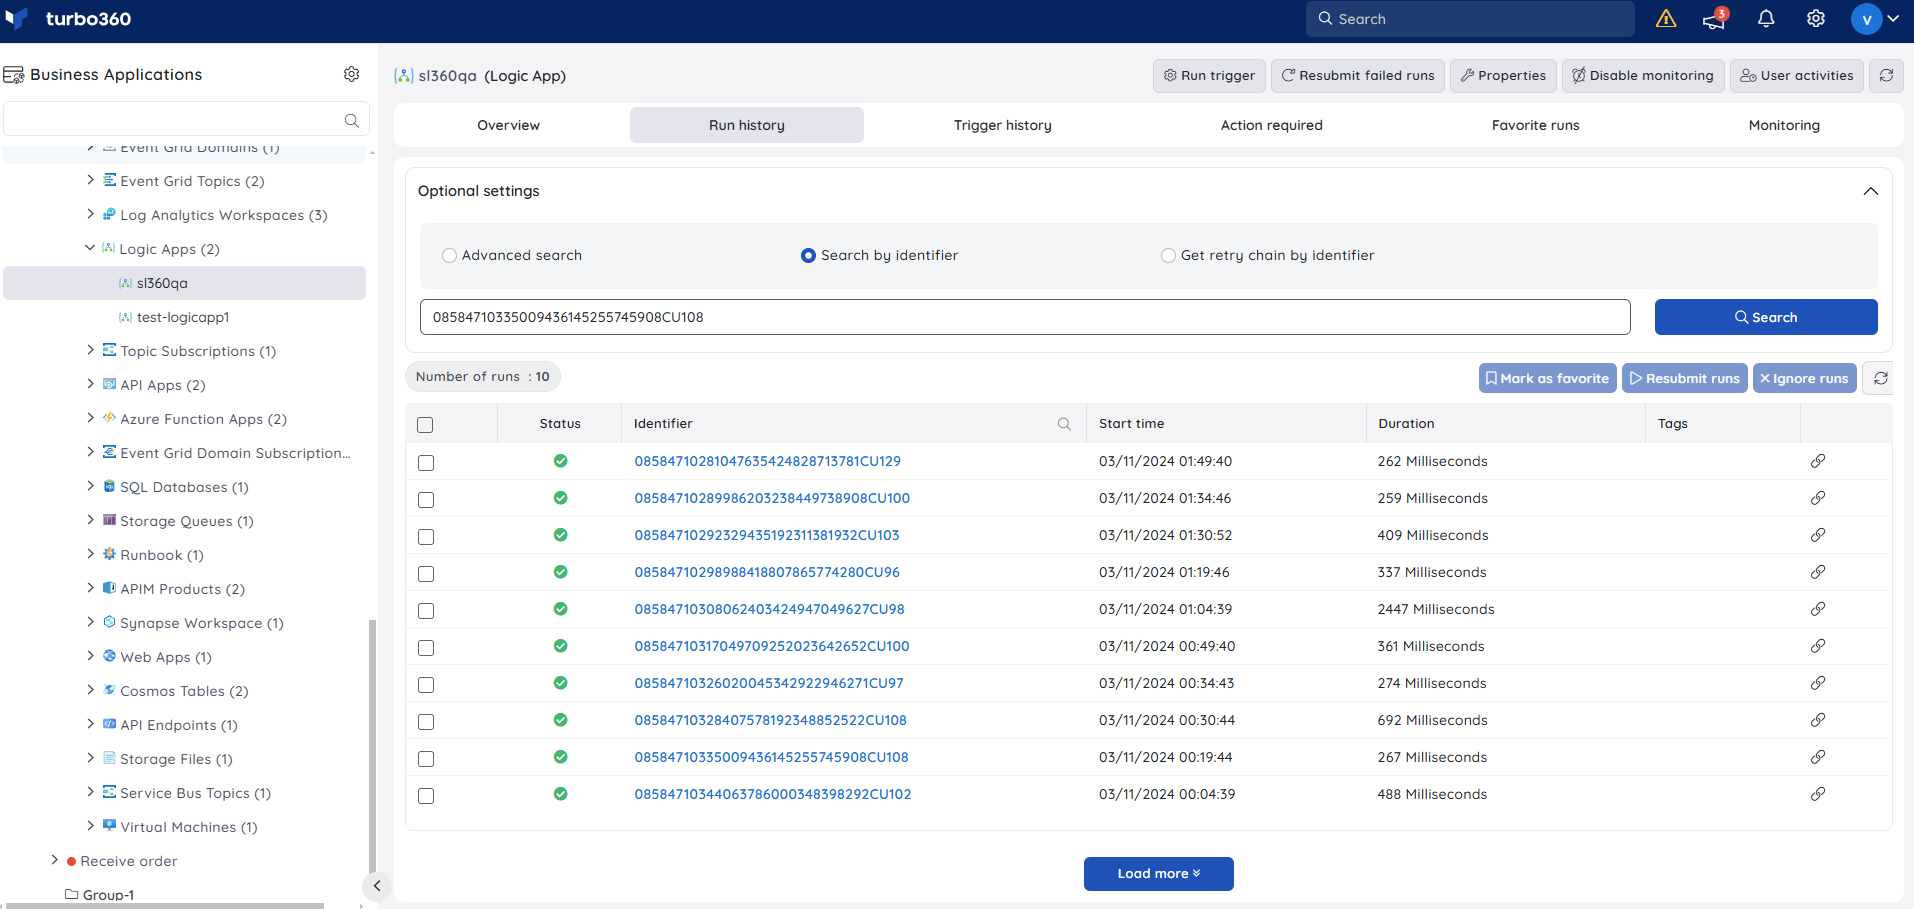
Get Retry Chain by identifier
Users can get the Retry chain by entering the run identifier.
Apart from this optional setting, users can also get the retry chain by clicking on the tag next to the run identifier.

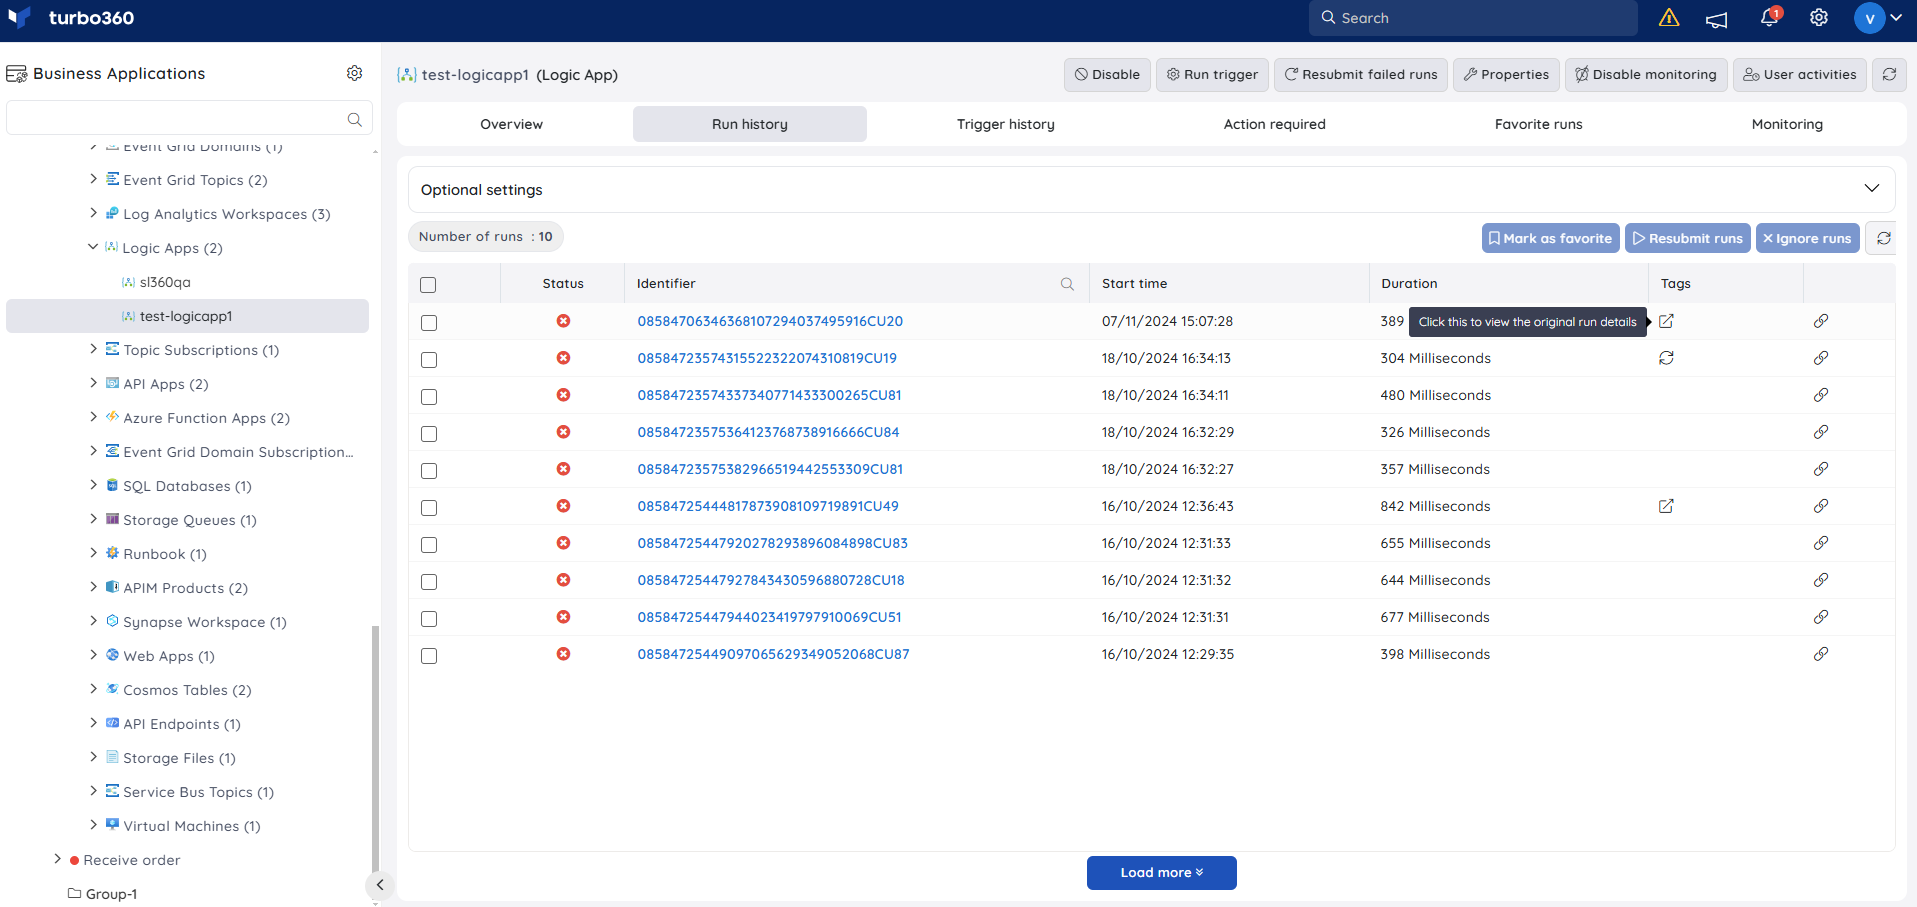
Resubmit failed Logic App runs
A Logic App run can fail when an individual action encounters an error—an expected scenario in complex business orchestrations. Turbo360 provides comprehensive visibility into run history, enabling users to access detailed insights into failed executions.
To further strengthen operational control, users can resubmit runs directly from the Run history, ensuring faster recovery and continuity.
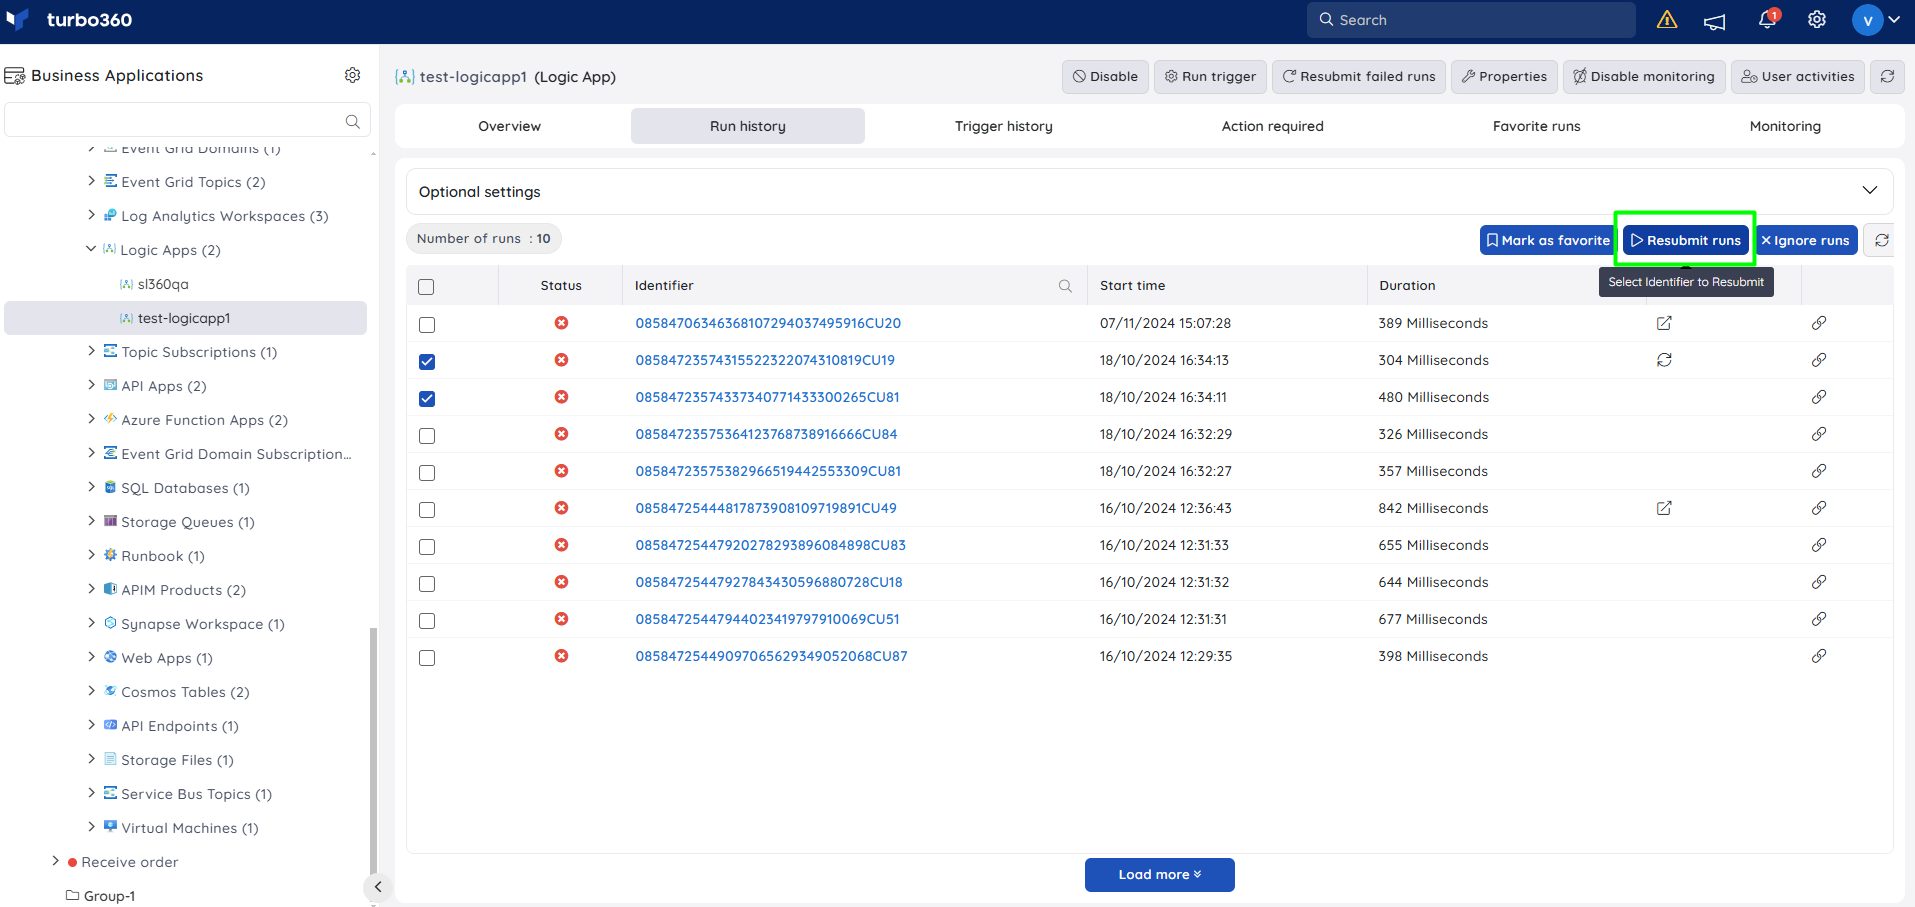
- While resubmission is supported in the Azure portal, distinguishing resubmitted runs often lacks clarity. This is addressed through the application of tags that capture the relationship to the original parent run, providing clear traceability for runs resubmitted from either Turbo360 or the Azure portal.
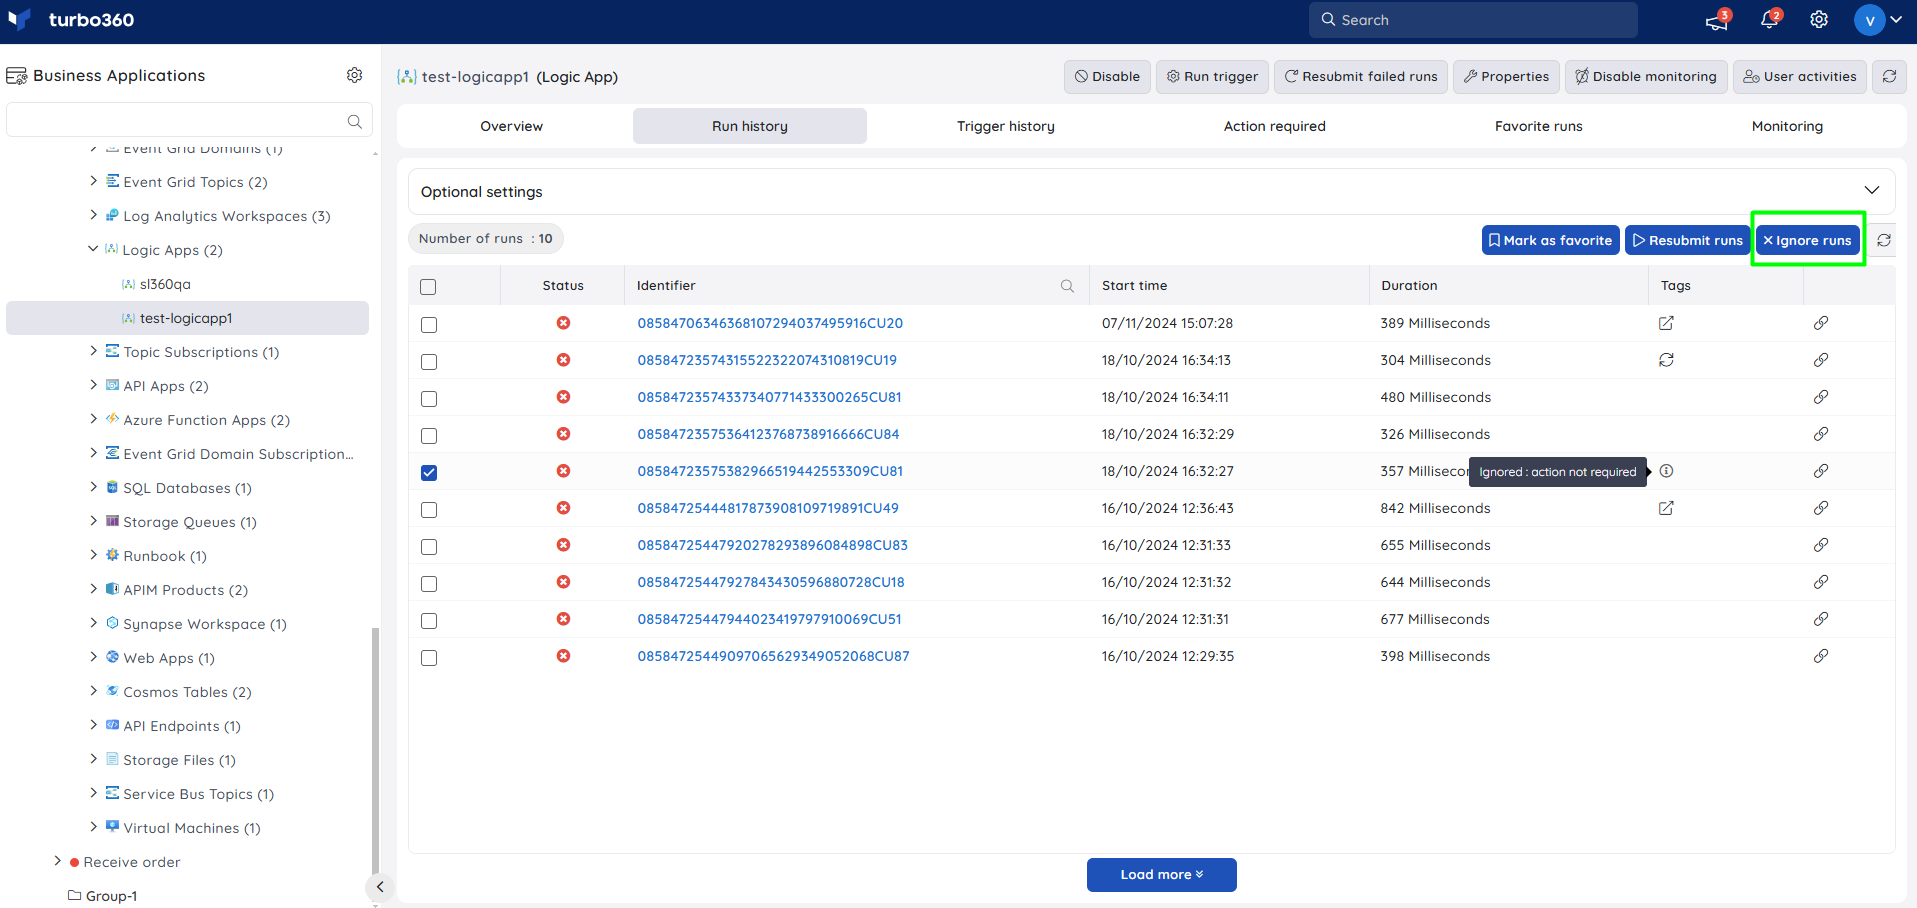
Ignore runs
It is possible to ignore logic app runs in bulk and a tag will be associated with the specific runs along with a description. This ignore tag is visible only in Turbo360. It will not have any impact on the actual runs.
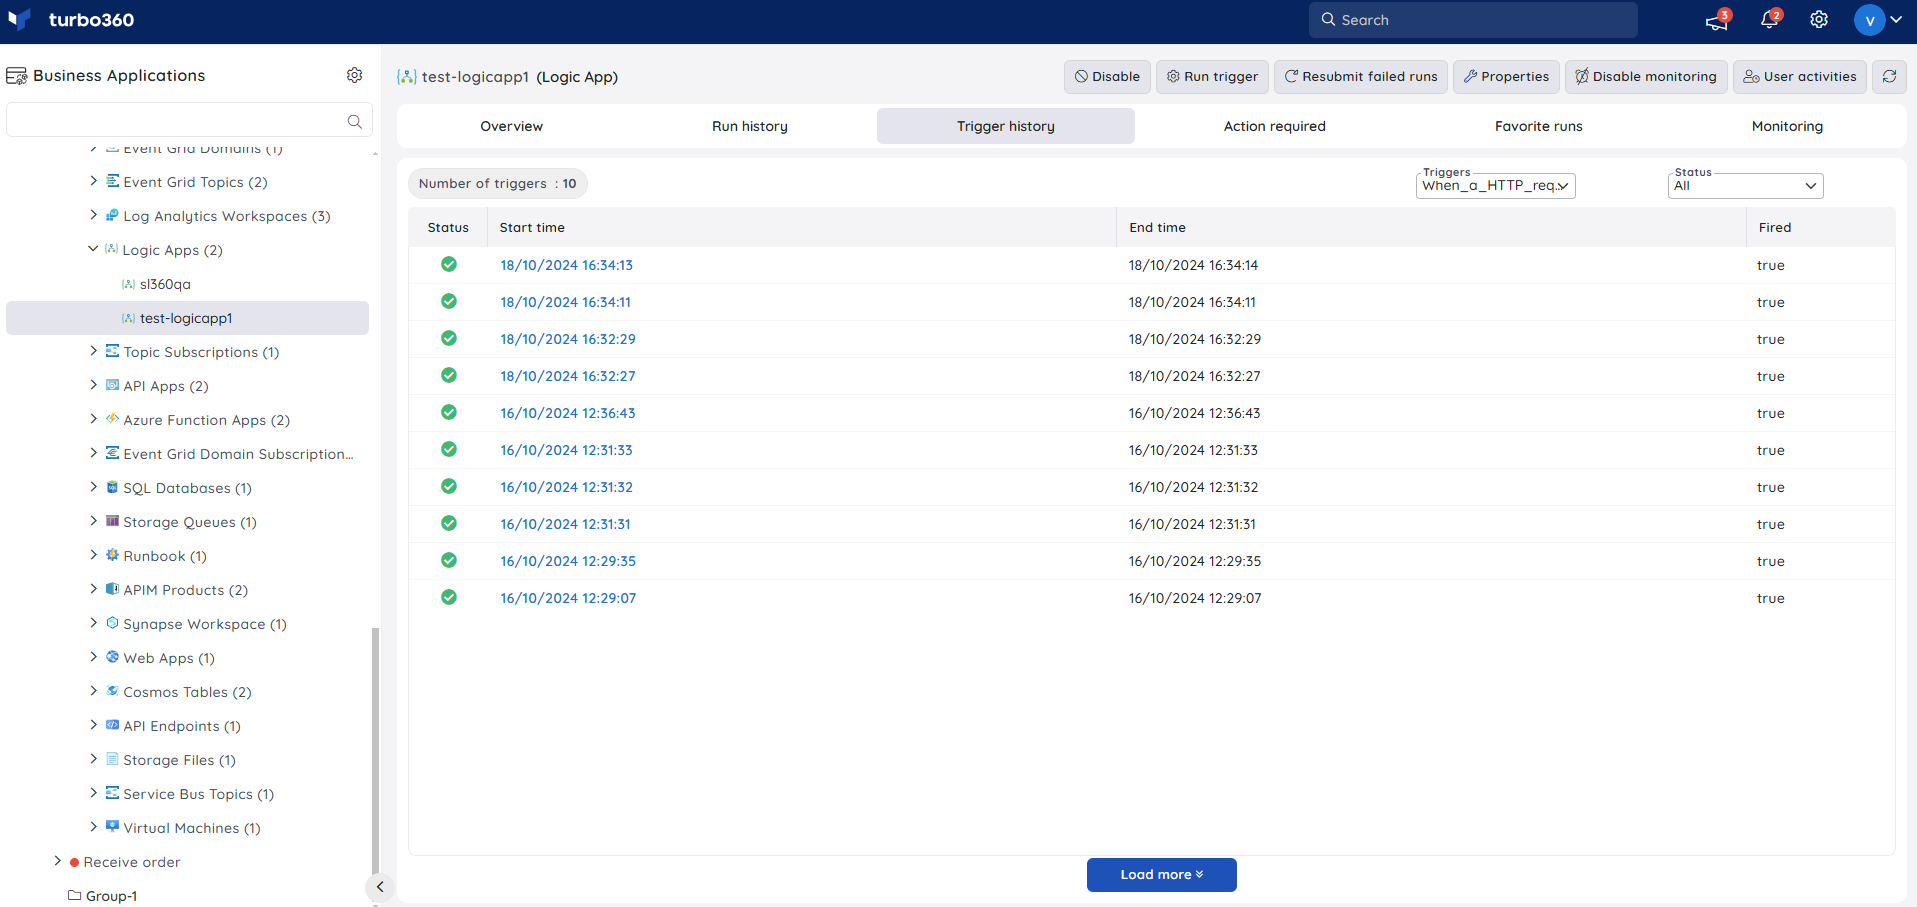
Trigger history
Users can view all the triggers to the Logic App along with details about the inputs and outputs of each trigger. If there are multiple triggers, the trigger history can be filtered by the trigger, as in Azure Portal.
The triggers can also be filtered based on the following statuses:
- Succeeded
- Running
- Failed
- Cancelled
- Waiting
- Skipped
- Suspended
- Paused
- Timed out
- Aborted
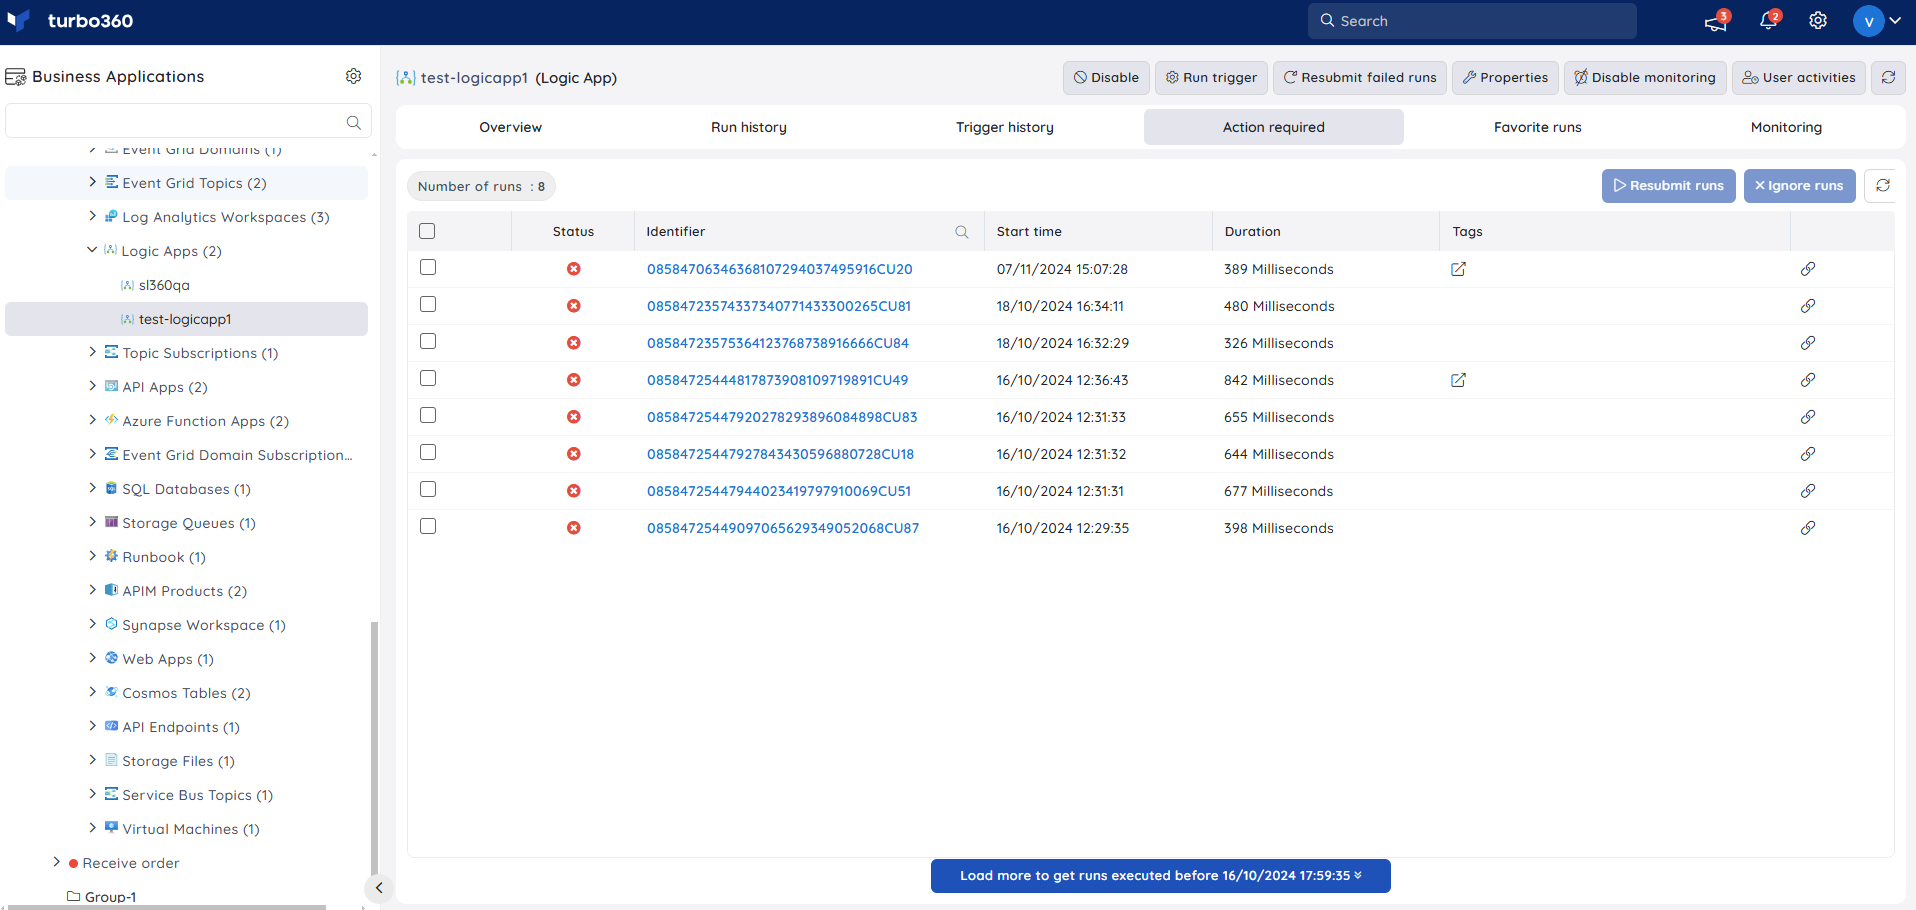
Action required
Action required helps users to focus on the failed Logic App runs.
It also enables them to resubmit as well as ignore the failed runs.
Action required runs widget
Turbo360 offers Count Chart widget support for the Action required runs metric, allowing users to identify the number of failed runs that require any action to be performed within a specified time interval.
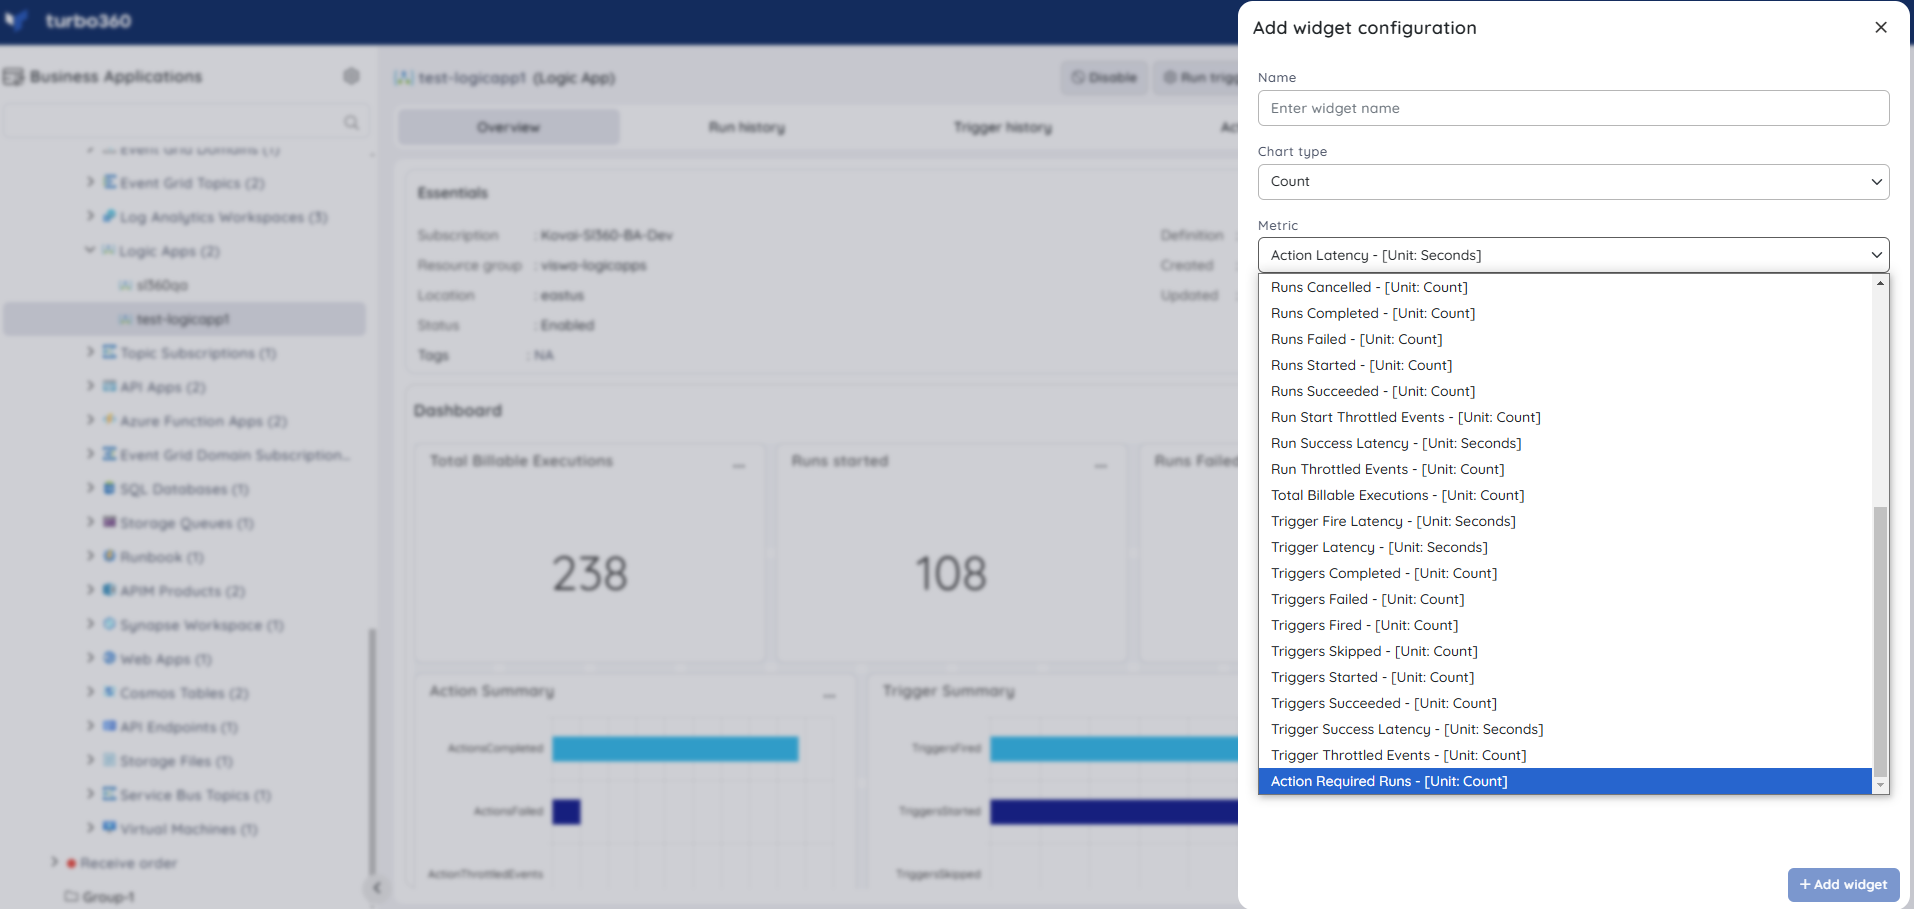
Resubmission should be done only from Turbo360 in order to get more accurate results for this Dashboard widget. Resubmitting from the Azure portal will have no effect on the Action required runs Count Chart widget.
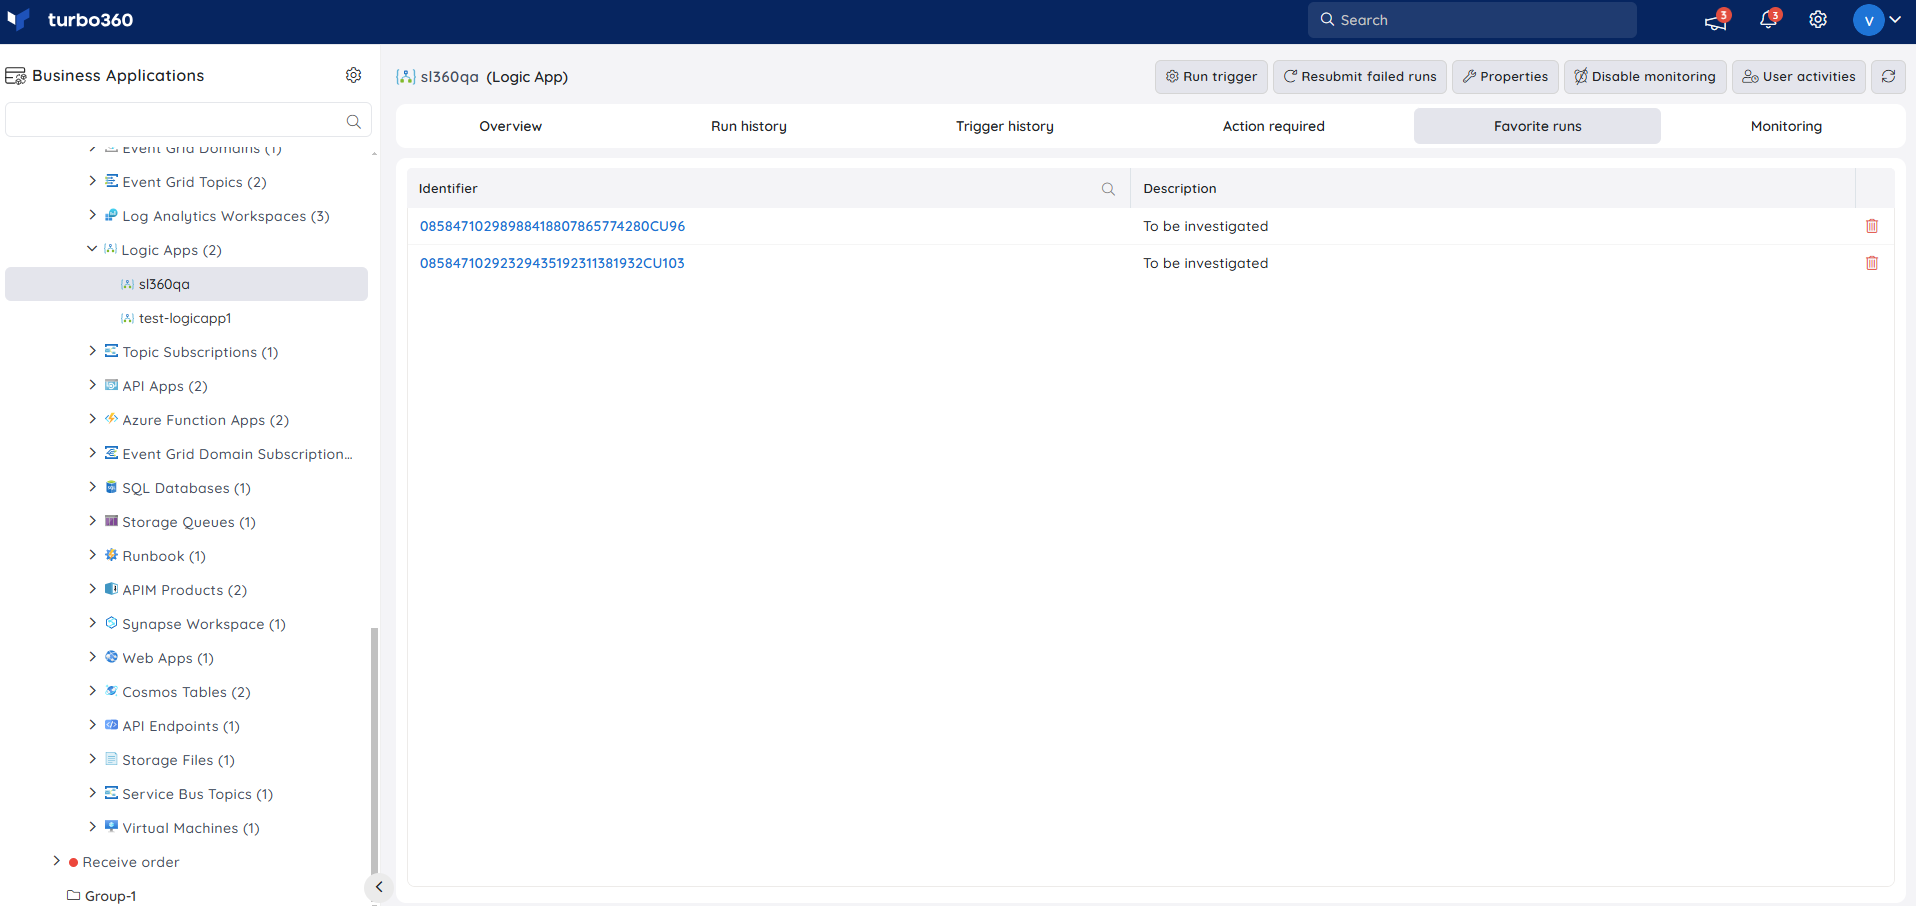
Favorite runs
Any of the Logic App runs used frequently can be marked as a favorite along with an optional description from both Run history as well as Action required tabs.
Multiple runs can be marked as favorite at once. Users can also remove a particular run from favorites in the Favorite runs tab.
Inline task
In the Logic App section, users can create a really quick task to resubmit failed runs from the source logic app that is being explored.
The configuration created to run immediately can also be saved for future use in the Automated tasks section.
Inline task to resubmit failed runs
This feature allows users to quickly resubmit the runs that failed within the specified hours (Minimum 1 hour).
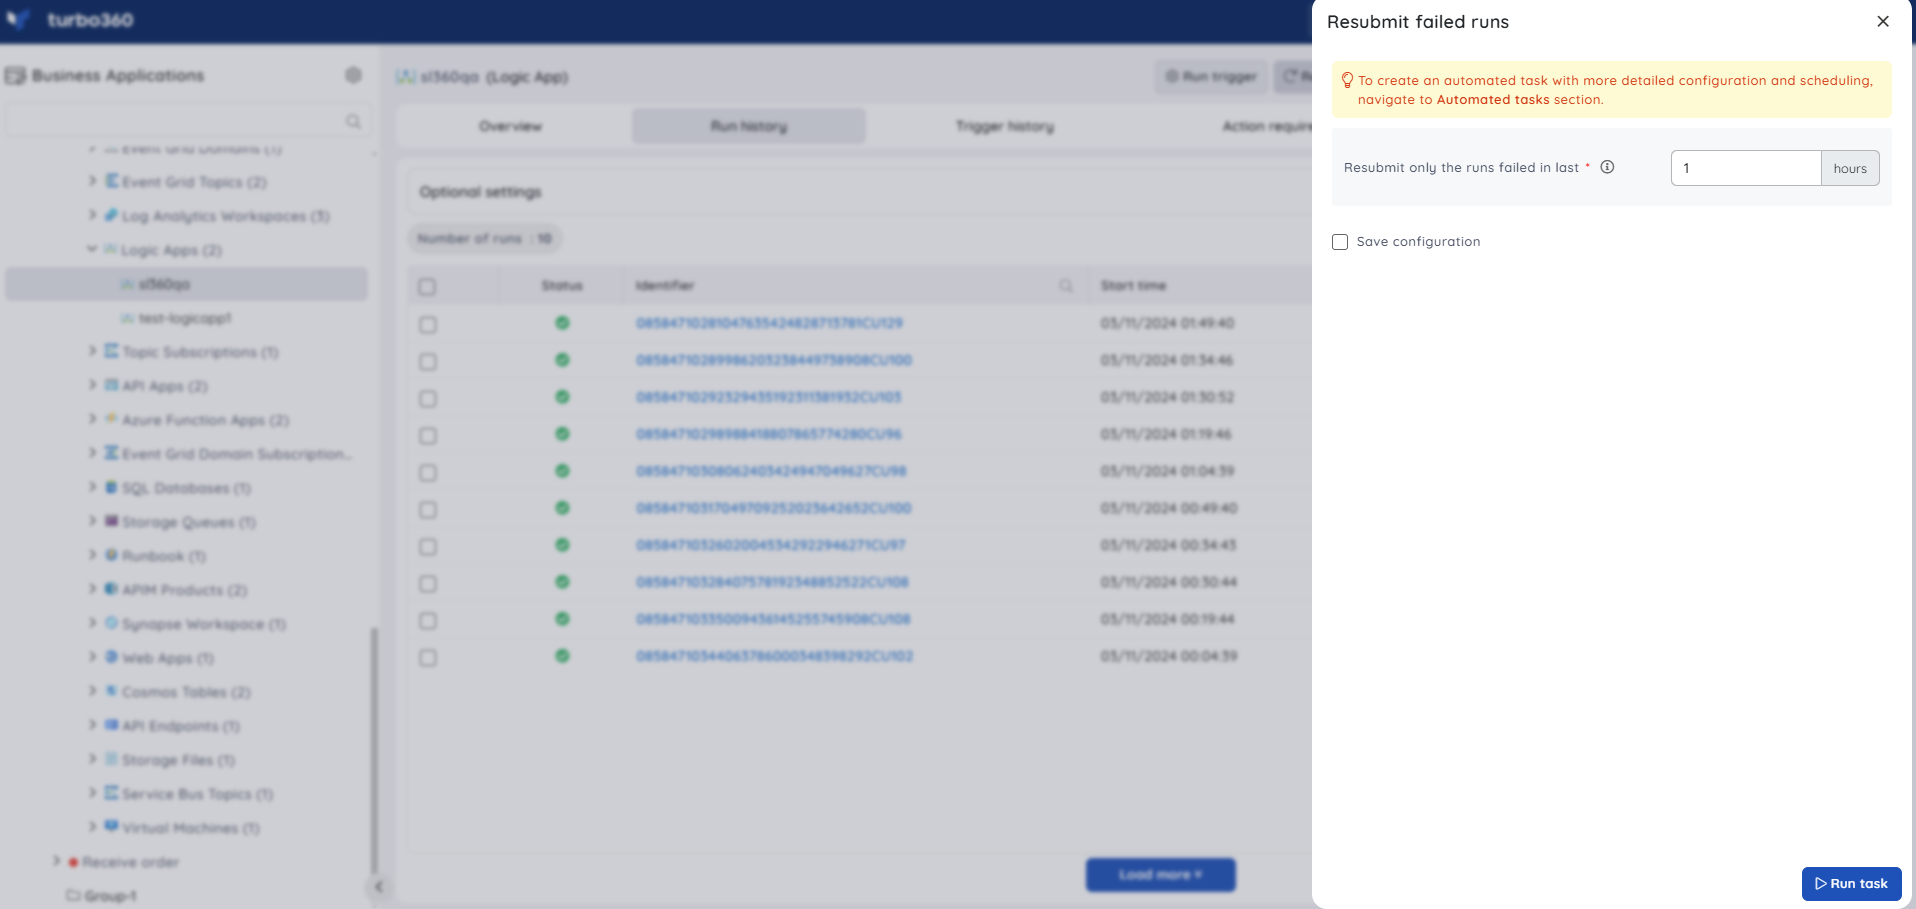
Task status can be viewed by navigating to Automated Tasks section and switching to Task history tab.
Note:
- Users can use this feature to quickly create a task that runs immediately.
- Navigate to the Automated Tasks section in Turbo360 to create a task with a more detailed configuration, schedule tasks to run at a specific time, or automate the task to run on the specified hours, days, and more.
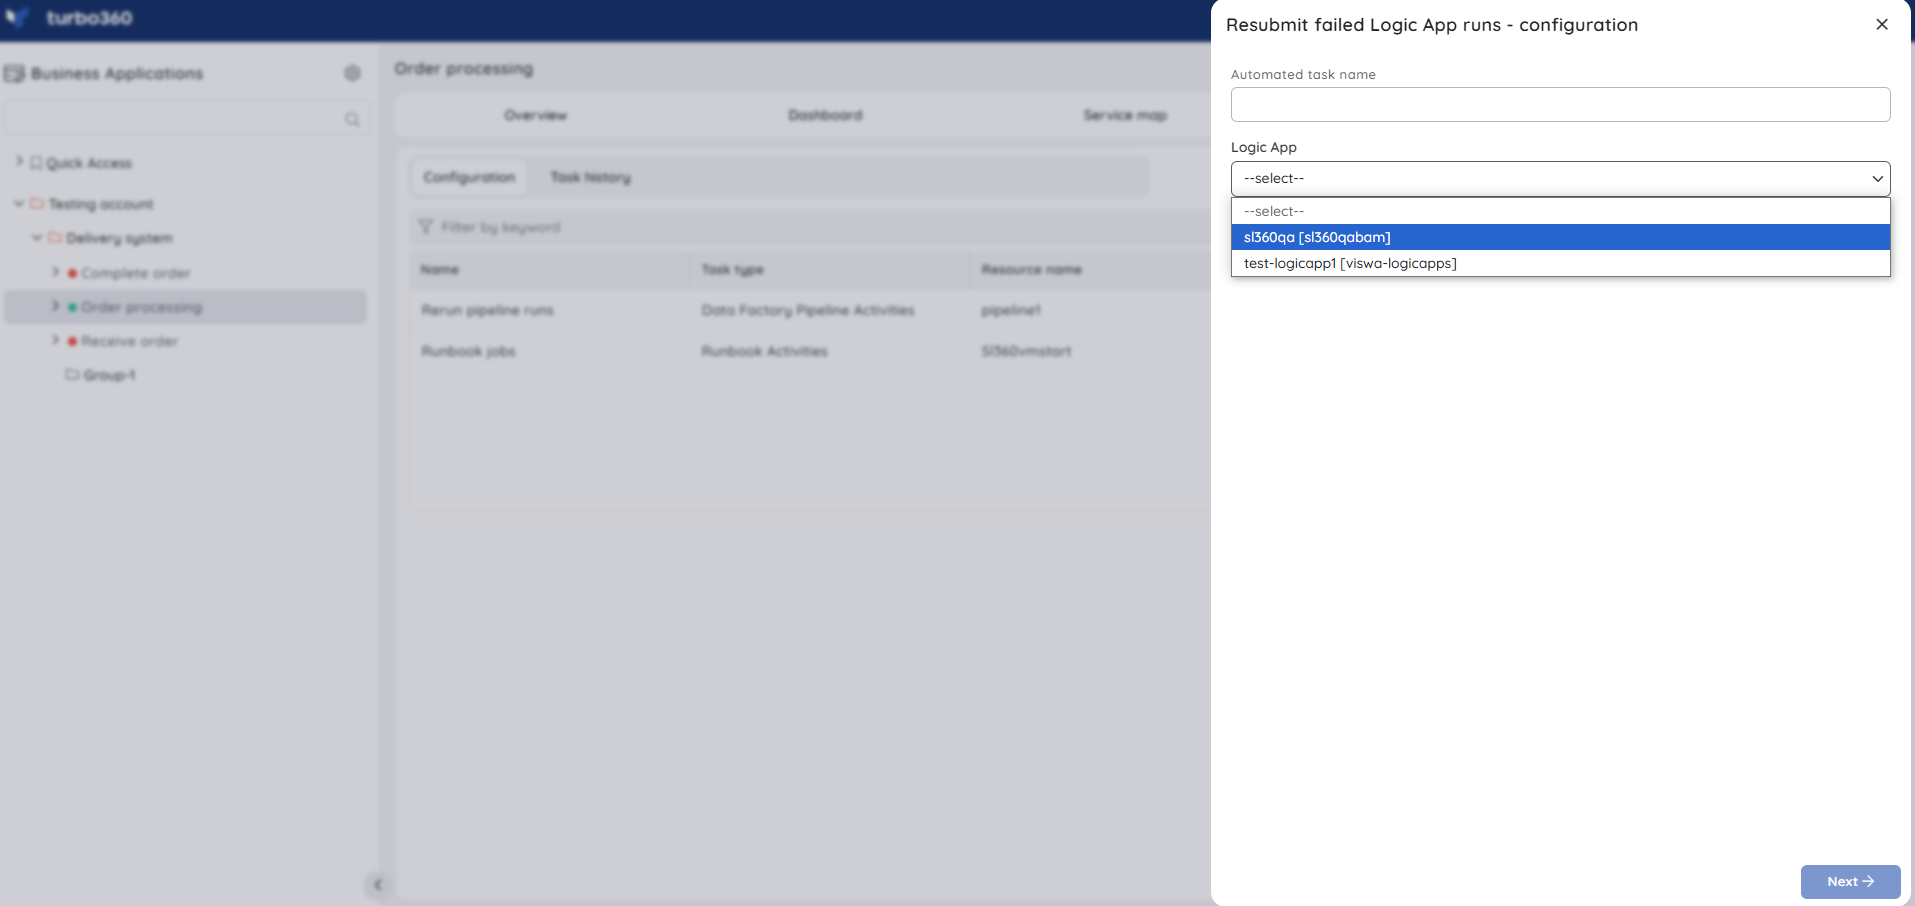
Automated task
Consider an employee management scenario, where the employee joining process in an organization is defined in a Logic App. When an employee joins an organization, a message with required employee details will be pushed into a Service Bus Queue by the HR application.
A Logic App will be listening to the Service Bus Queue for messages.
Whenever a message arrives in the Service Bus Queue, the Logic App will extract the message body of the Service Bus Message and post it to an Azure Function and store it in a Storage Table for future references.
The Azure Function will process the Employee details and assign them to the required departments in the organization.
In the example above, what if the Logic App encounters an error and needs to be resubmitted to fix it?
Turbo360's Automated Tasks enable users to set up automatic resubmission of failed runs for a specific duration and logic app.
Resource dashboard
A default resource dashboard is available for Logic App resources in the Overview section, allowing for enhanced data visualization and tracking of real-time data.
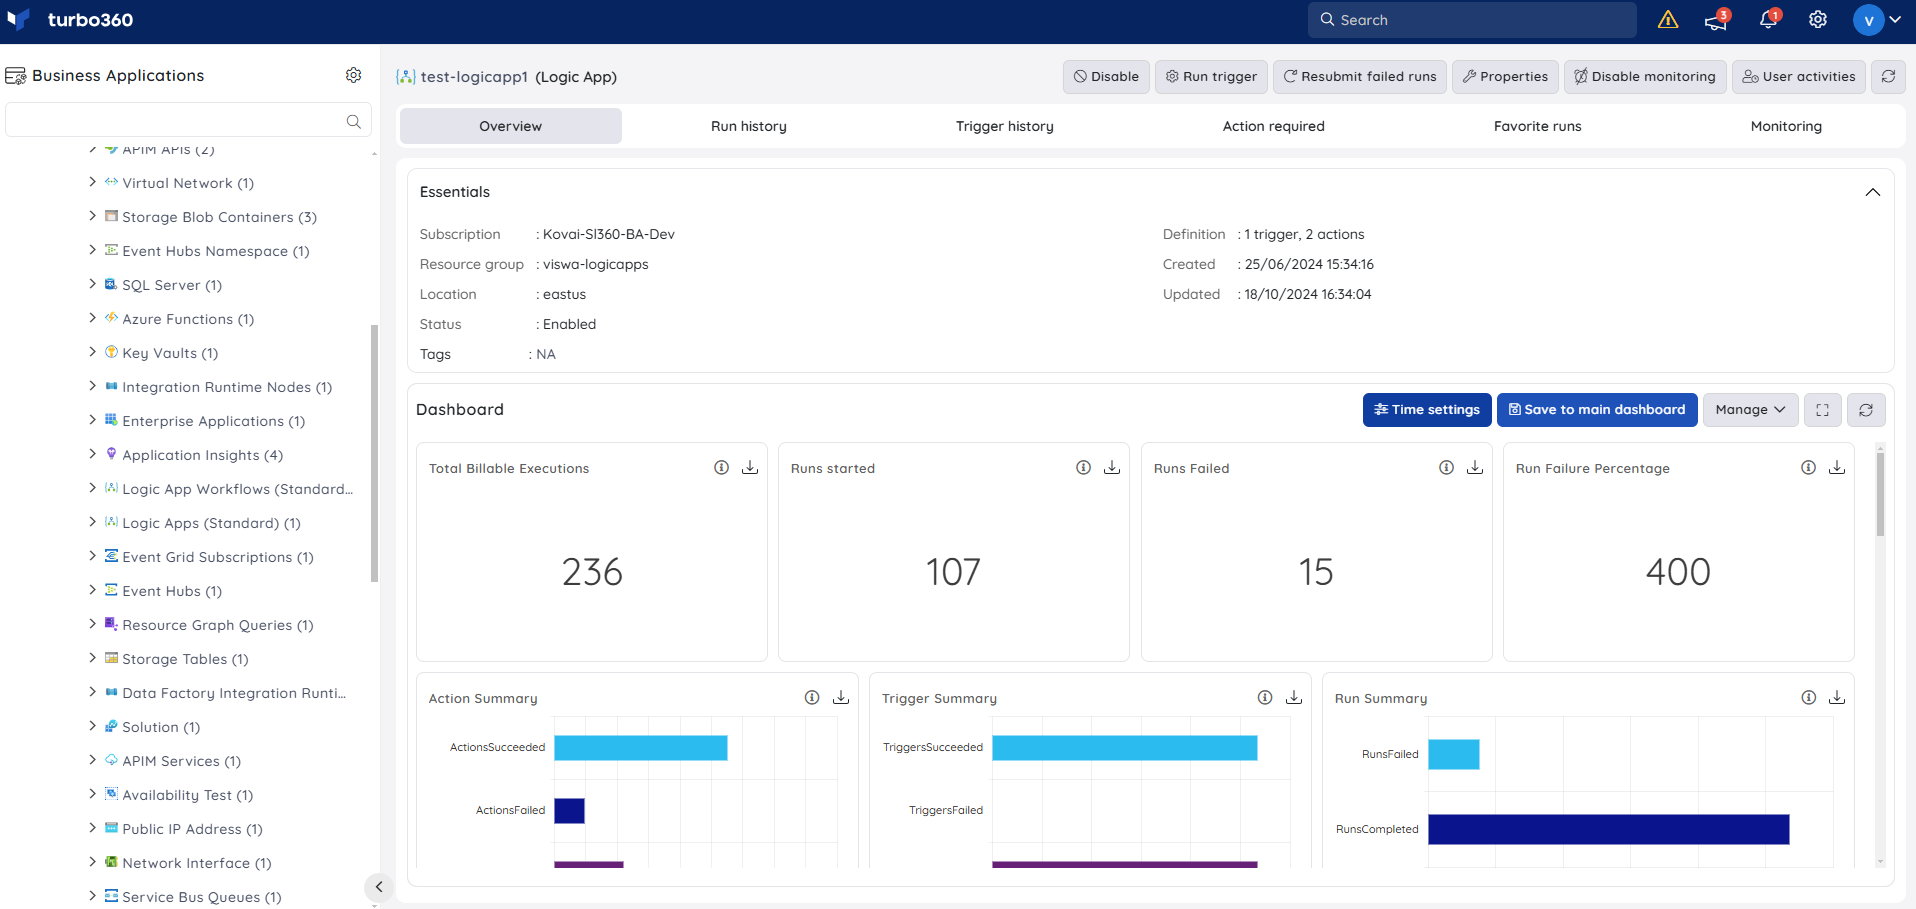
Users are provided with the following pre-defined Dashboard widgets, which can be customised to meet their specific needs.
1. Total Billable Executions
2. Runs started
3. Runs Failed
4.Run Failure Percentage
5. Action Summary
6. Trigger Summary
7. Run Summary
8. Action Success Vs Failure
9. Trigger Success Vs Failure
10. Run Success Vs Failure
11. Consumption By Type
12. Failure Summary
13. Performance By Latency
14. Success Latency
Monitoring
Logic App metrics and runs count can be monitored using Turbo360.
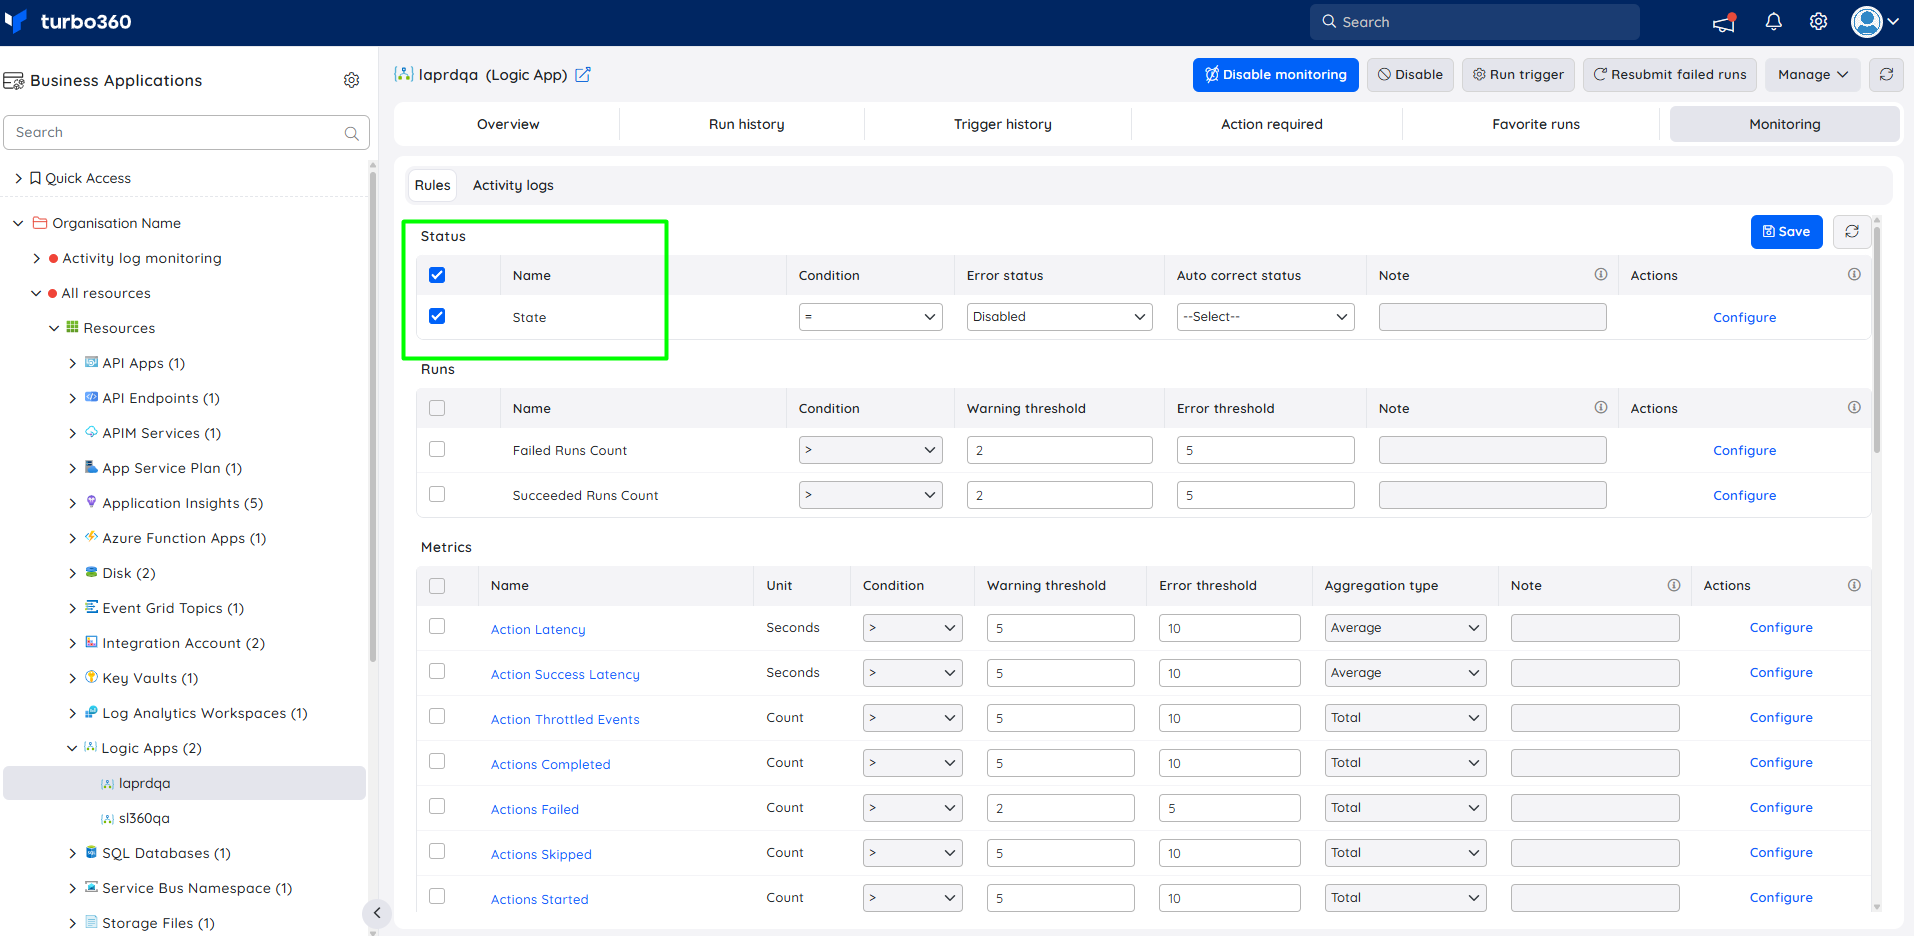
State monitoring
The status of a Logic App can be monitored to track its current state and ensure it is running as expected.
- Navigate to Logic App -> Monitoring
- Configure the state rule under Status with the desired threshold
- Click Save
Metric monitoring
Logic App metrics can be monitored to gain visibility into performance, usage patterns, and overall execution behavior.
- Navigate to Logic App -> Monitoring to configure the monitoring rules for Logic Apps
- Select the necessary monitoring metrics and configure the threshold values
- Click Save
The threshold values can also be provided with any metric name, defining the monitoring rule to be violated when the metric value configured at threshold field is met.
.png)
Monitoring rules will be saved for Logic App, and the monitoring state for the metrics will be reflected after every monitoring cycle.
Runs monitoring
The success and failure counts for a Logic App can be monitored to track execution outcomes and overall workflow health.
- Navigate to Logic App -> Monitoring to configure the monitoring rules for Logic Apps
- Choose between Failed Runs Count and Succeeded Runs Count under Runs category and configure the threshold values.
- Click Save to apply monitoring ules.
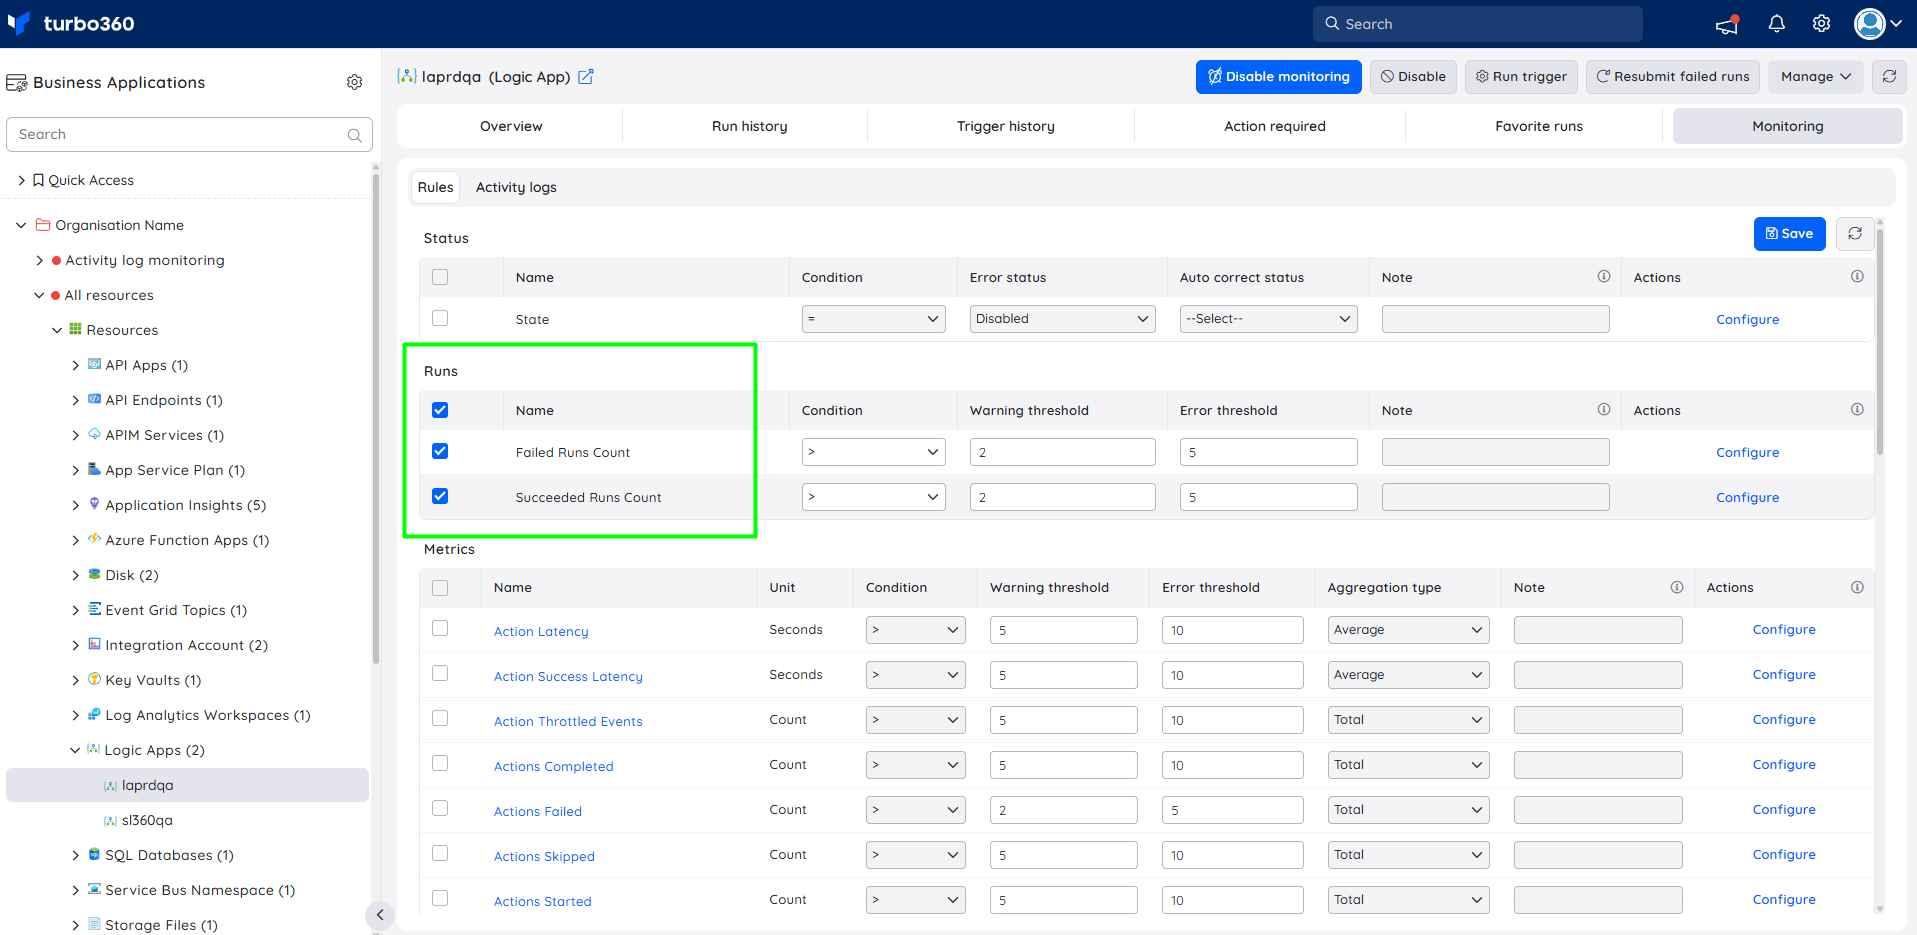
Runs monitoring will be initiated, and the failed runs health state and the failure count will be reflected after every monitoring cycle.
Monitoring recommendations
This section contains the common settings for monitoring Logic App consumption.
State
The below picture shows how to configure the monitoring for the state of your Logic App to be in the enabled state. Note you can also configure an auto-correct state to make Turbo360 change it back to enabled if it is disabled.
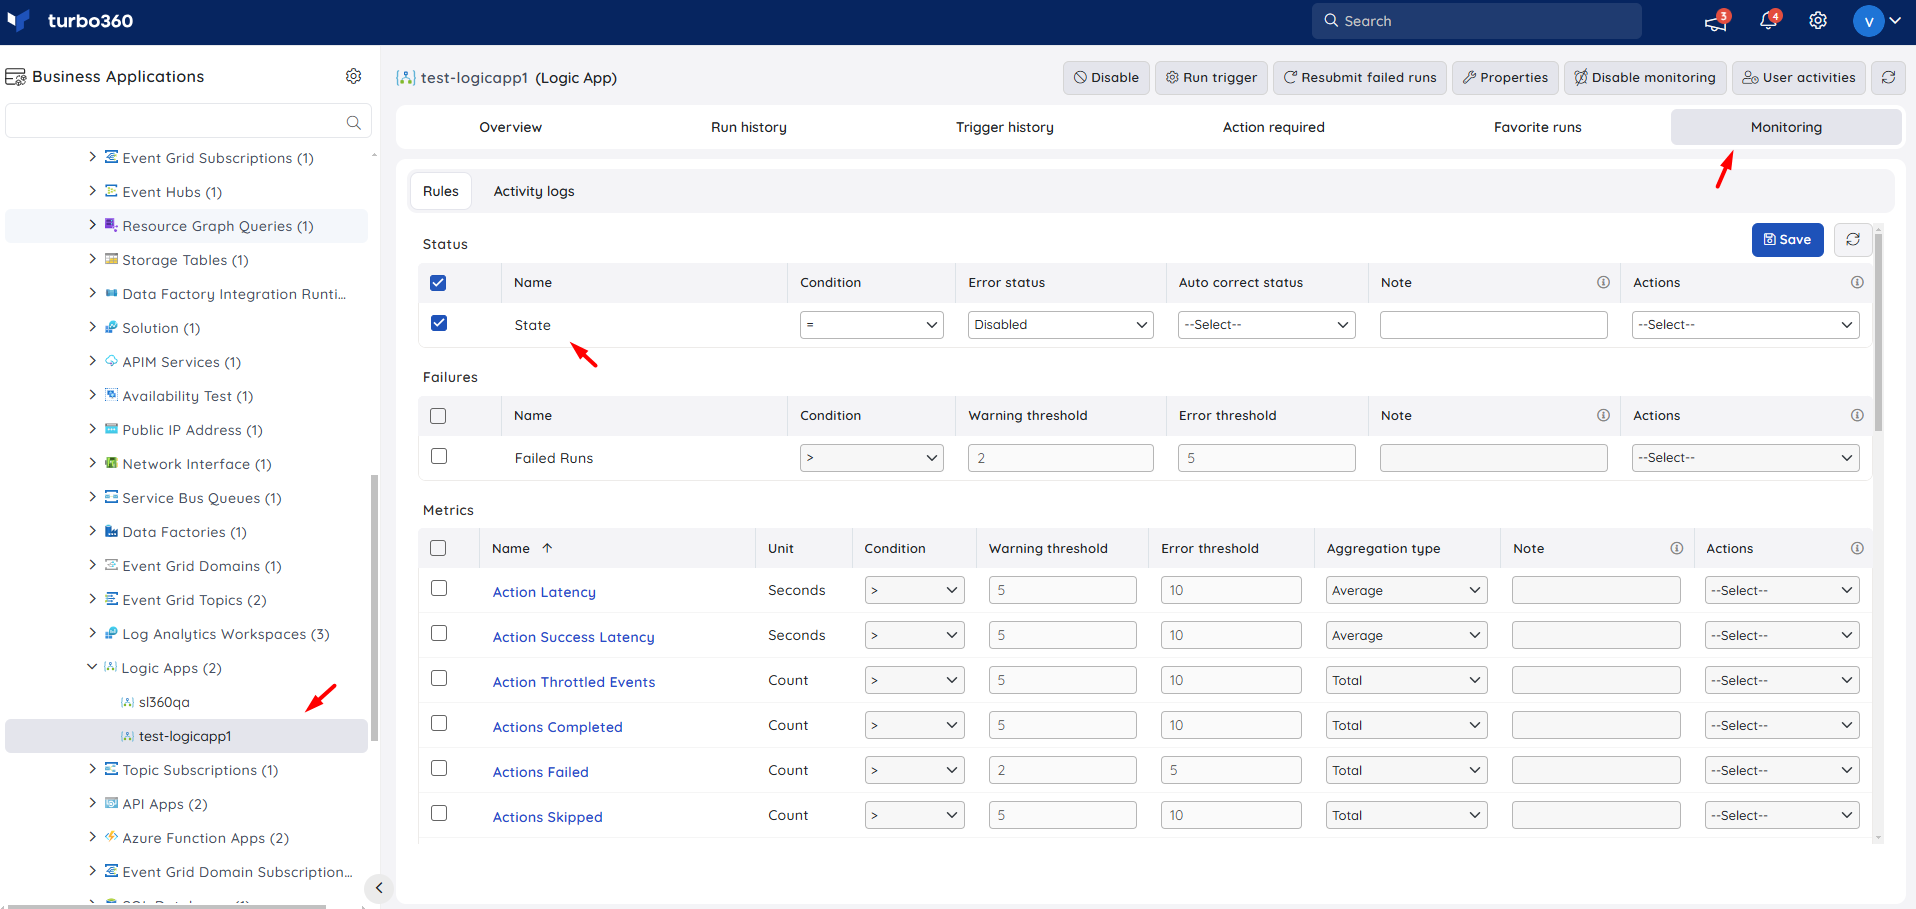
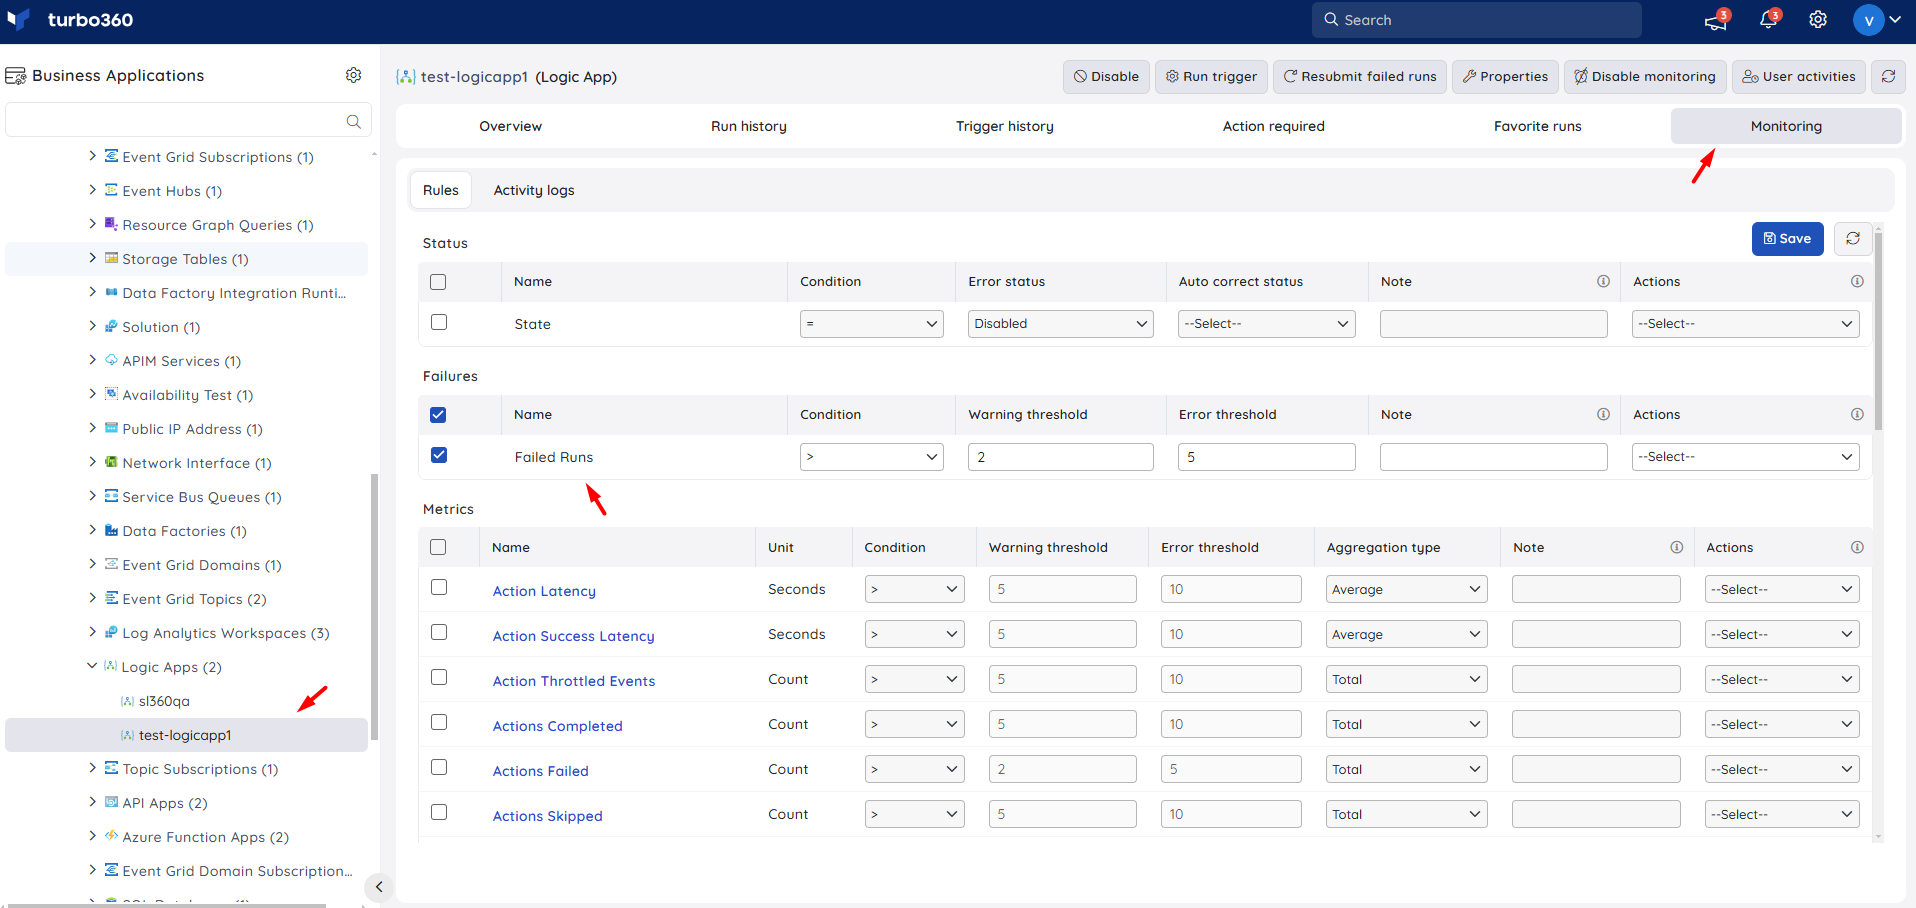
Failures
Failure monitoring will examine the run history API for your Logic App. You can configure the number of errors since the last monitoring check, which will trigger alerts indicating that your Logic App is unhealthy. The threshold can be adjusted based on the specific needs of your scenario
Metrics
With Turbo360's ability to check the API for run history, the metric counter is not required for monitoring. However, there are still several metrics you may wish to monitor, as shown below.
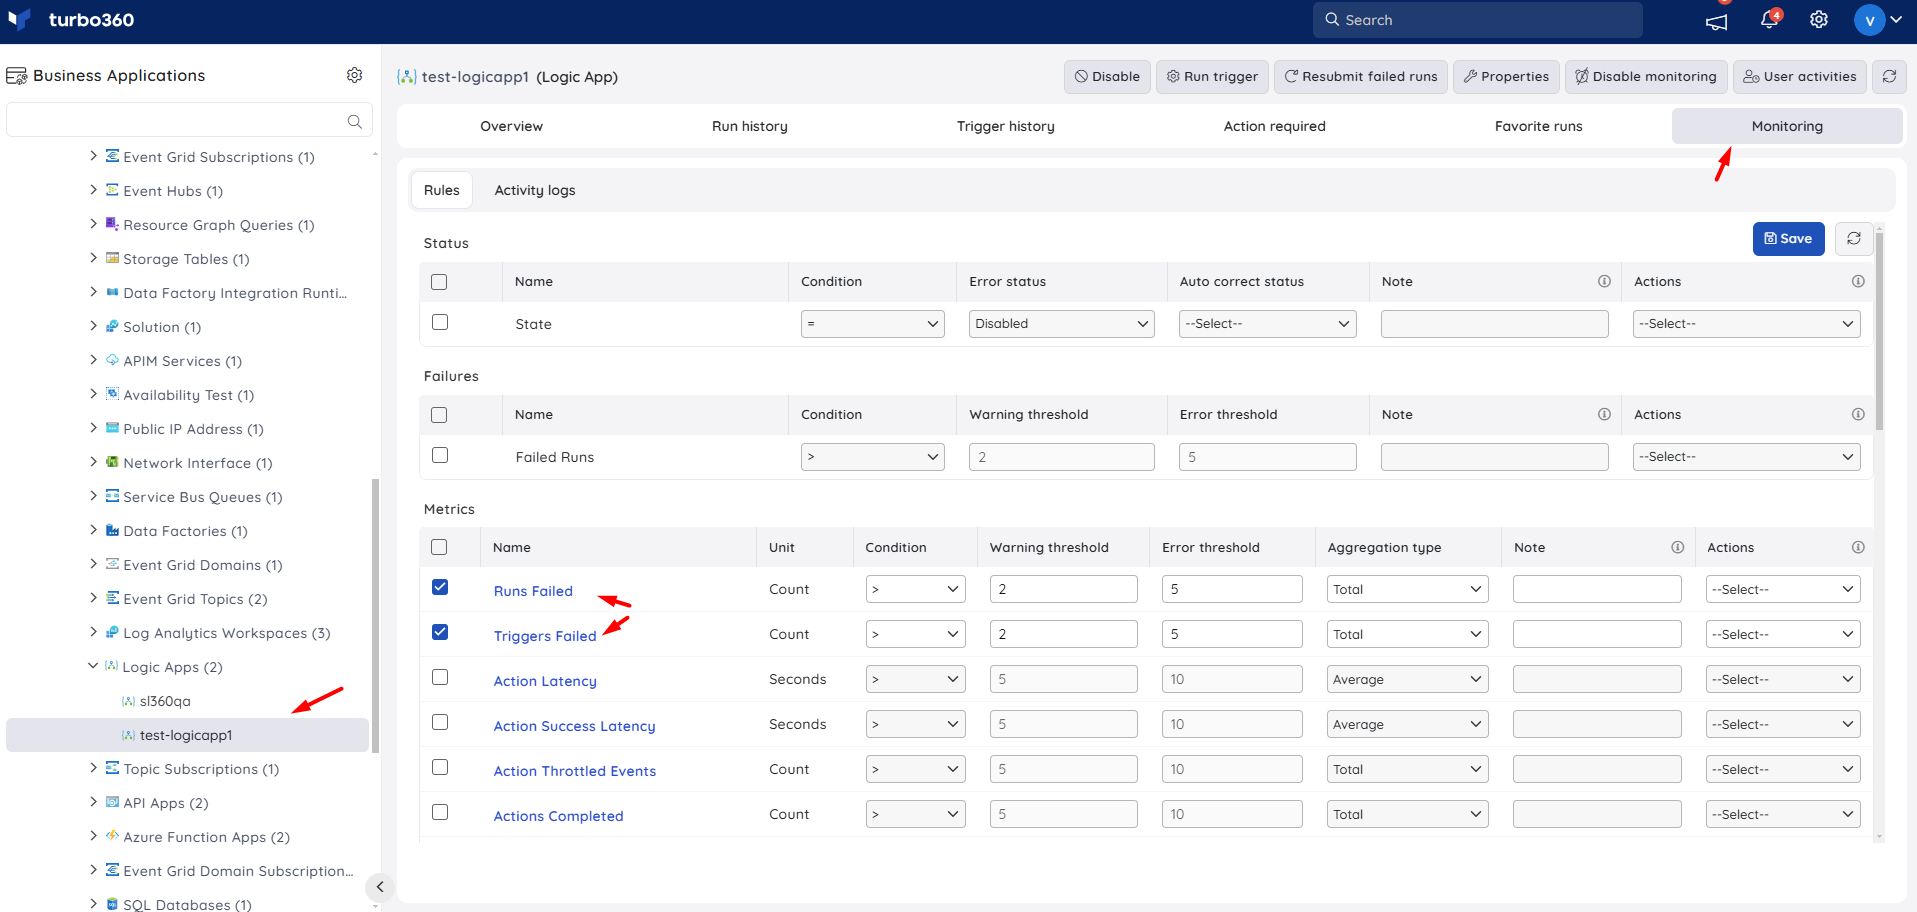
- Run Latency is the average duration of your Logic App runs. If you want to get alerts if this metric is changing from the normal value then you may want an alert
- Triggers Failed is a common metric is you are doing something like polling service bus and you have a connectivity error you would see this counter increase
Was this article helpful?