- 13 Nov 2025
- 5 Minutes to read
- Print
- DarkLight
- PDF
Managing Groups
- Updated on 13 Nov 2025
- 5 Minutes to read
- Print
- DarkLight
- PDF
Introduction
Cost Management Groups can be created to organize the Azure Subscriptions and perform Cost Analysis, Cost Monitoring, and Cost optimization on them.
A Cost Management Group can contain multiple sub-groups.
Overview
The Overview section delivers a dual view:
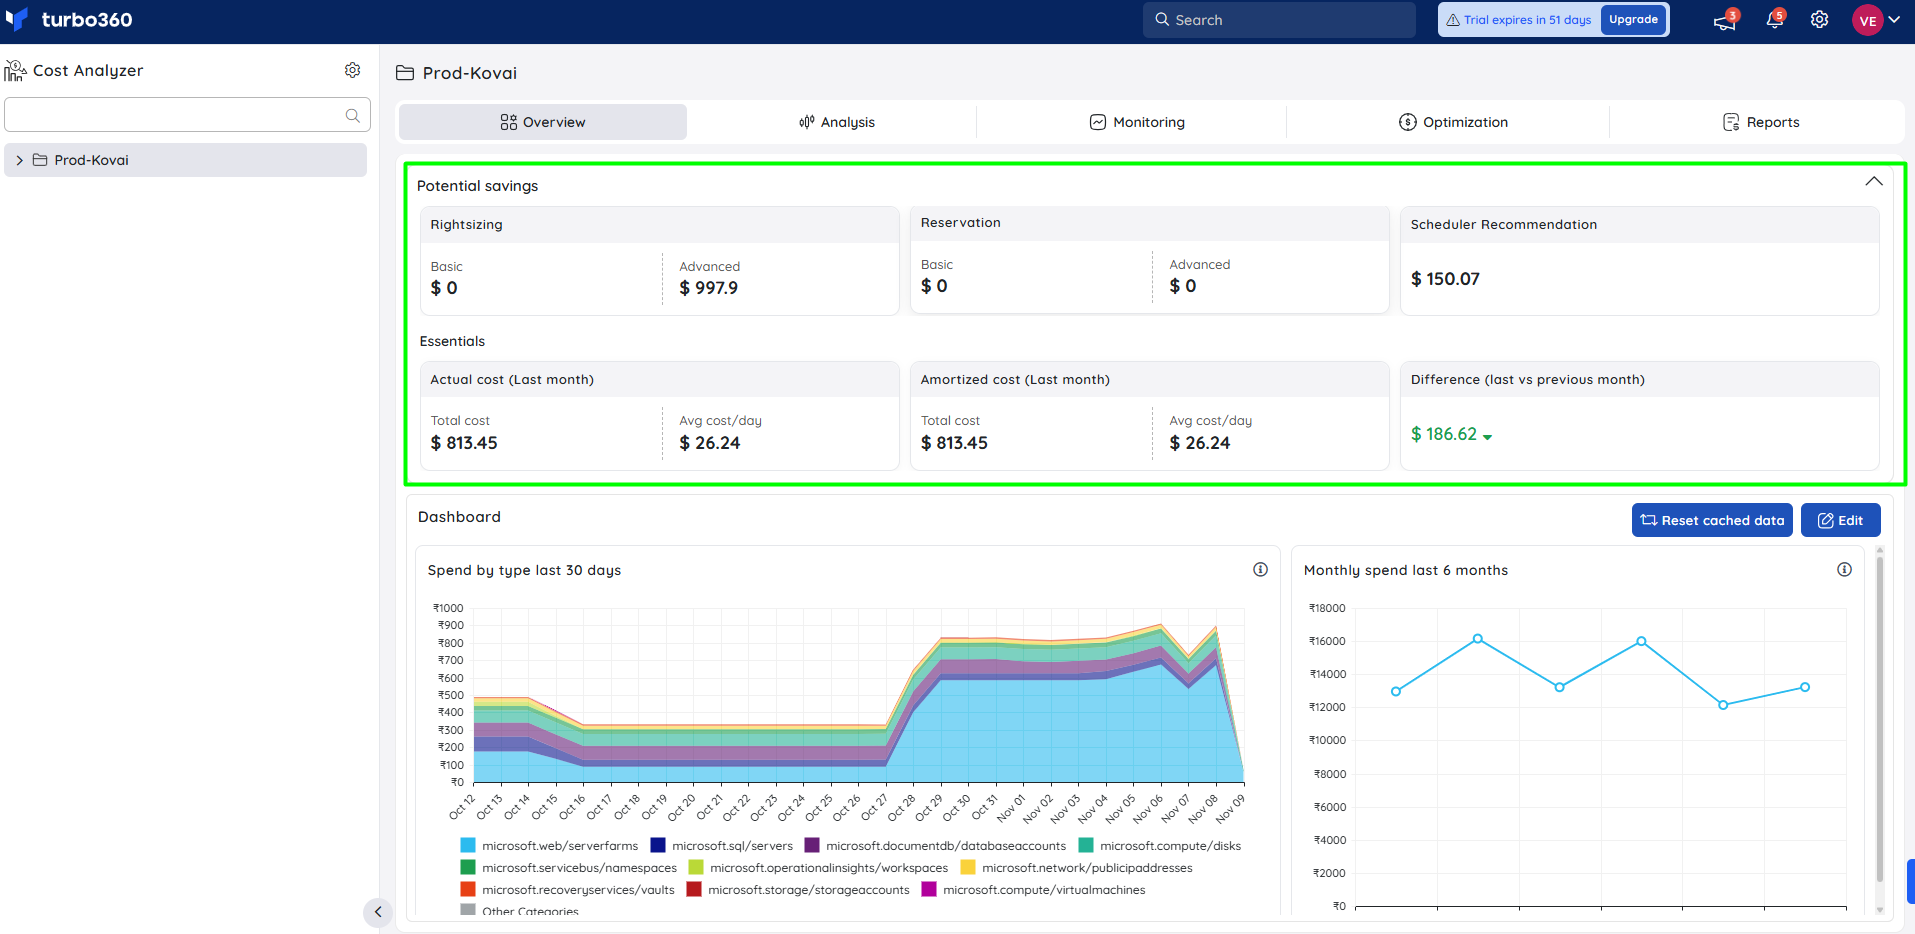
i) Potential savings
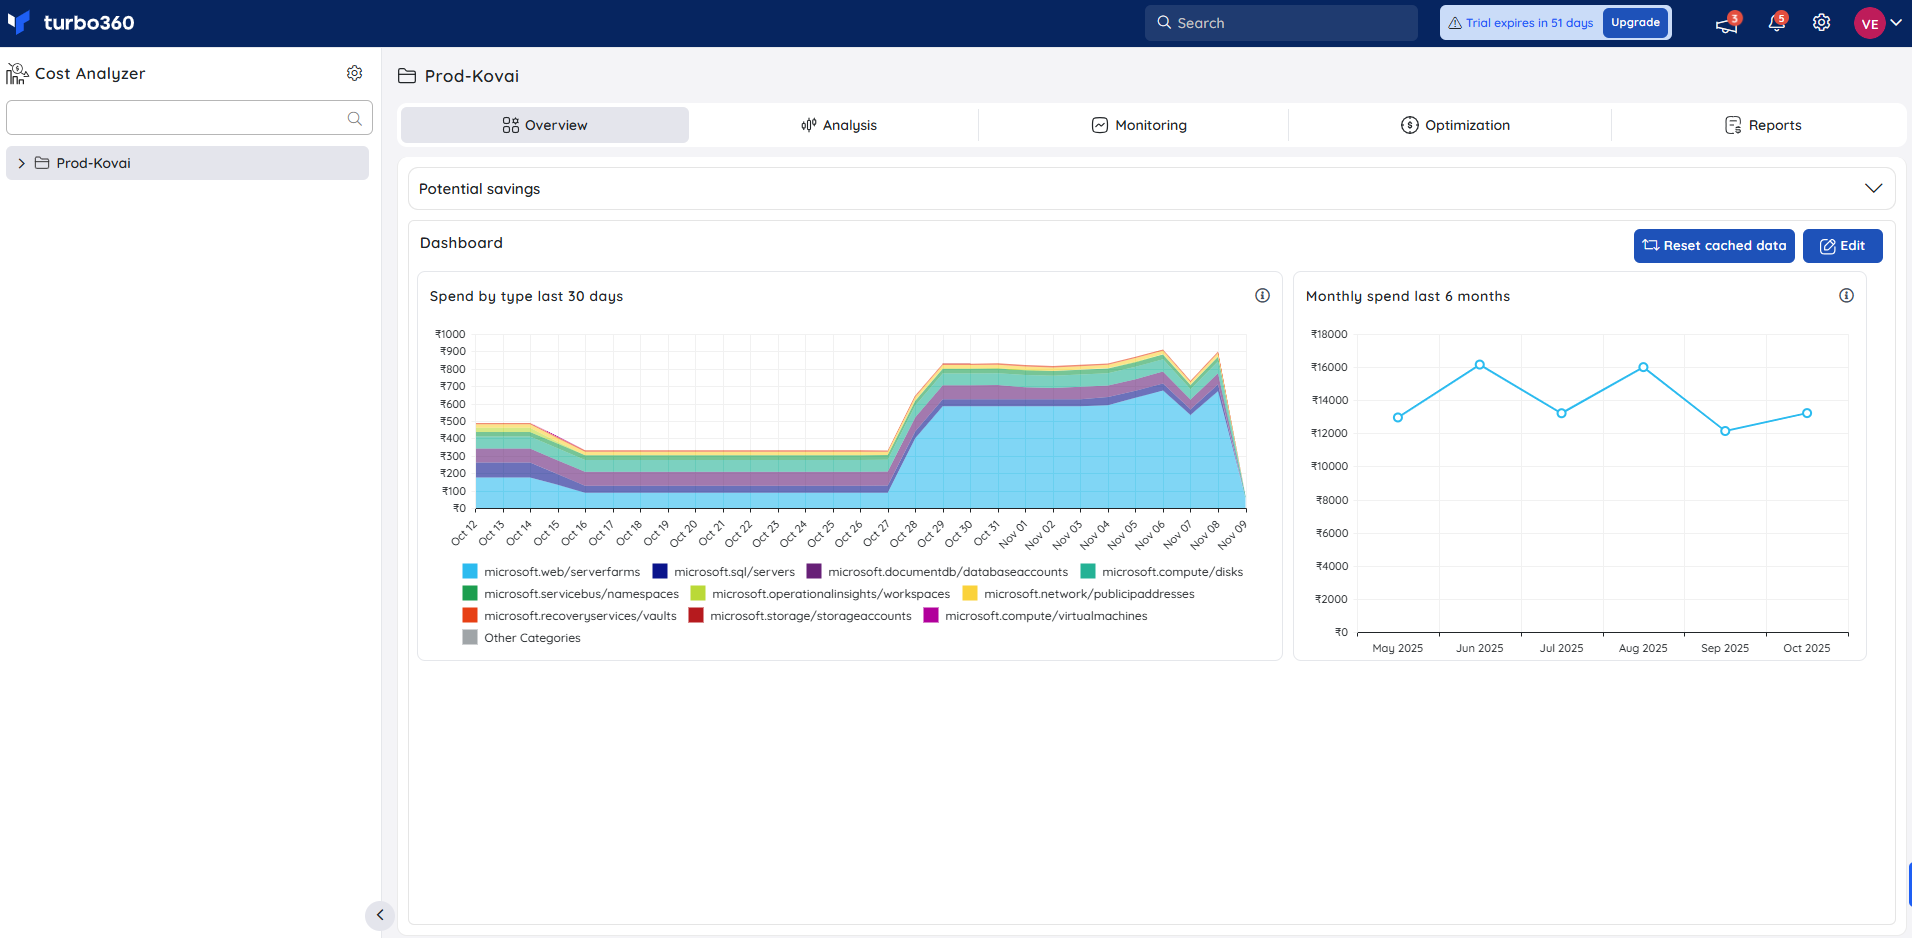
ii) Dashboard
i) Potential savings - In the Potential savings panel, users can access a concise snapshot of their subscription’s cost dynamics—showing last month’s total expenditure, a comparison with the prior month, and visual indicators of cost increases or decreases. The view also presents potential savings opportunities through rightsizing, reservation acquisitions, and schedule‑driven optimizations.
ii) Dashboard - The dashboard offers a couple of preset cost charts including Cost spend for last 30 days grouped by type and Monthly spend for last 6 months.
Dashboard management
The data points of the cost charts can be clicked to expand the cost based on different categories.
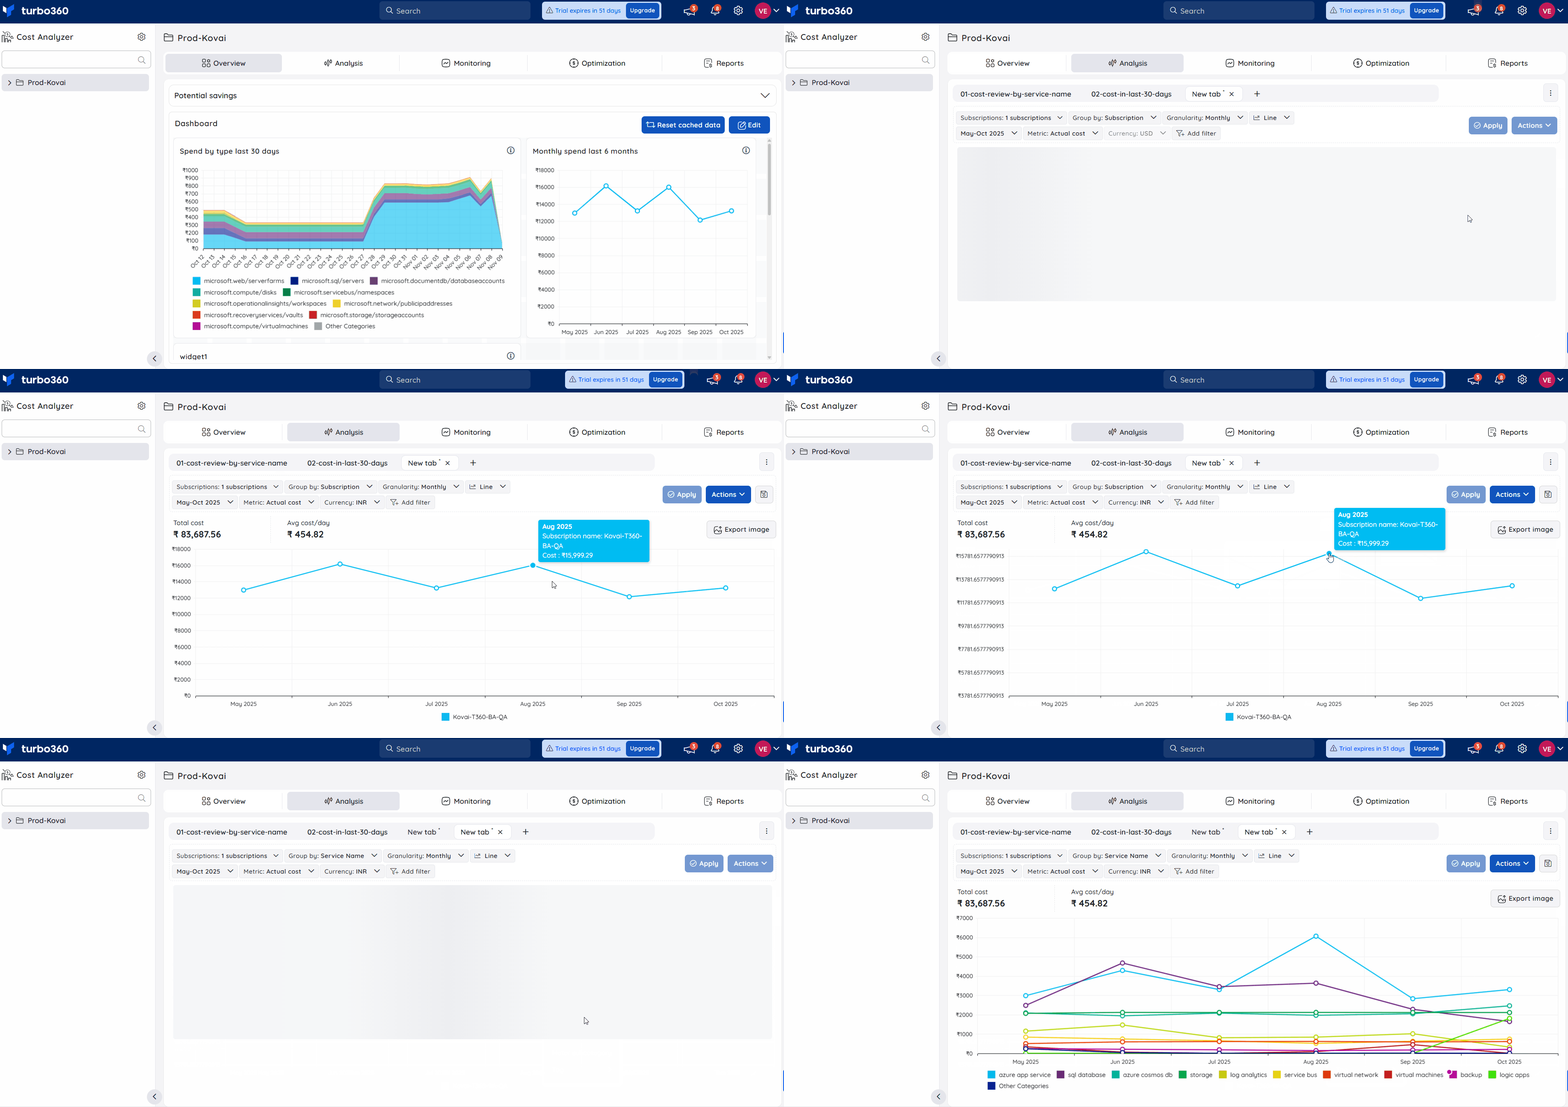
Adding a widget
In addition to the existing widgets, new ones can be added to the dashboard.
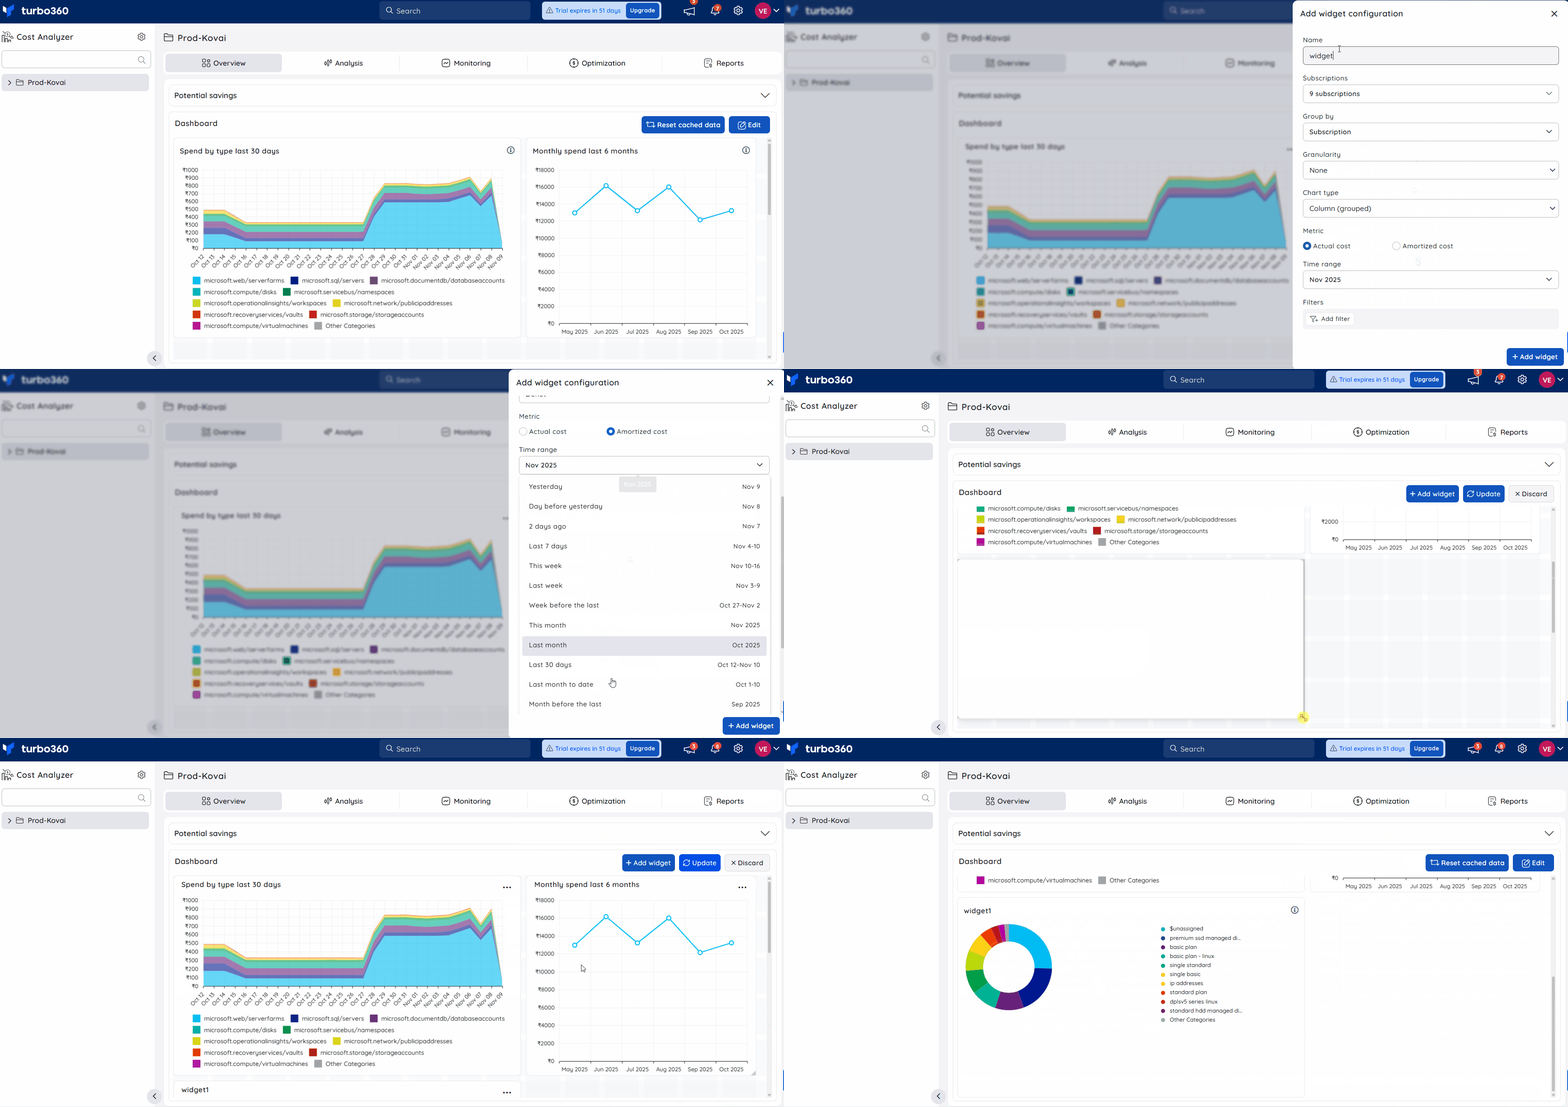
- Click the Edit option in the Cost group Dashboard
- Click Add widget
- Enter a distinct name for the widget
- Select the list of subscriptions from the Subscriptions dropdown to visualize the cost data
- Choose an option in the Group by dropdown to group the cost data based on the selected option
- Select Granularity
- Choose one among the list of available chart types
- Select the cost type
- Select a time range to display data only from the selected time frame
- Filters can also be applied to view any specific cost data
- Click Add widget
- Click Update button in the dashboard
Dashboard does not support Area chart when the Granularity is set to None.
The below illustration depicts adding a new widget to the dashboard.
Editing a widget
- Click the Edit option in the Cost group Dashboard
- Click Edit in the widget context menu
- Modify the desired configuration values and click Update in the edit blade.
- Click Update in the Dashboard
Deleting a widget
- Click the Edit option in the Cost group Dashboard
- Click Delete in the widget context menu
- Click Update in the Dashboard
Resetting cached data
Why reset cache?
In Cost Analyzer, cached data is utilized to enhance performance and reduce load times. However, this stored data may not always reflect the most recent updates to cost information.
To ensure that all saved widgets in the cost dashboard display the latest and most accurate data, users may need to reset the cache periodically. Resetting the cache forces the system to refresh its data, ensuring alignment with the most current cost records.
Cost Analyzer executes a daily cache reset when the date rolls over.
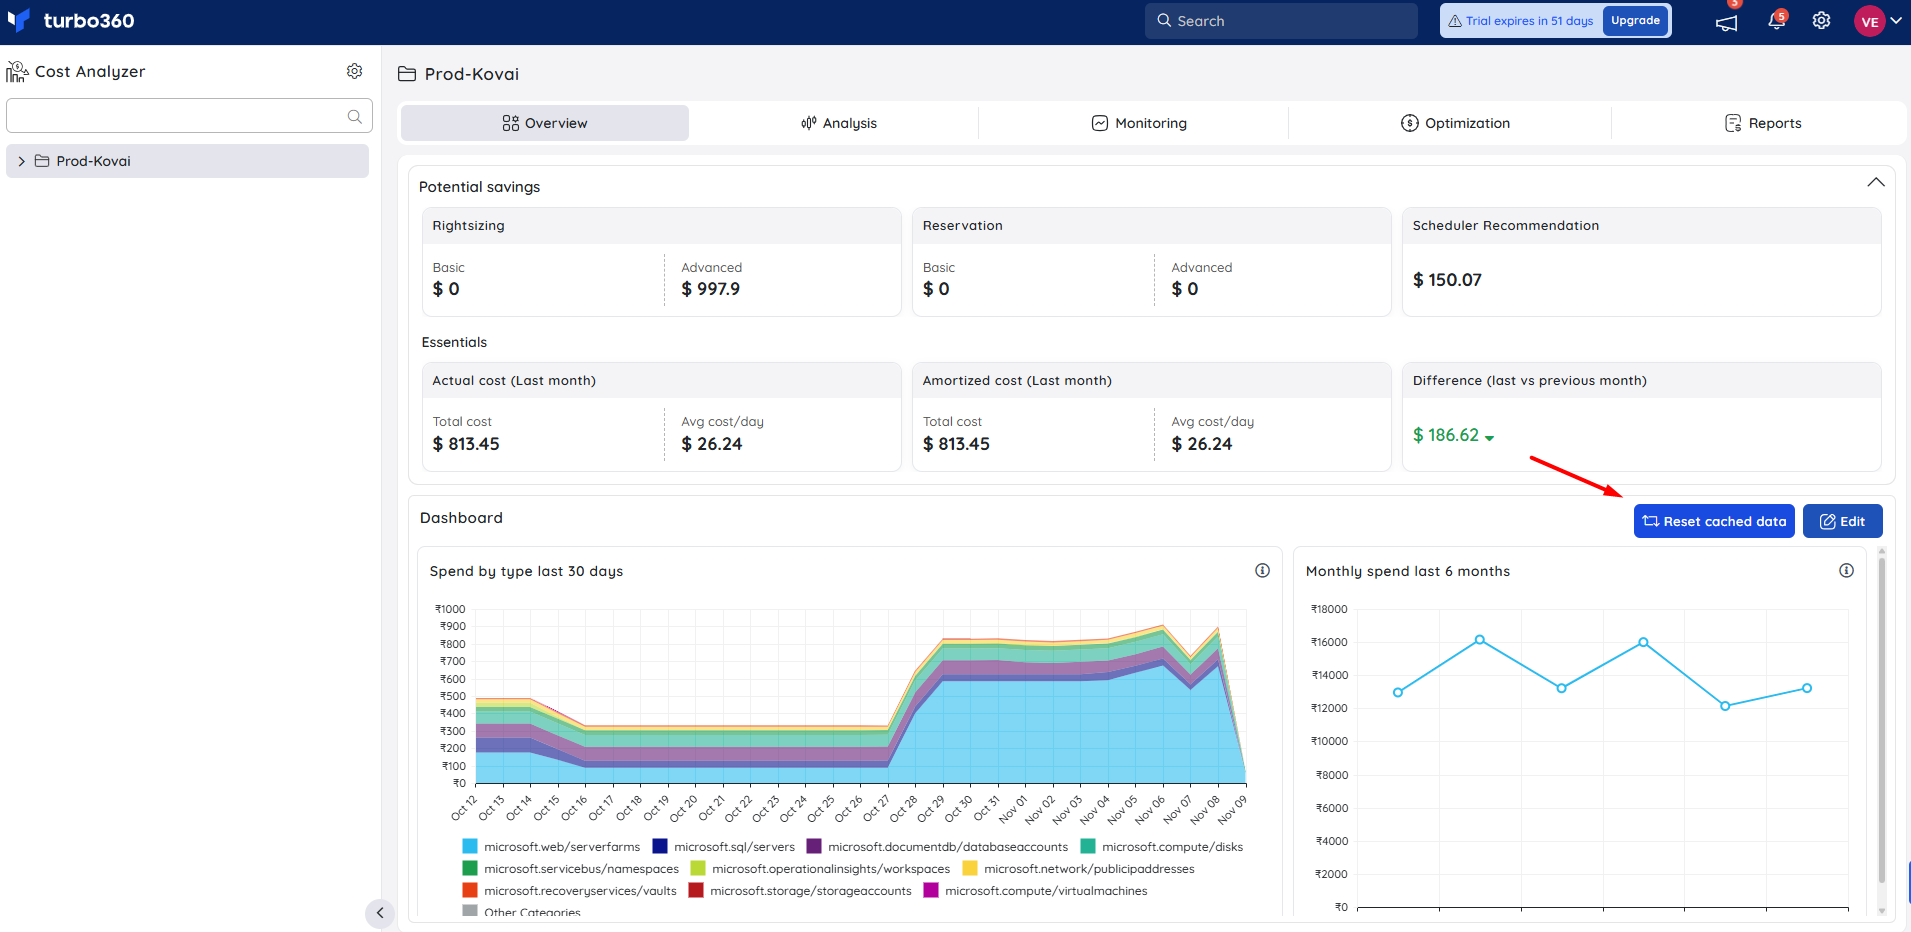
Resetting cached data
- Click on the Reset cached data option available within the dashboard.
When to reset cache?
Users are advised to reset the cache under the following conditions:
- When the displayed cost data appears outdated or inconsistent with recent updates.
- After major modifications to the underlying cost group, such as updated scope.
- When encountering performance issues, delays, or data errors that may be related to cached content.
Create a child group
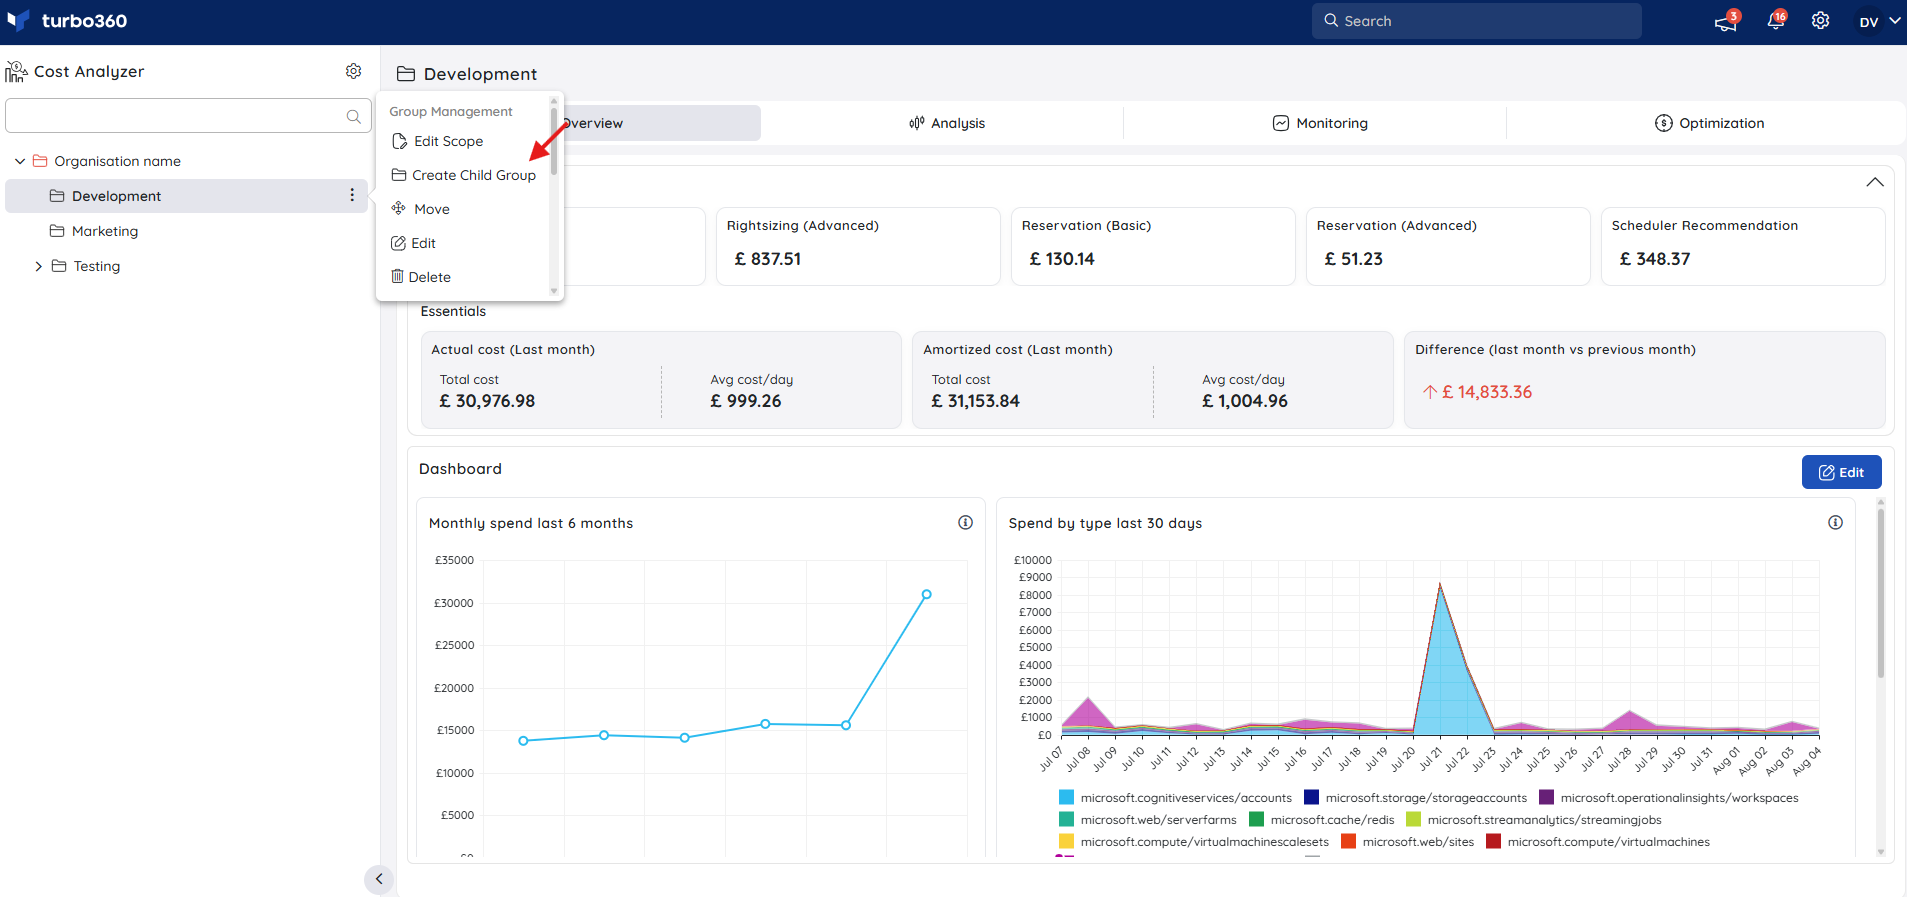
- Click the three-dotted icon next to any group in the tree view to create a new one within that group
- Select Create Child Group
- Enter a name to the group and click Next
- Choose the necessary subscriptions for which the cost data is to be managed within the group
- Click Save
A default analysis view that offers information on the monthly cost of the chosen subscriptions based on a predetermined set of filters will be included when the cost group is created.
Scope selection
Scope selection enables users to analyze Azure costs from a specified location and refine the view to particular targets such as resource groups or subscriptions for precise cost and resource control.
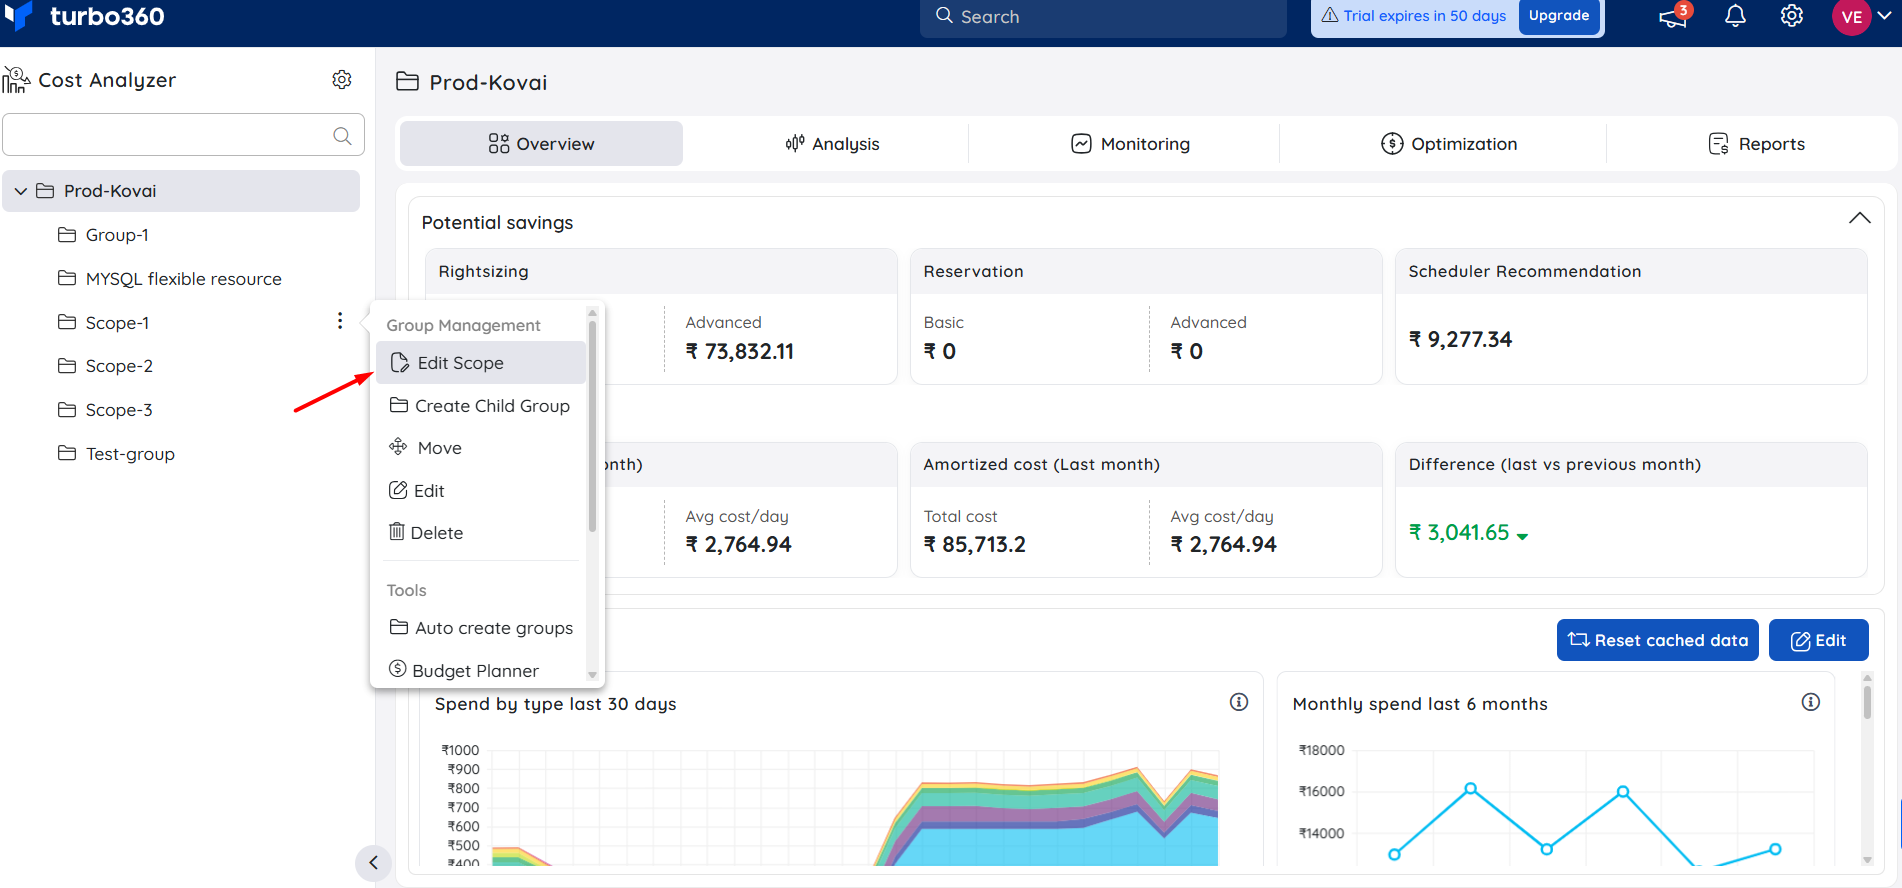
Click the three-dot icon next to the desired group in the tree view.
Select Edit Scope.
Choose the target subscriptions whose cost data should be visible to the corresponding cost management group.
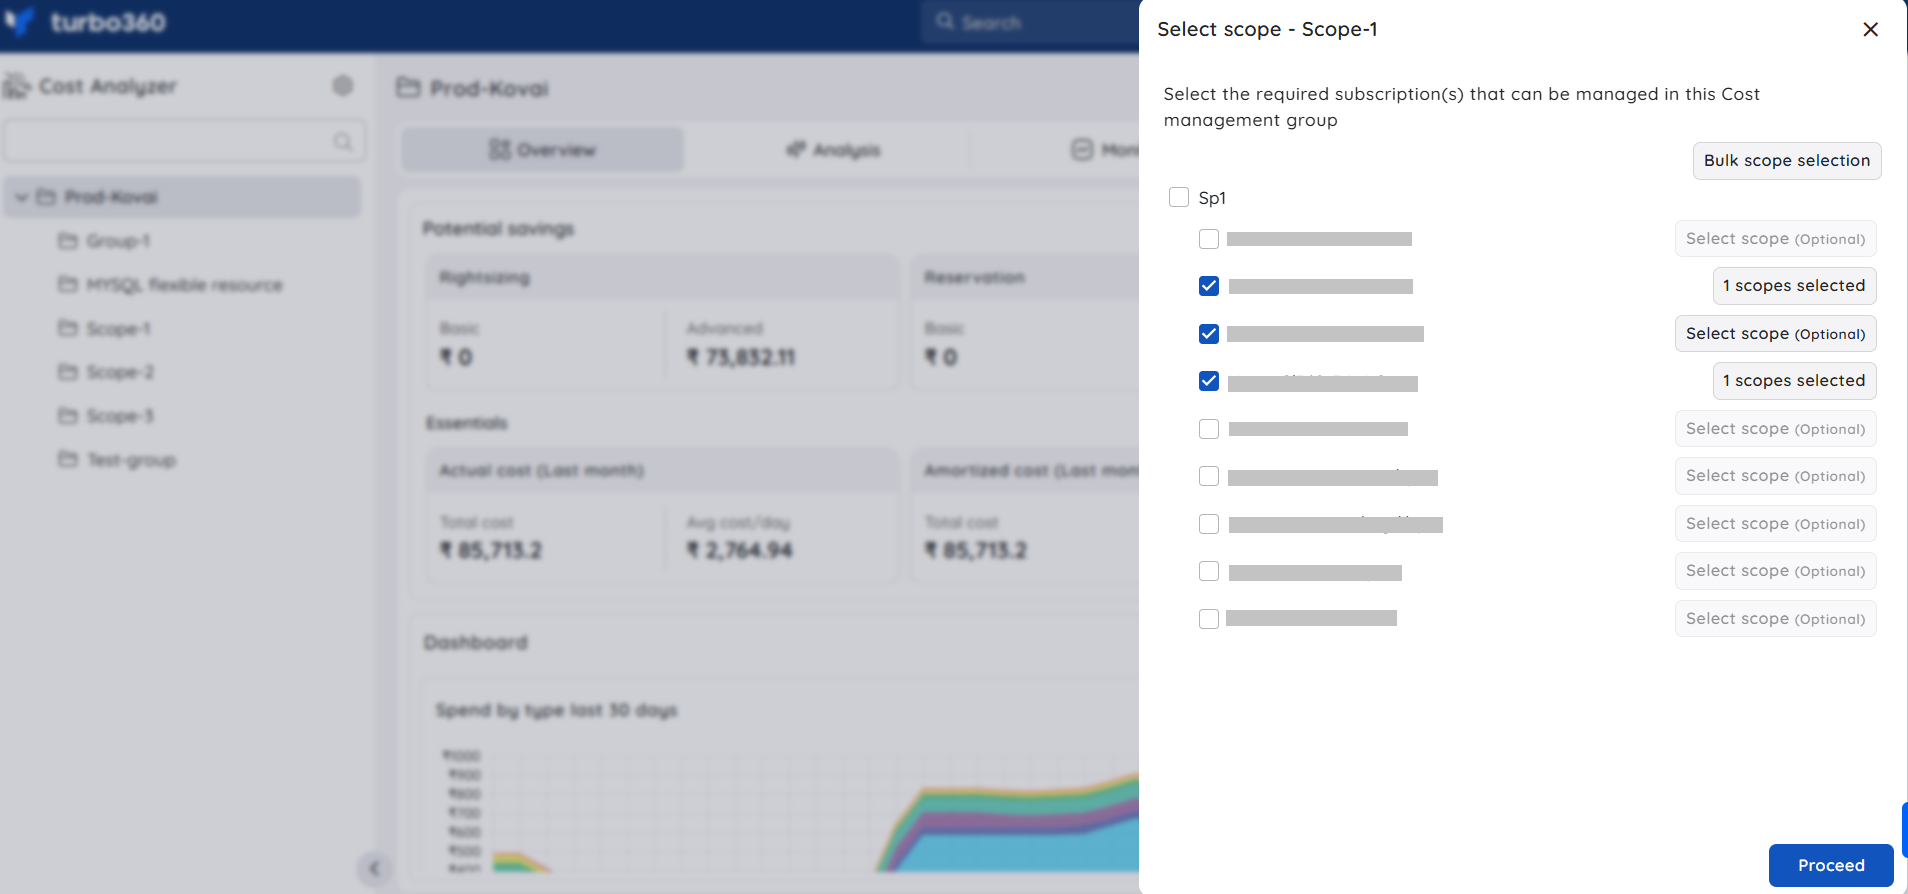
Apply the desired scope to each selected subscription.
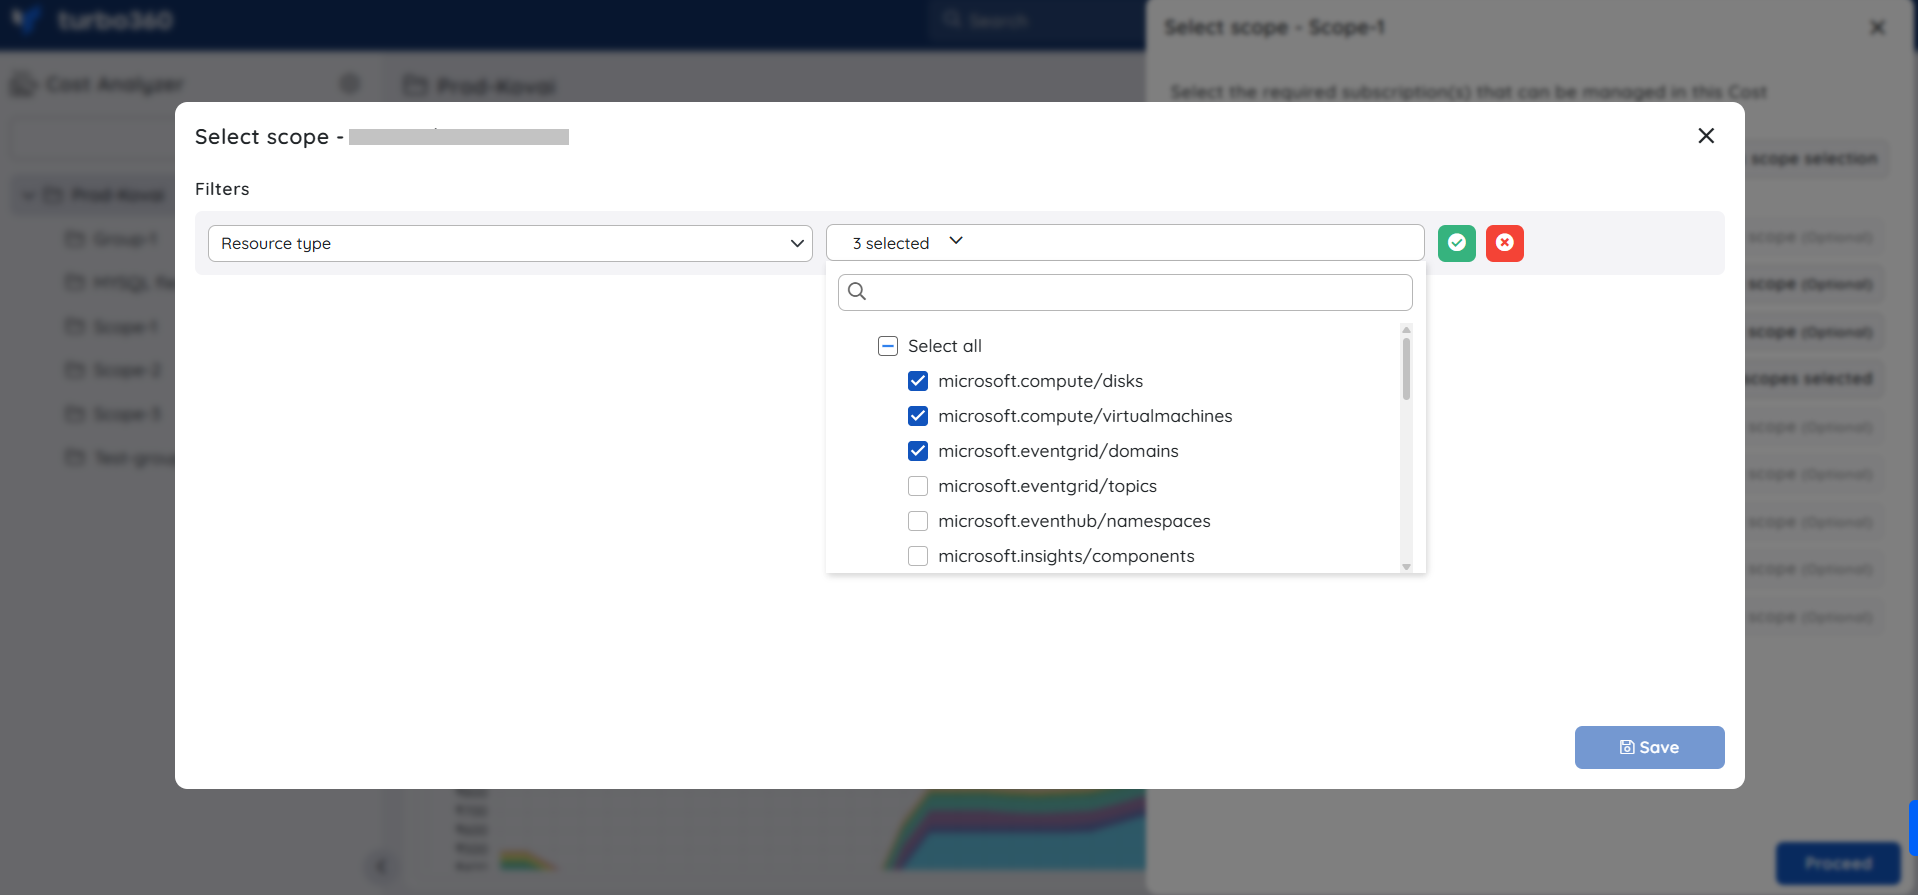
In the confirmation window, click Proceed -> Continue to apply the changes.
Updating the scope selection will only reflect the Unscheduled resources data by the following day at 12 AM UTC.
The bulk scope selection functionality enables users to perform scope updates across multiple subscriptions concurrently.
- In the Scope selection blade, select Bulk scope selection.
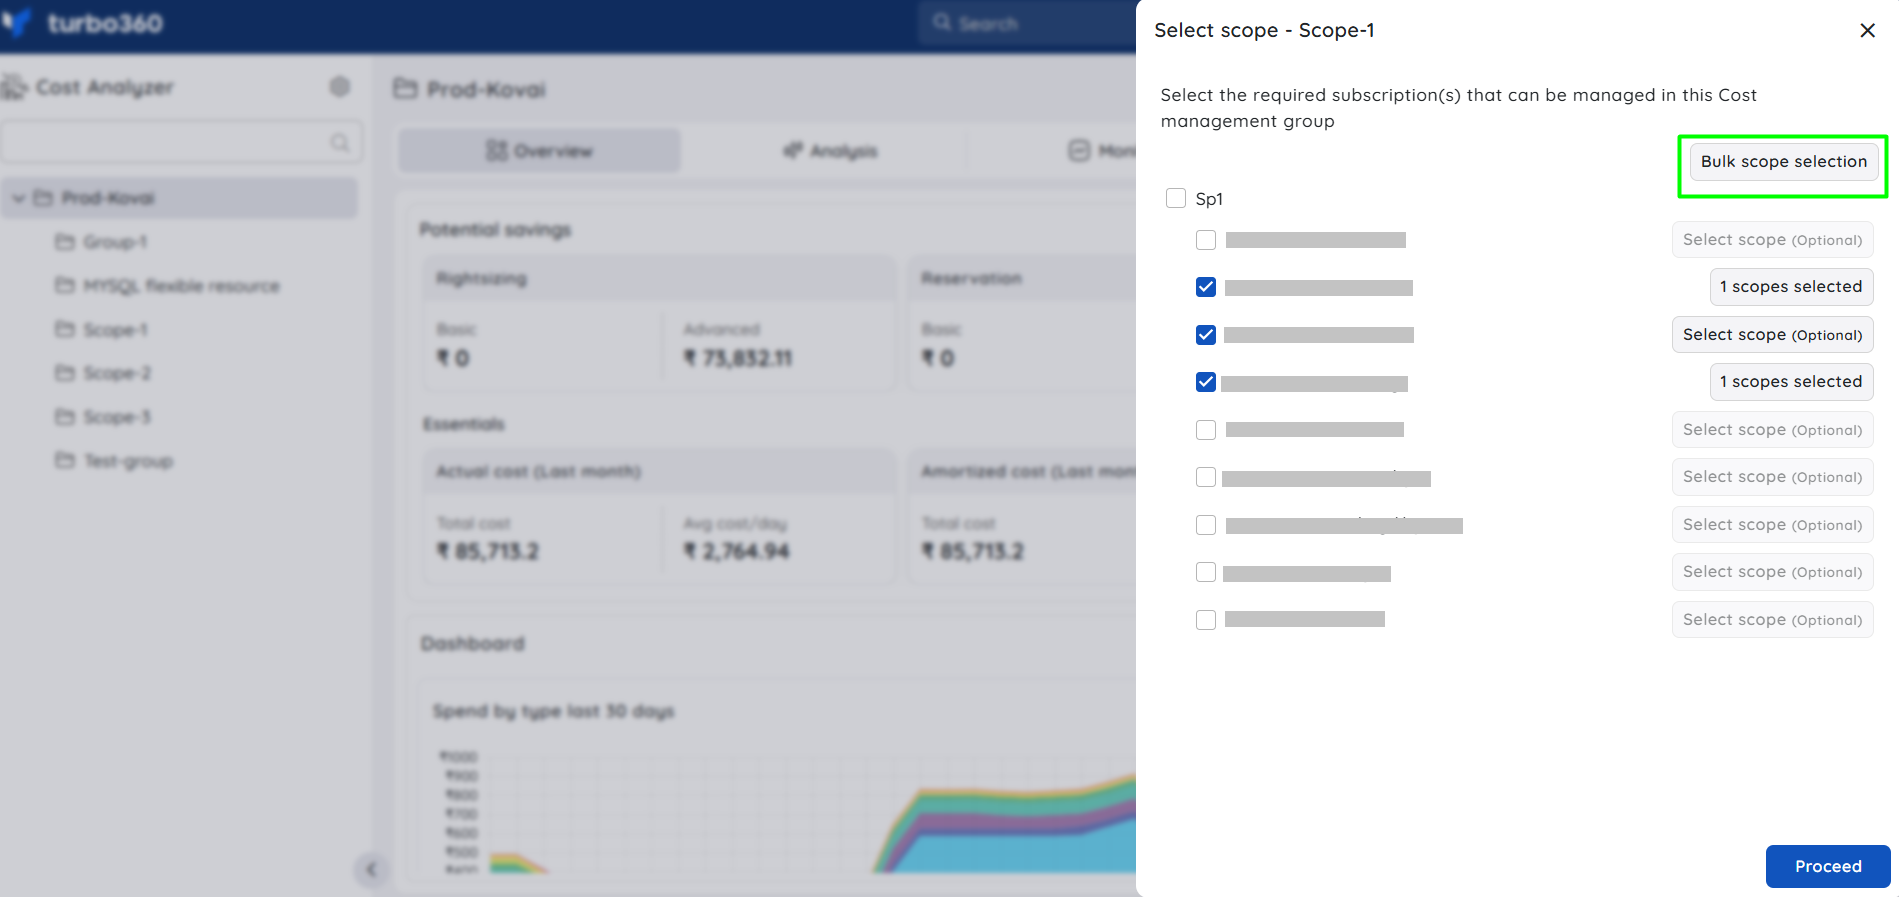
- Choose the target subscriptions to which the scope should be applied.
- Specify a common scope that matches the selected subscriptions.
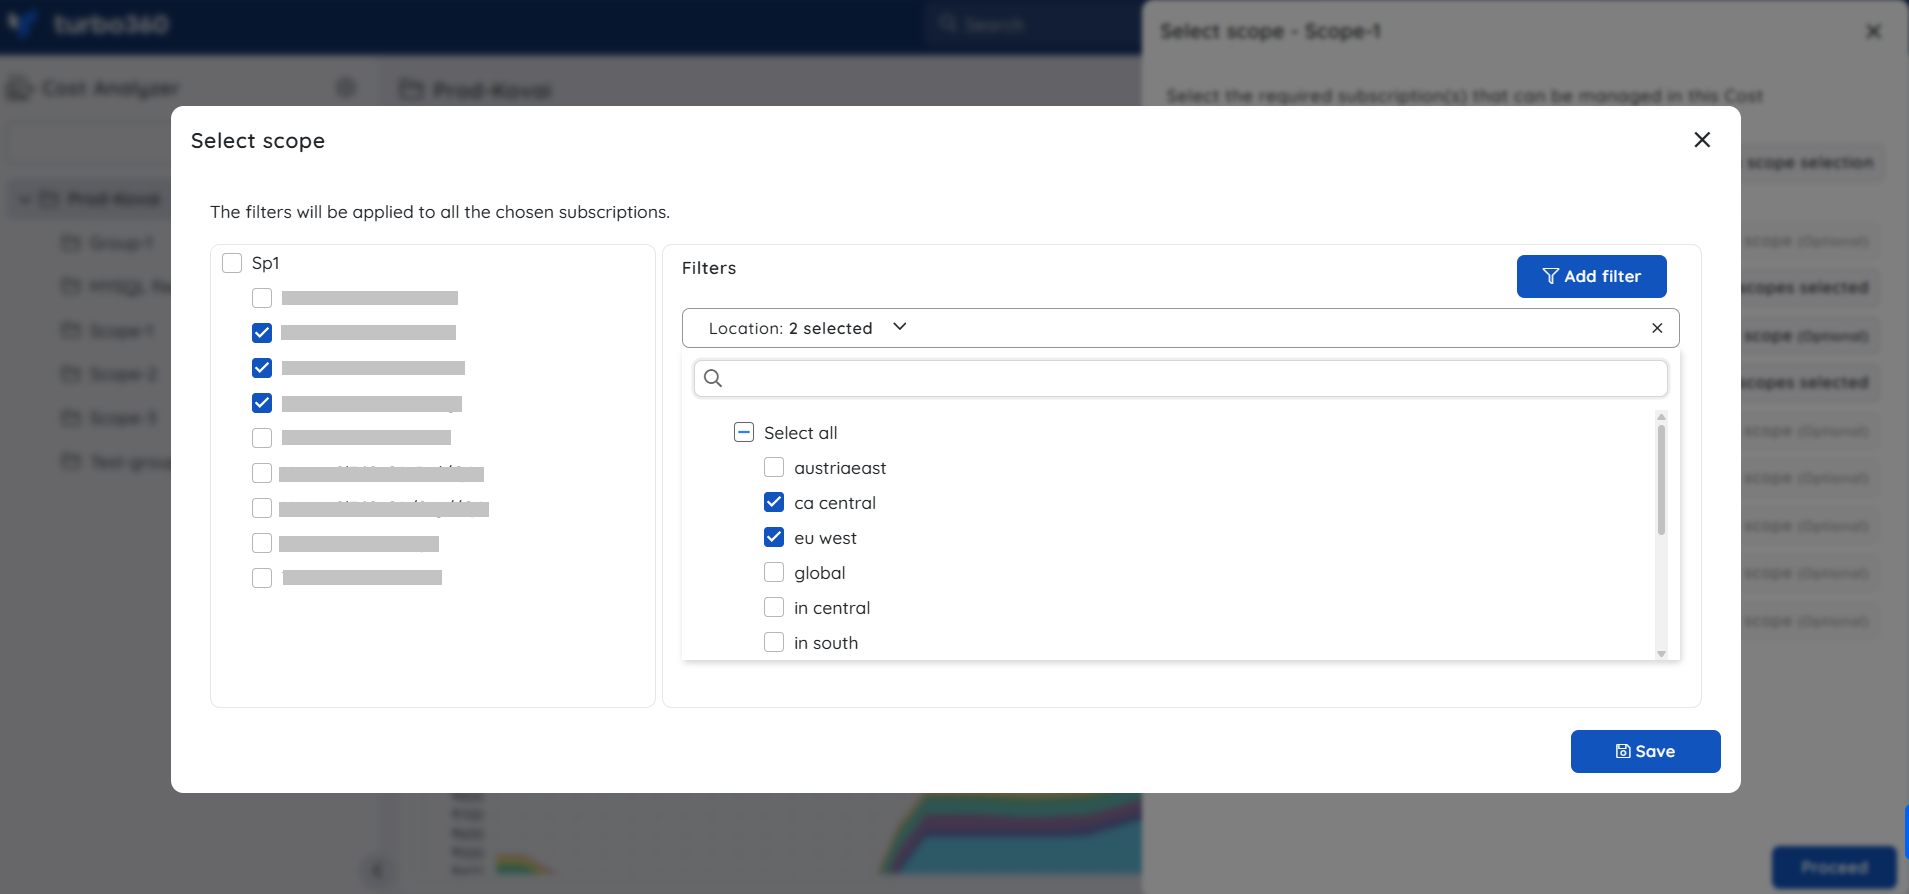
- Click Save.
- To finalize the update, click Proceed → Continue.
Cost uplift adjustment
The cost uplift adjustment refers to an increase in costs applied to a cost management group's original spent. This helps in applying custom bill rates, additional charges and other client related bill management for MSPs.
This option within a cost group's context menu is exclusively available to the Account Owner.
- Click the three-dotted icon next to a cost group in the tree view.
- Scroll over to access the Cost Adjustment option.
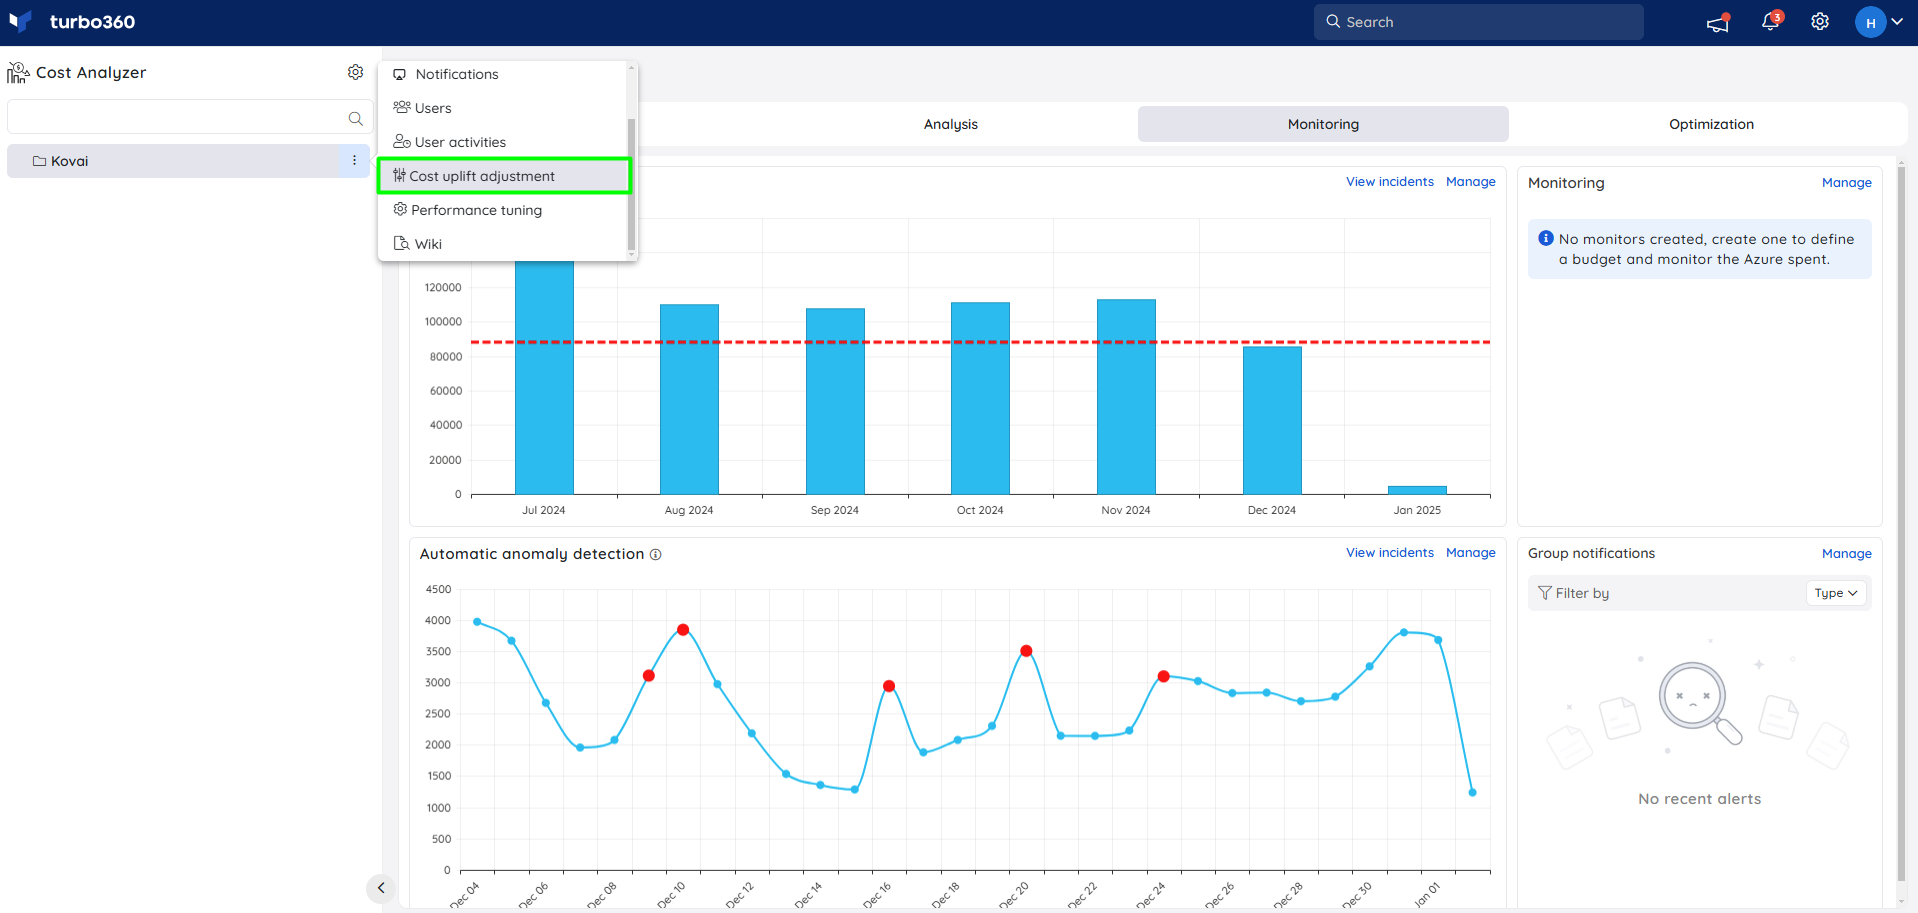
- Enable the toggle to define the cost uplift percentage
- Provide cost uplift percentage value
- Click Save
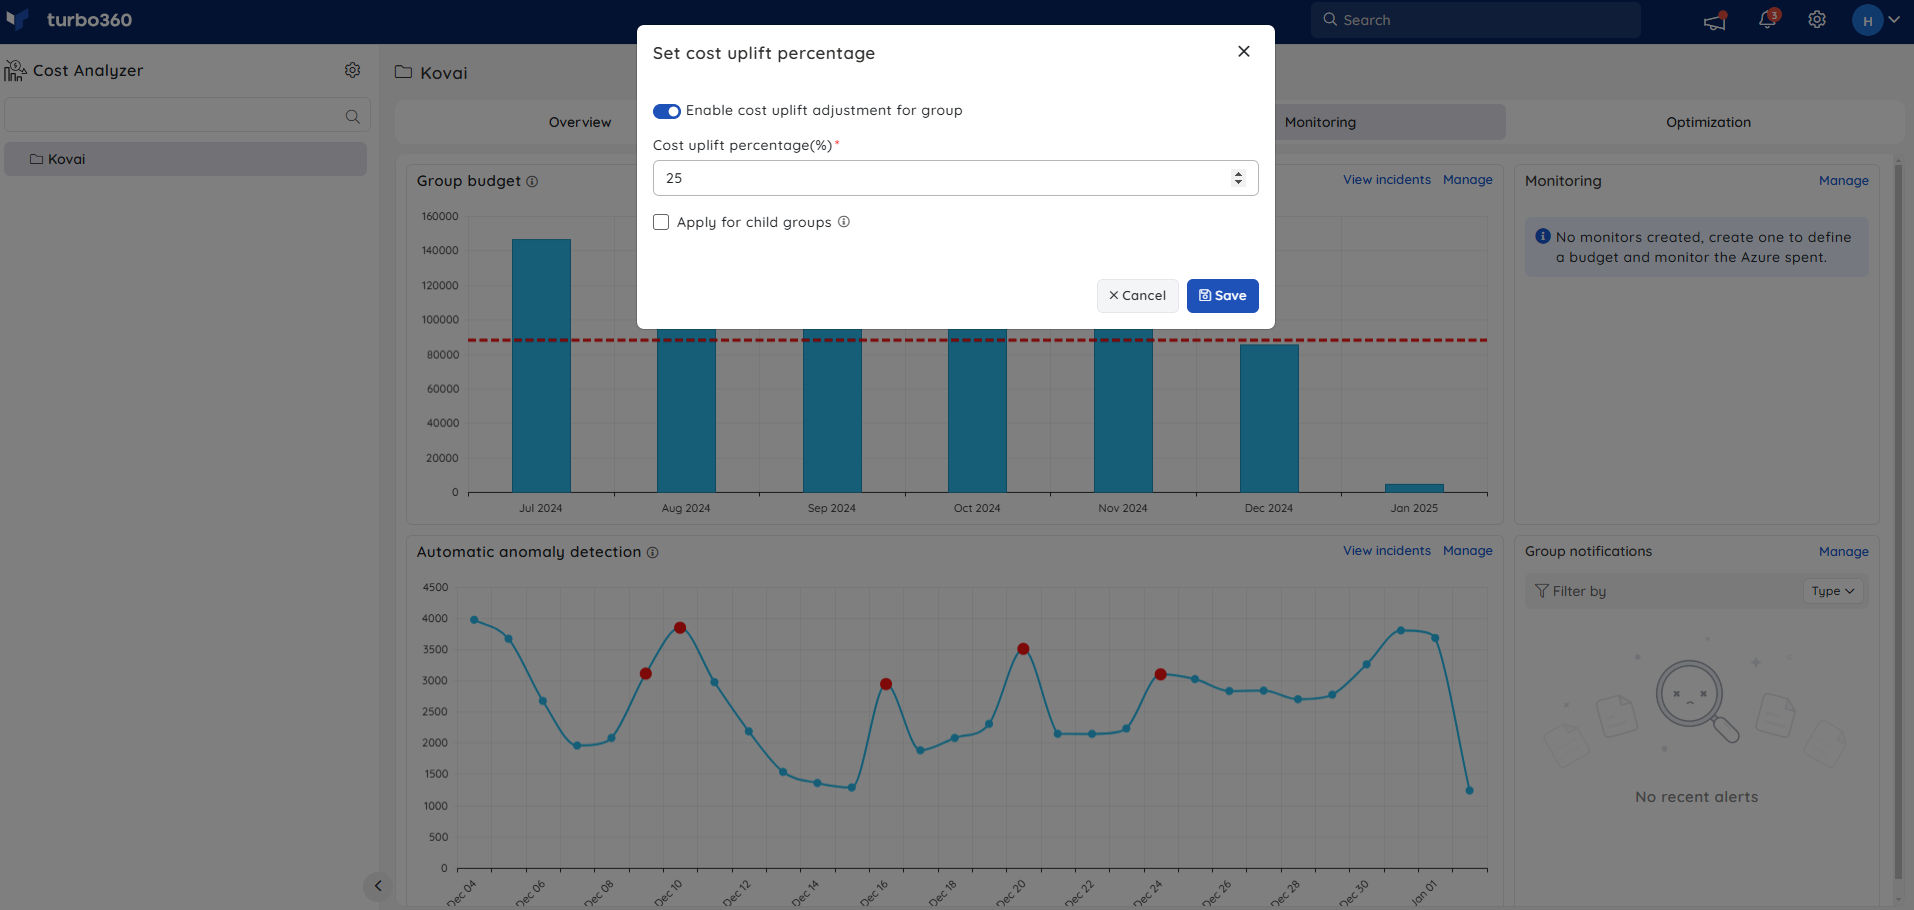
Apply for child groups - Enabling this option will override the cost uplift adjustment settings for the child groups.
All cost data within a cost management group will be adjusted according to the configured uplift percentage.
Health indicator
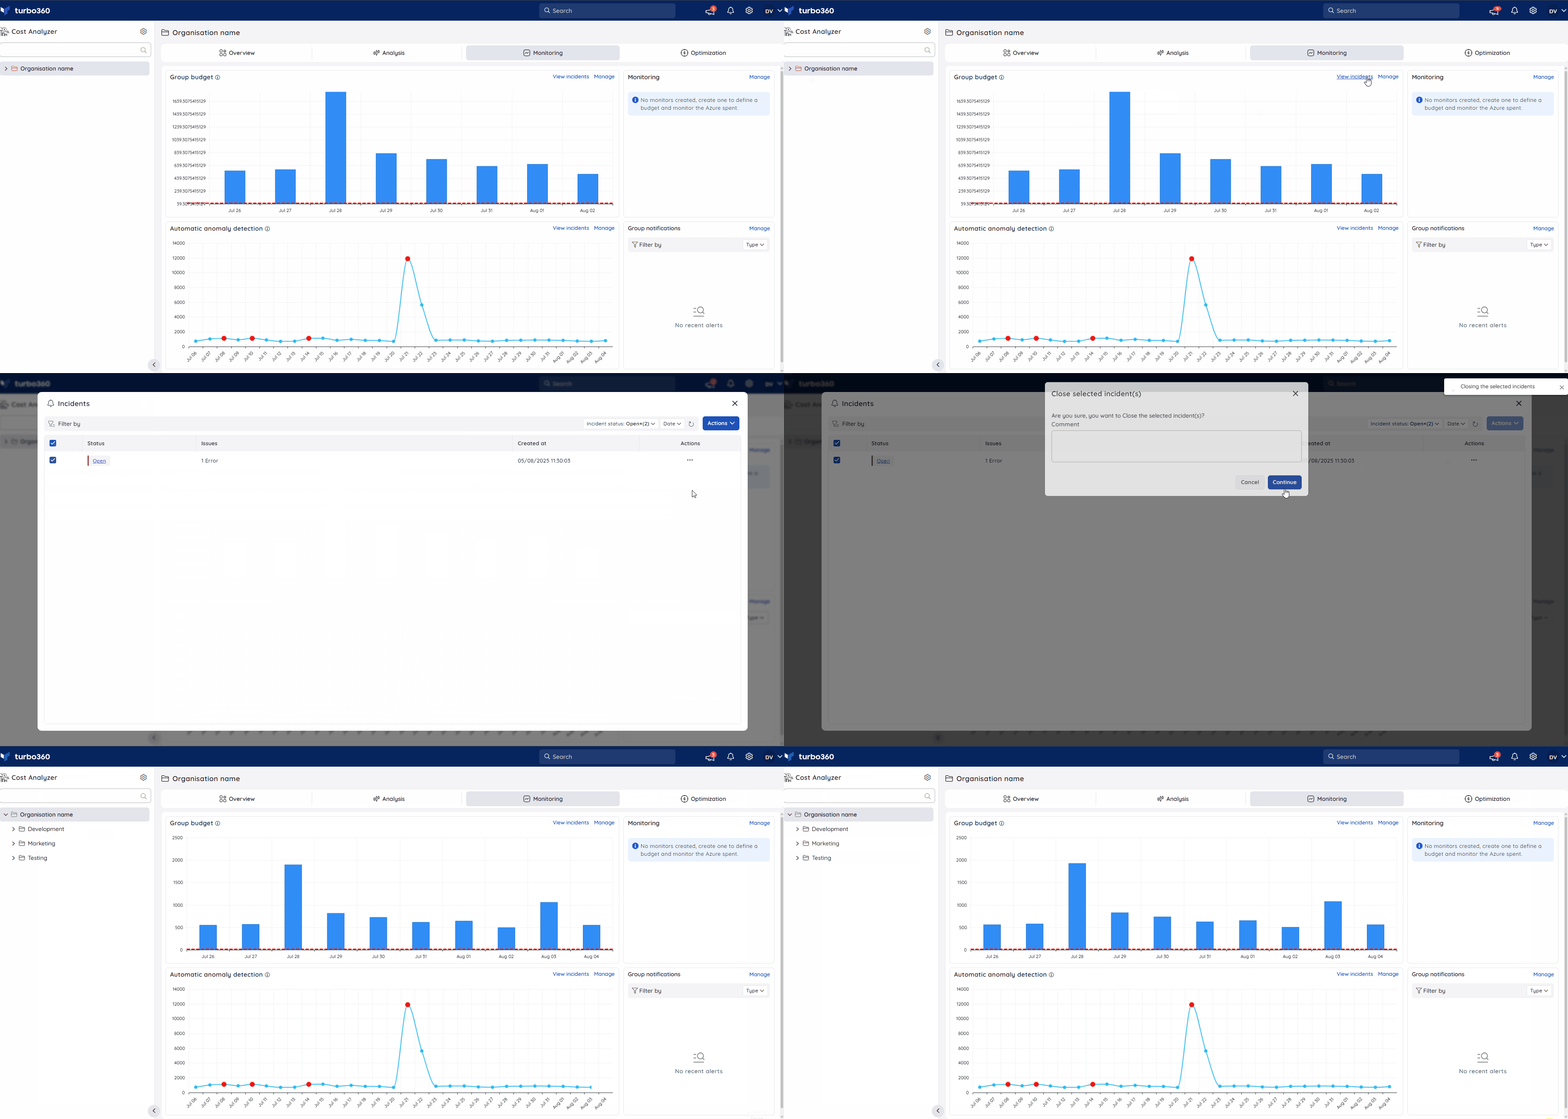
The health status of a Cost group in the tree view is based on the Group budget monitoring alert incidents for the current date.
Closing all open incidents from the present date will update the Cost group status to healthy.
Below is an illustration showing the health status of a cost group changing to healthy after manually closing all active Group budget incidents from the present date:
Edit a group
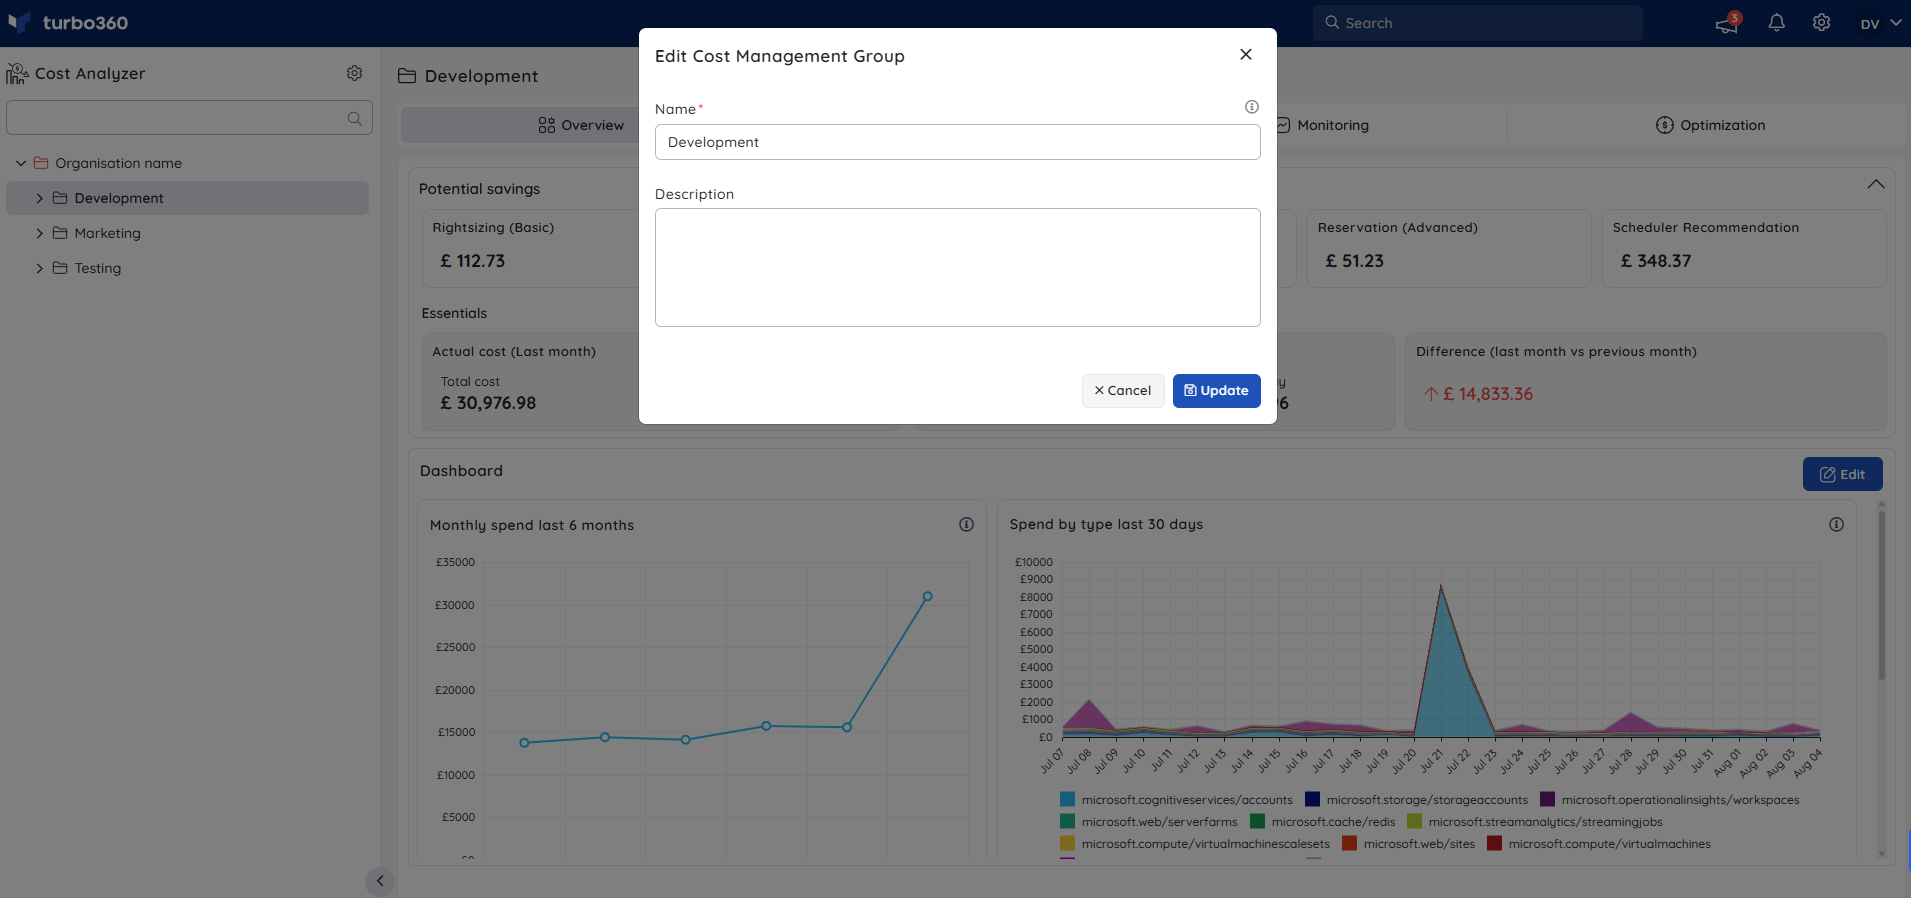
- Click the three-dotted icon next to the desired group in the tree view
- Select the Edit option in the group context menu
- The name and description of the Cost group can be modified
- Click Update
Move a group
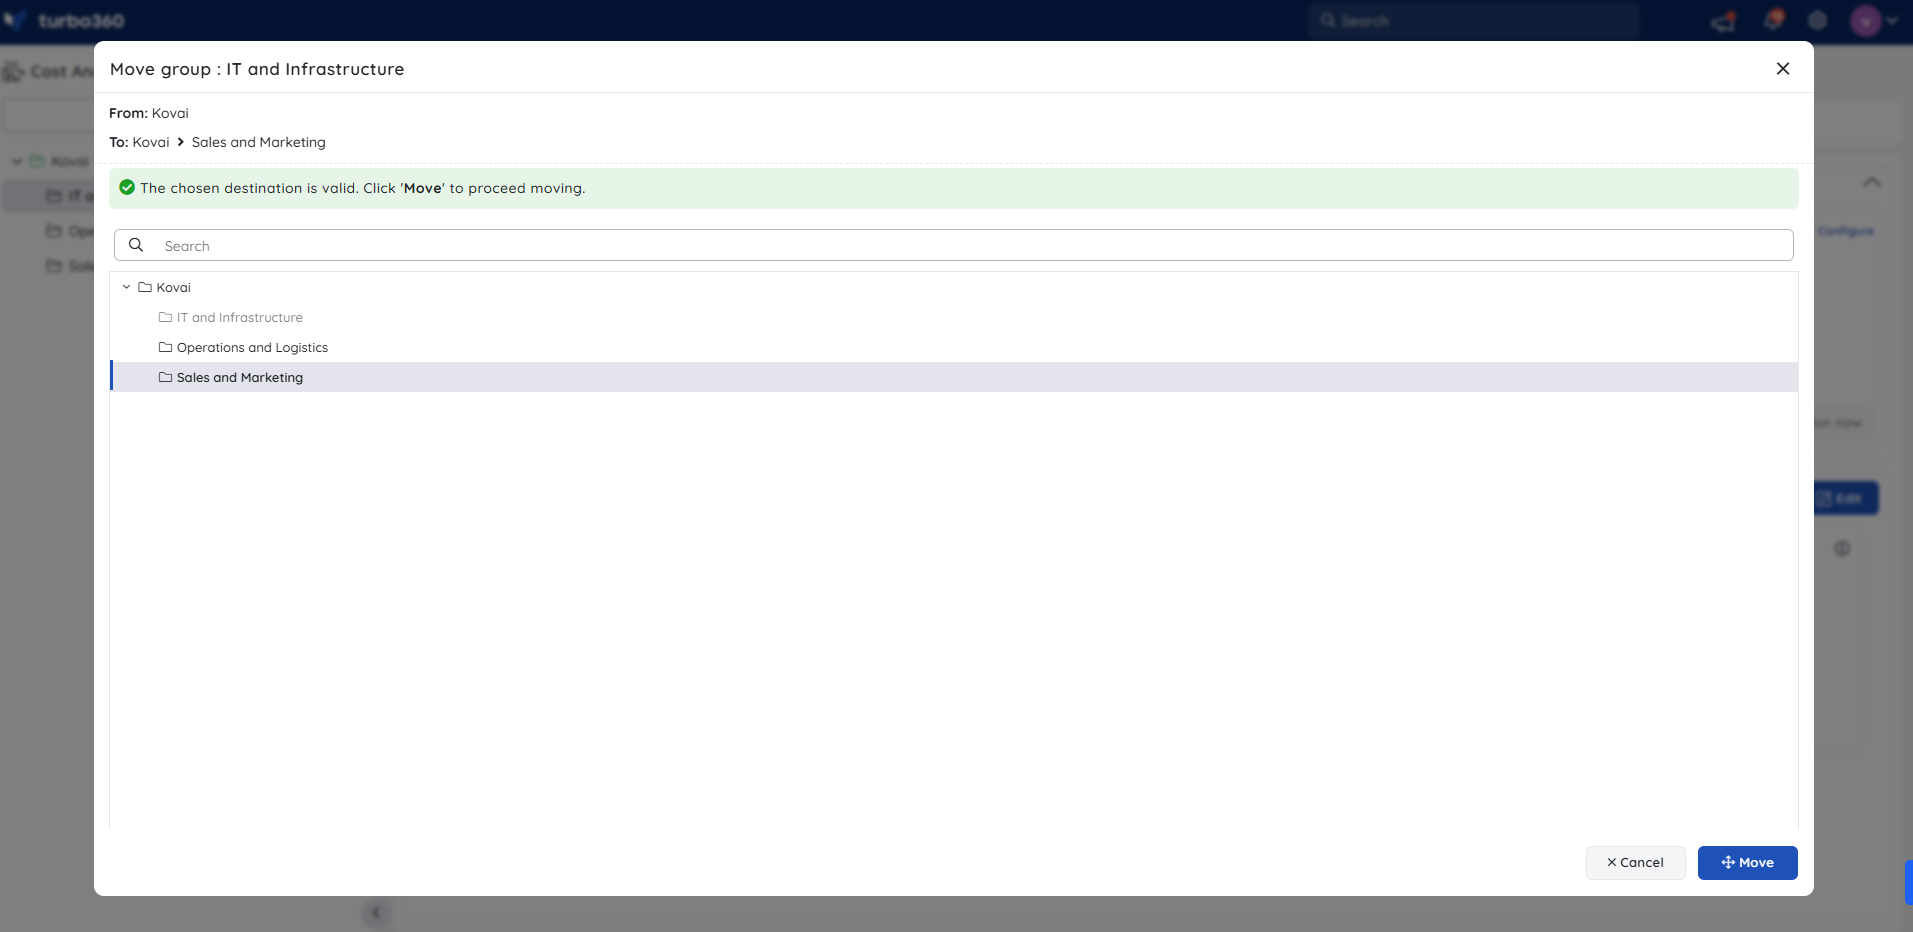
When a Cost Management group is moved from a source group to a destination group, it is restructured under a new hierarchy. While the associated cost data and resource links remain intact, the group's access permissions are replaced by those defined in the destination group.
To move a Cost Management group from a source group to a destination group, follow these steps:
In the tree view, click the three-dot icon next to the group node to be moved.
Select Move from the menu.
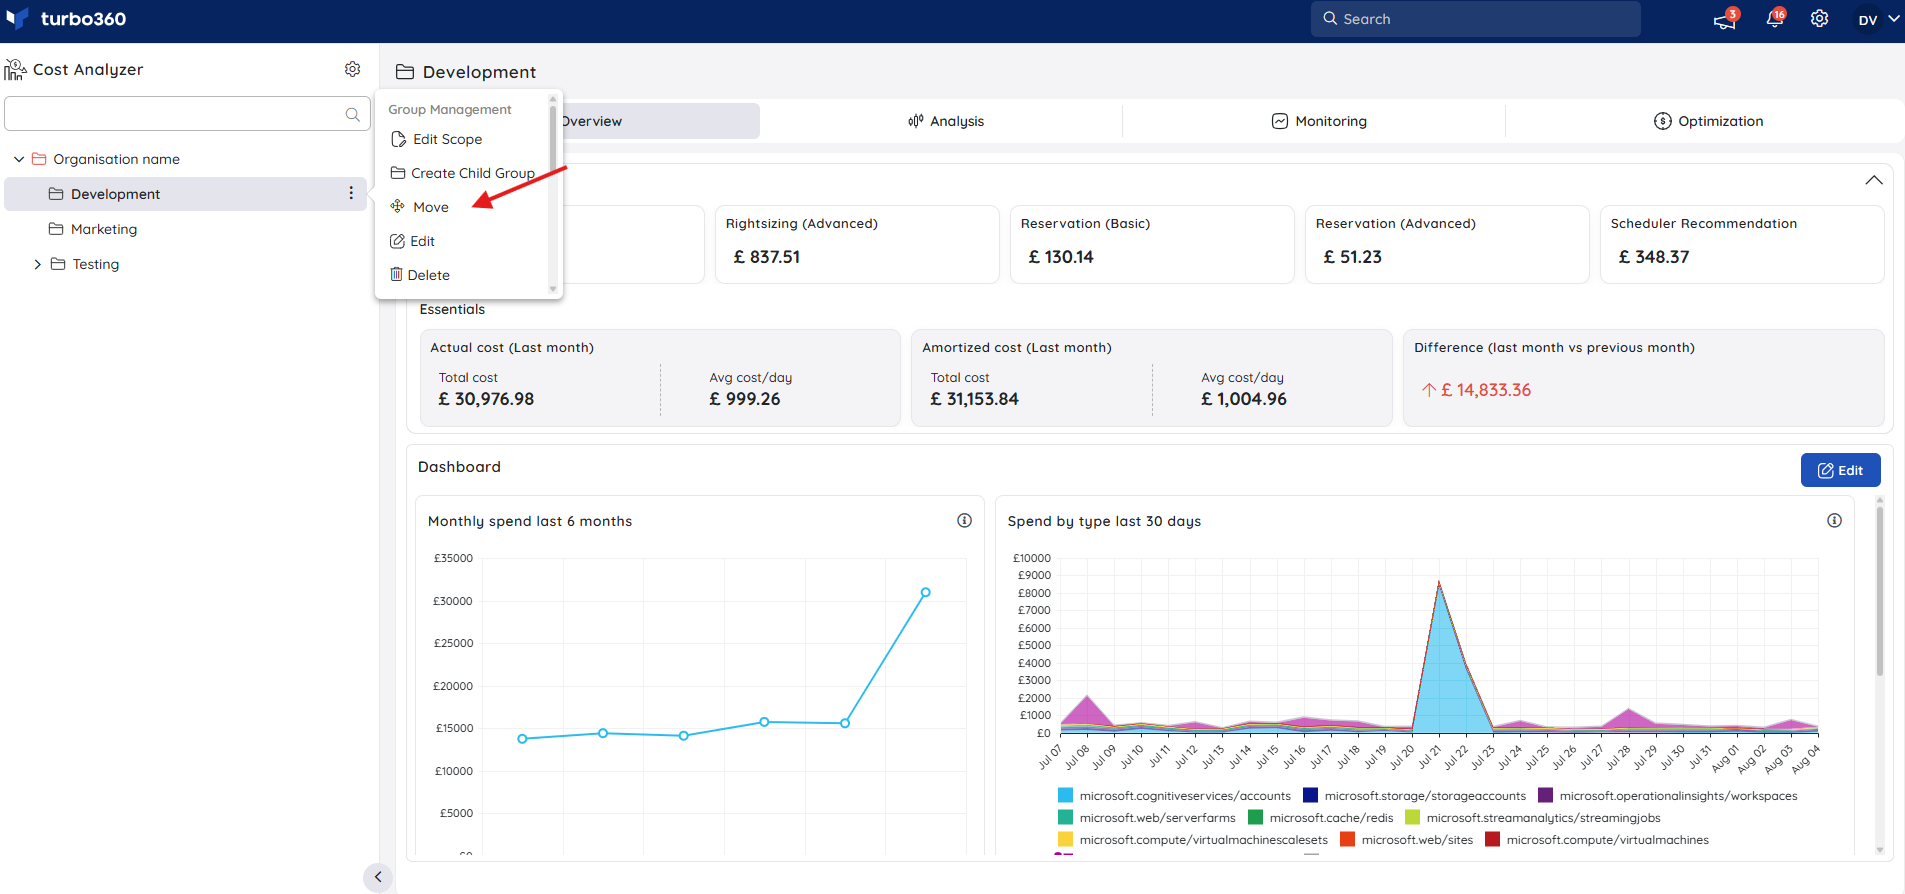
Choose the destination group where the selected Cost Management group should be moved.
Click the Move button to confirm the action.
Access policy impact
During the move:
The user and service principal access policies defined in the source group are overridden by those configured in the destination group.
Any custom role assignments, inherited permissions, or explicit access controls associated with the source group will no longer apply.
This change is immediate and cannot be reversed. Ensure that all necessary users and service principals have appropriate access in the destination group before proceeding with the move.
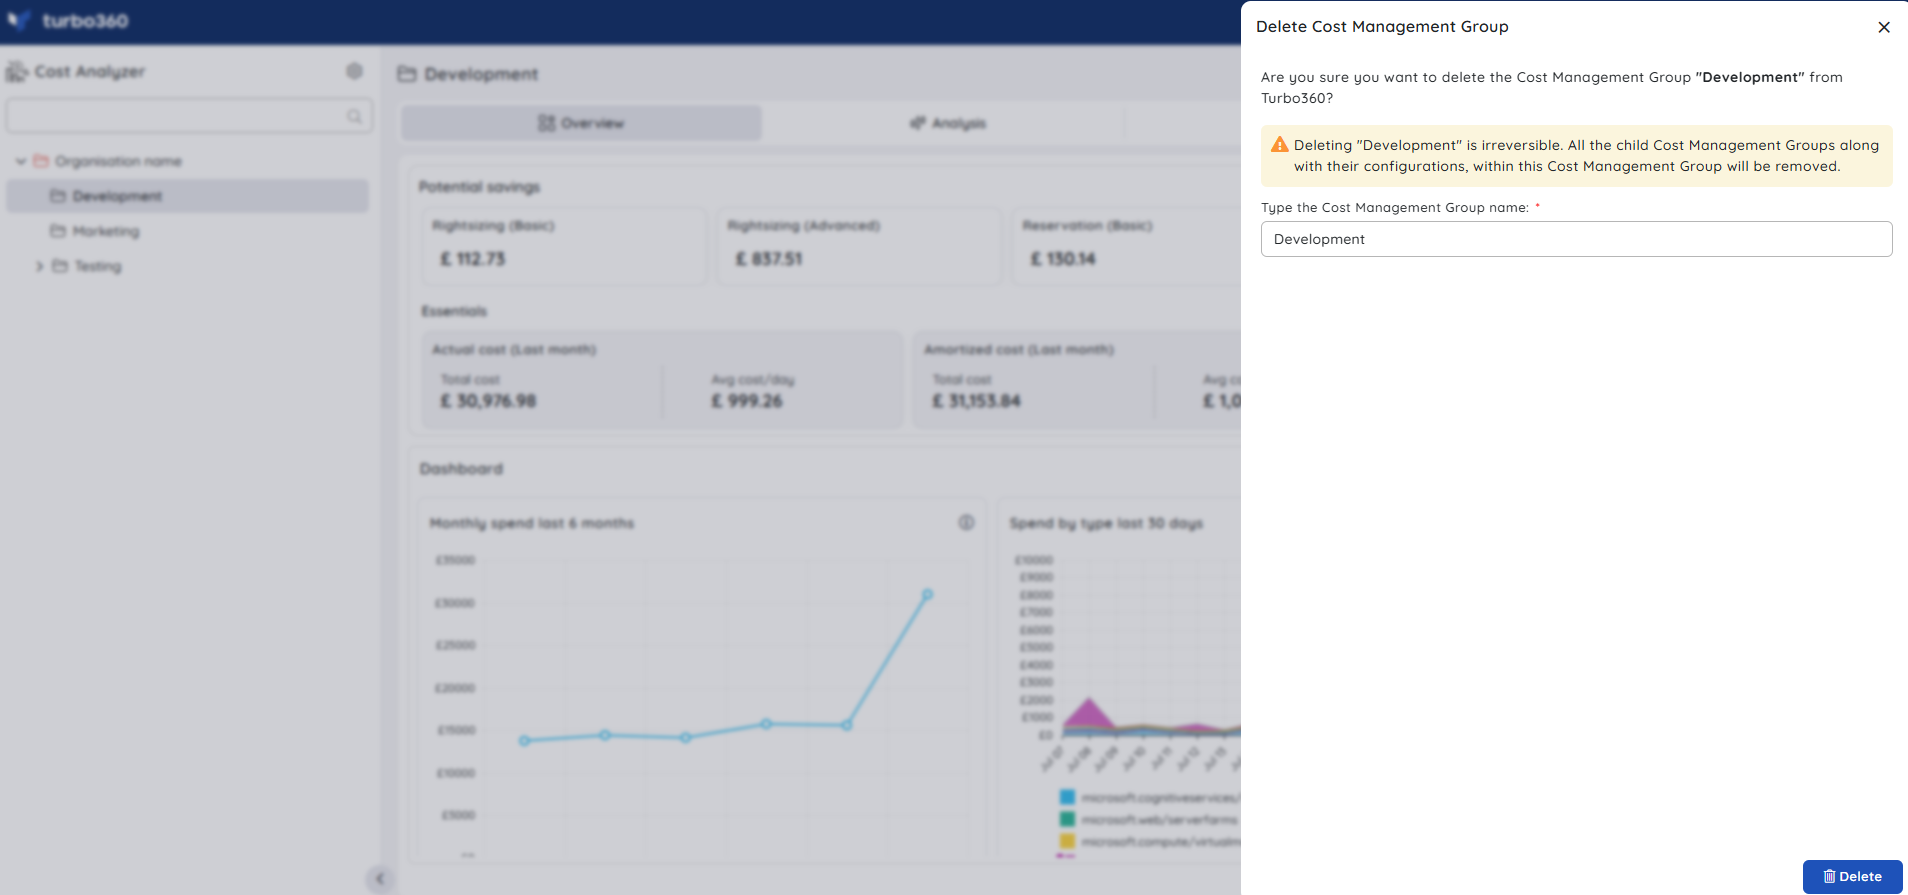
Delete a group
- Click the three-dotted icon next to the desired group in the tree view
- Select the Delete option in the group context menu
- Type the group name for confirmation
- Click Delete
