Analysis view management
- 12 Feb 2026
- 3 Minutes to read
- Print
- DarkLight
- Download PDF
Analysis view management
- Updated on 12 Feb 2026
- 3 Minutes to read
- Print
- DarkLight
- Download PDF
Article summary
Did you find this summary helpful?
Thank you for your feedback!
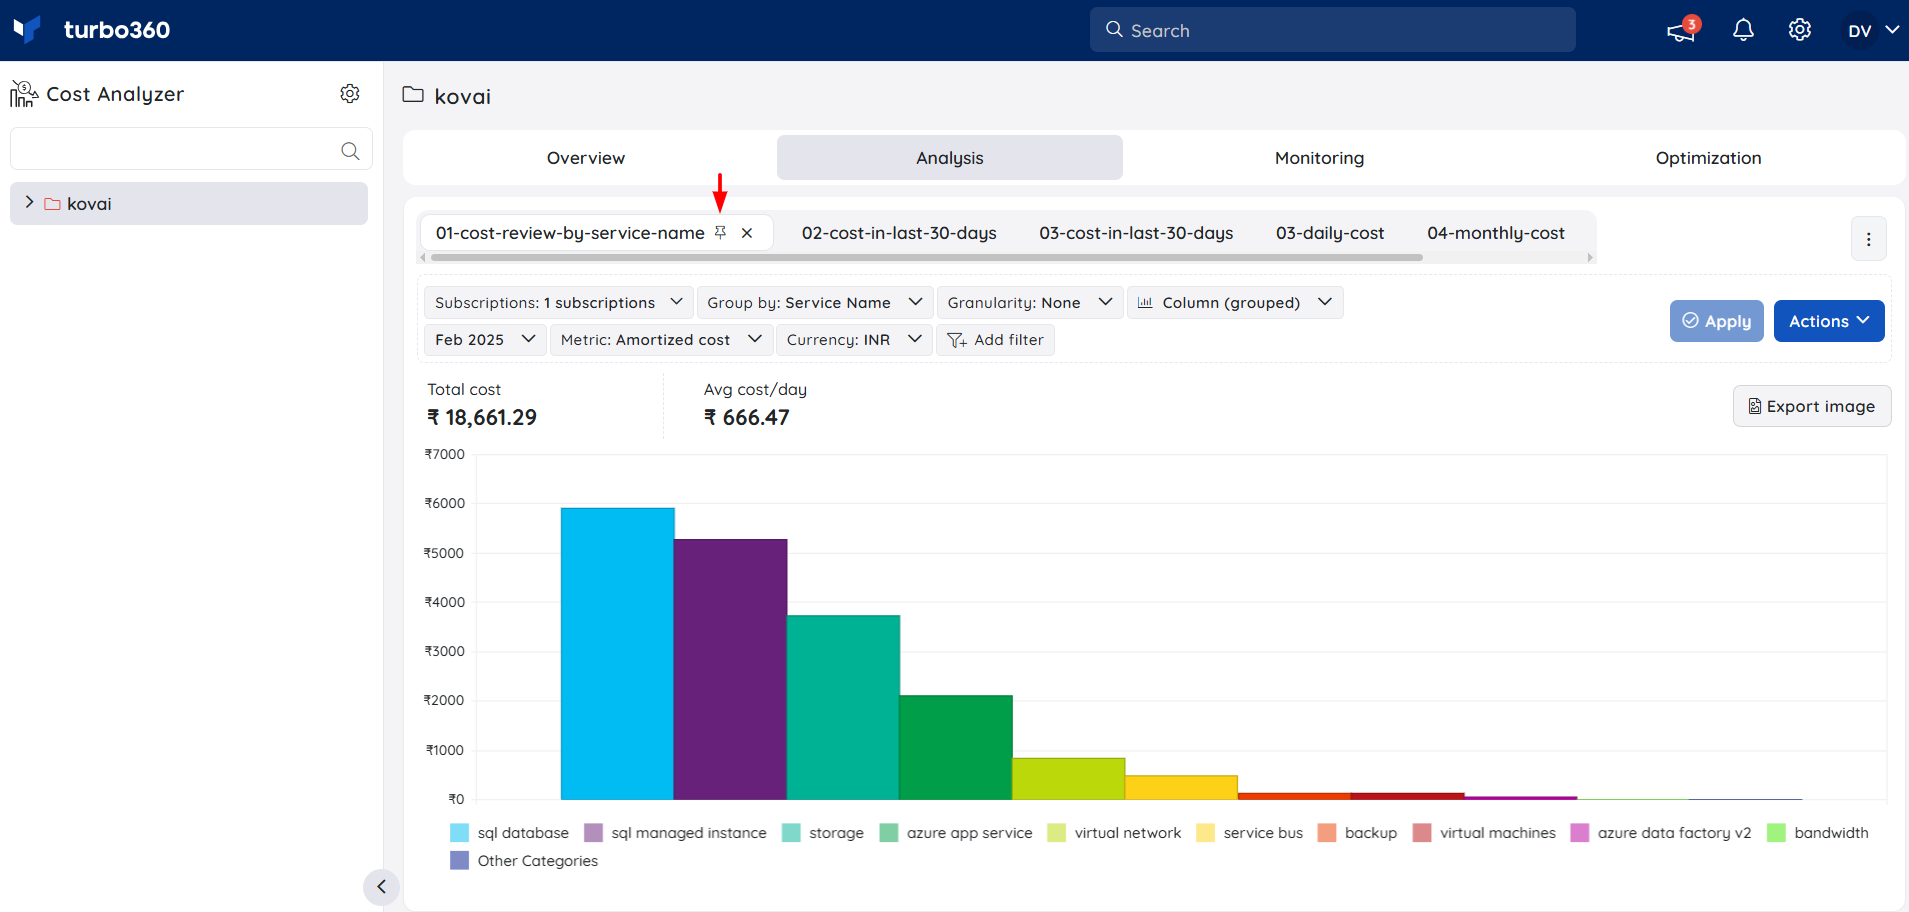
Add an analysis view
- Click the + icon in the Analysis section of a Cost group to add a new view
Each view displays the cost spent on the selected subscriptions based on the filters applied.
Save an analysis view
- Click Save in any view to save the analysis view for future use.
- Enter a name to the view and provide any description, if required
- The user can pin this view to be one of the default views in the Analysis section by selecting Pin to tabs checkbox
- Click Save
All the saved views can be accessed by using the Saved views option. The Saved views wizard allows users to update, pin (or) unpin, open, and delete saved views.
Pin to display by default
Analysis views can be pinned to appear as the default view.
This can be done either from the Saved Views section or by clicking the pin / unpin icon in the respective tab.
Clone an analysis view
- Click Actions dropdown -> Clone in an analysis view to clone an existing view
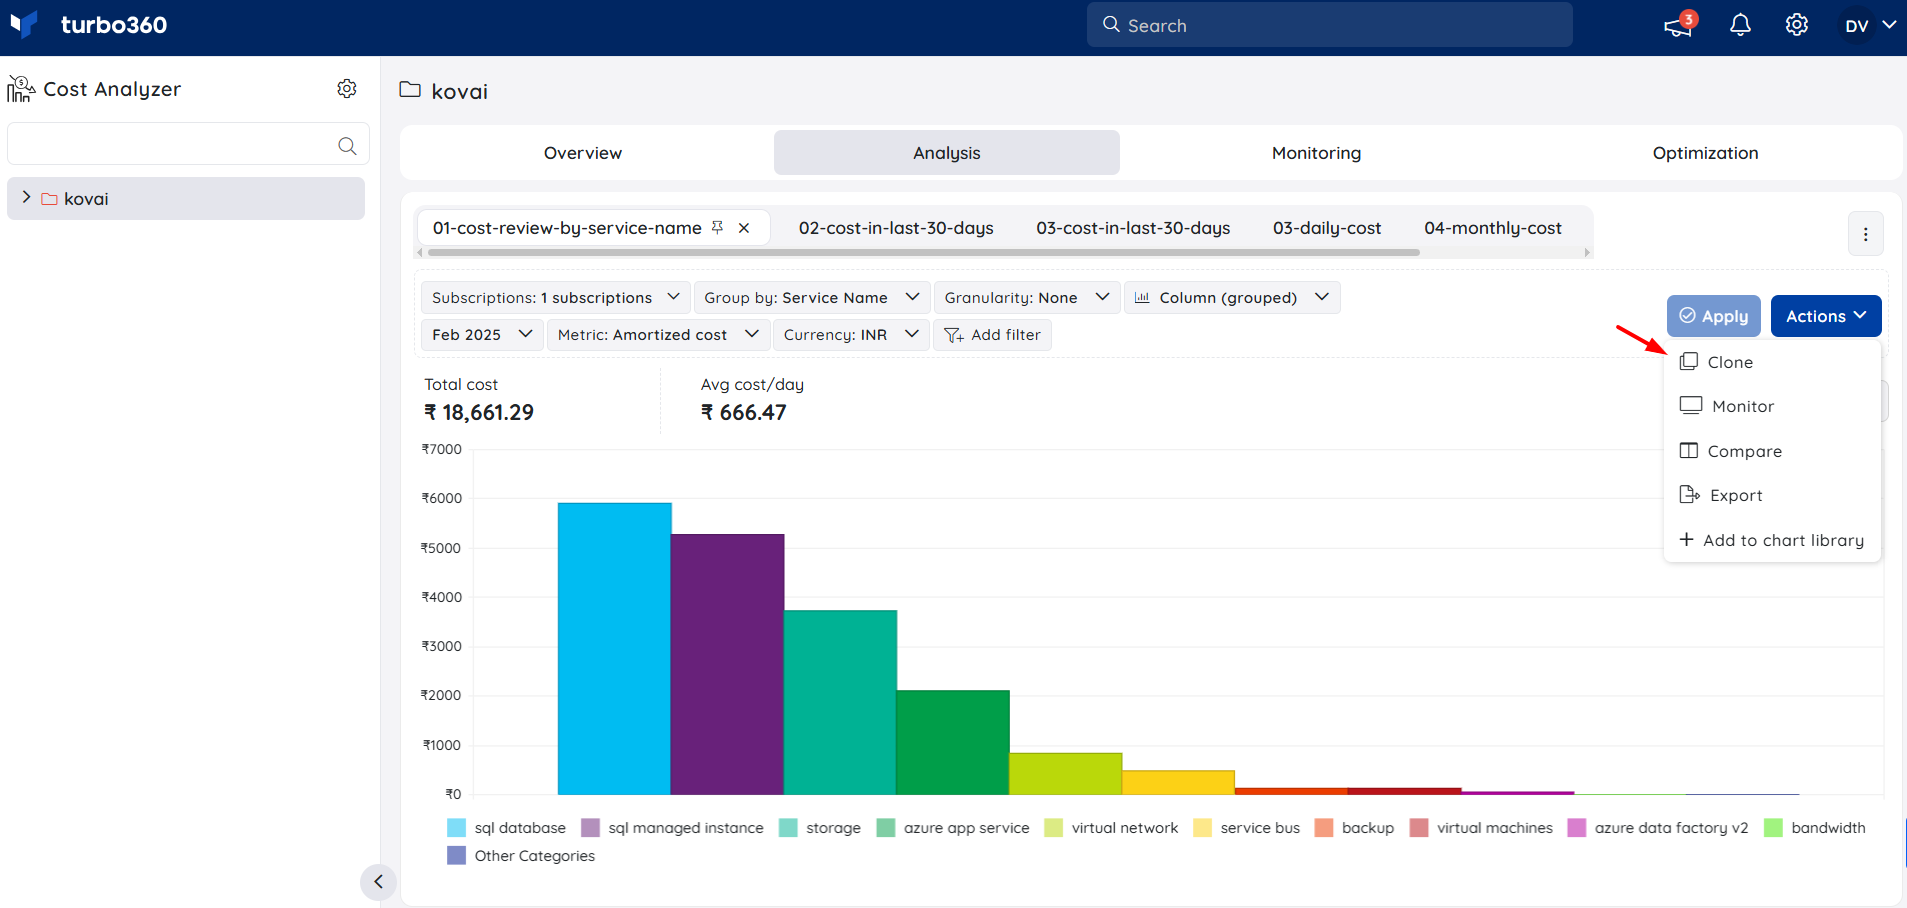
(or)
- Click the Clone icon in a Saved view
- Enter a name to the view to be cloned
- Select Pin to tabs if the view needs to be displayed by default
- Click Clone

Delete saved analysis views
- Click Saved views in the Analysis section of a Cost group
- Click the Delete icon next to a saved view
- Click Delete in the confirmation box
A view will not be completely removed by closing it from the View tab. It just closes the selected view and you can access it again in the Saved Views list.
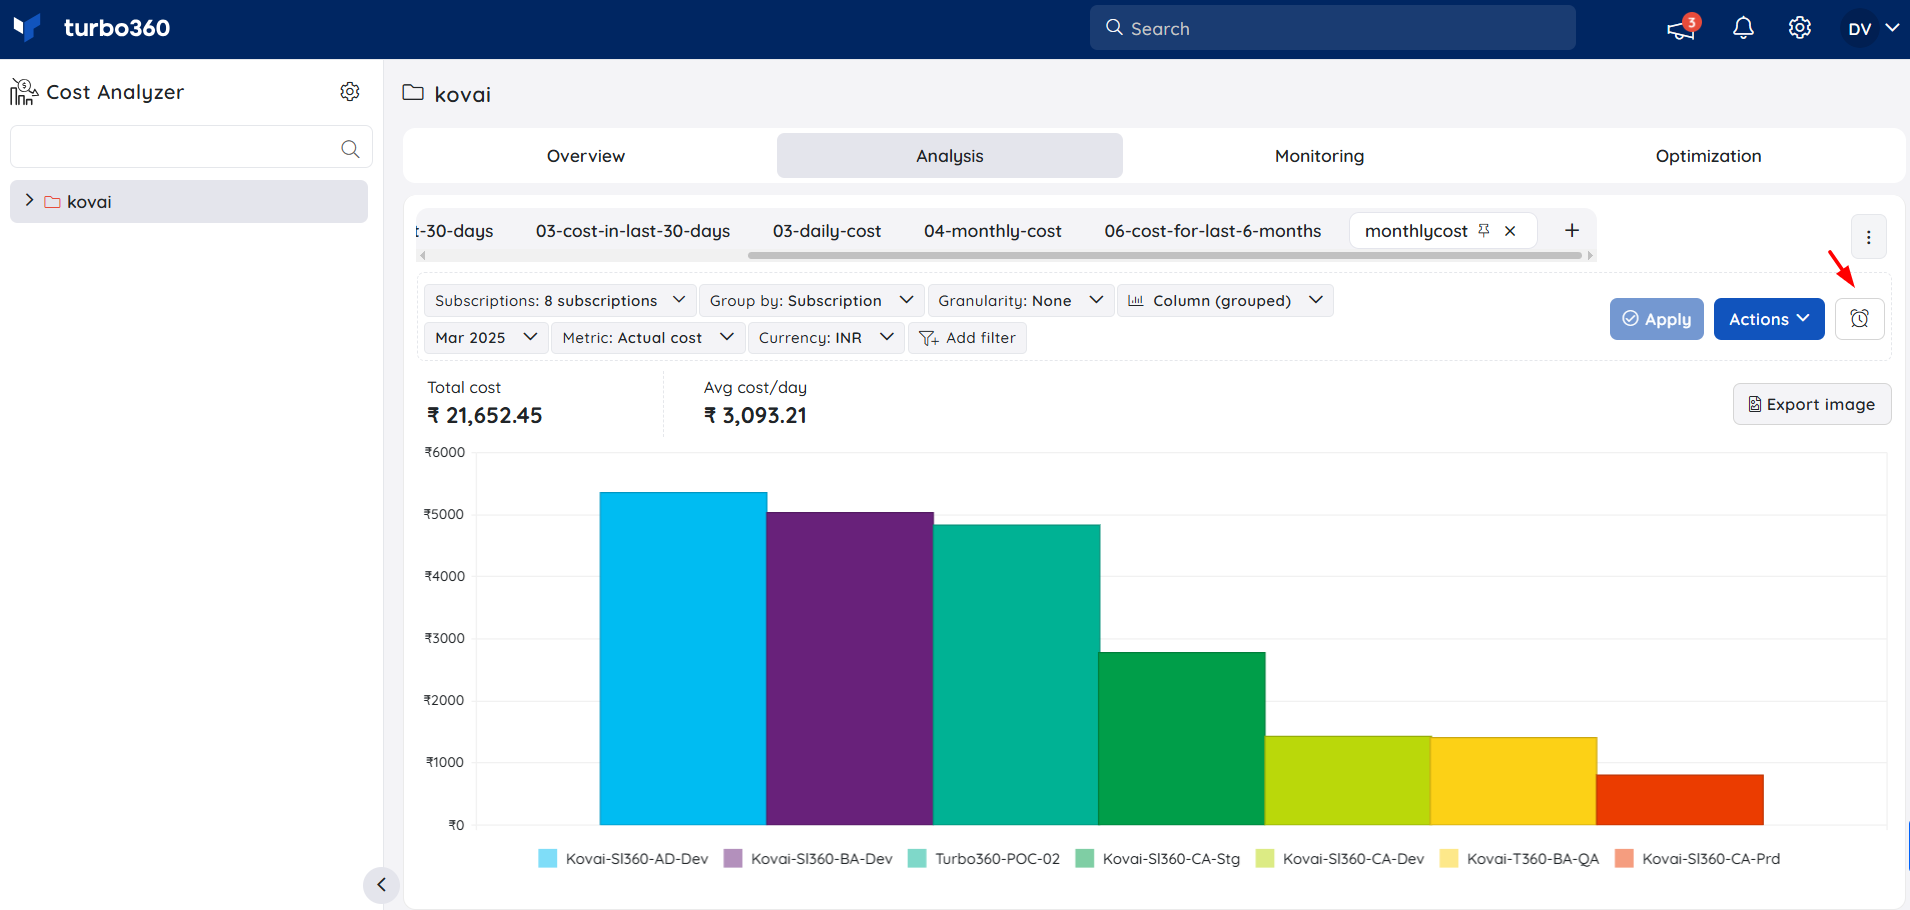
Create cost monitors from Analysis views
Cost monitors can be created directly from an analysis view by selecting Monitor option from the Actions dropdown.
The monitor inherits the filters applied to the analysis view and uses them as its monitoring rules.
Any modifications to the view’s filters are automatically synchronized with the associated monitor.
Within the monitor, users can view only the subscription and filters configured in the monitoring rule. Adding new subscriptions or modifying existing filters is not supported.
- Views associated with a Cost monitor are indicated by an alarm icon.
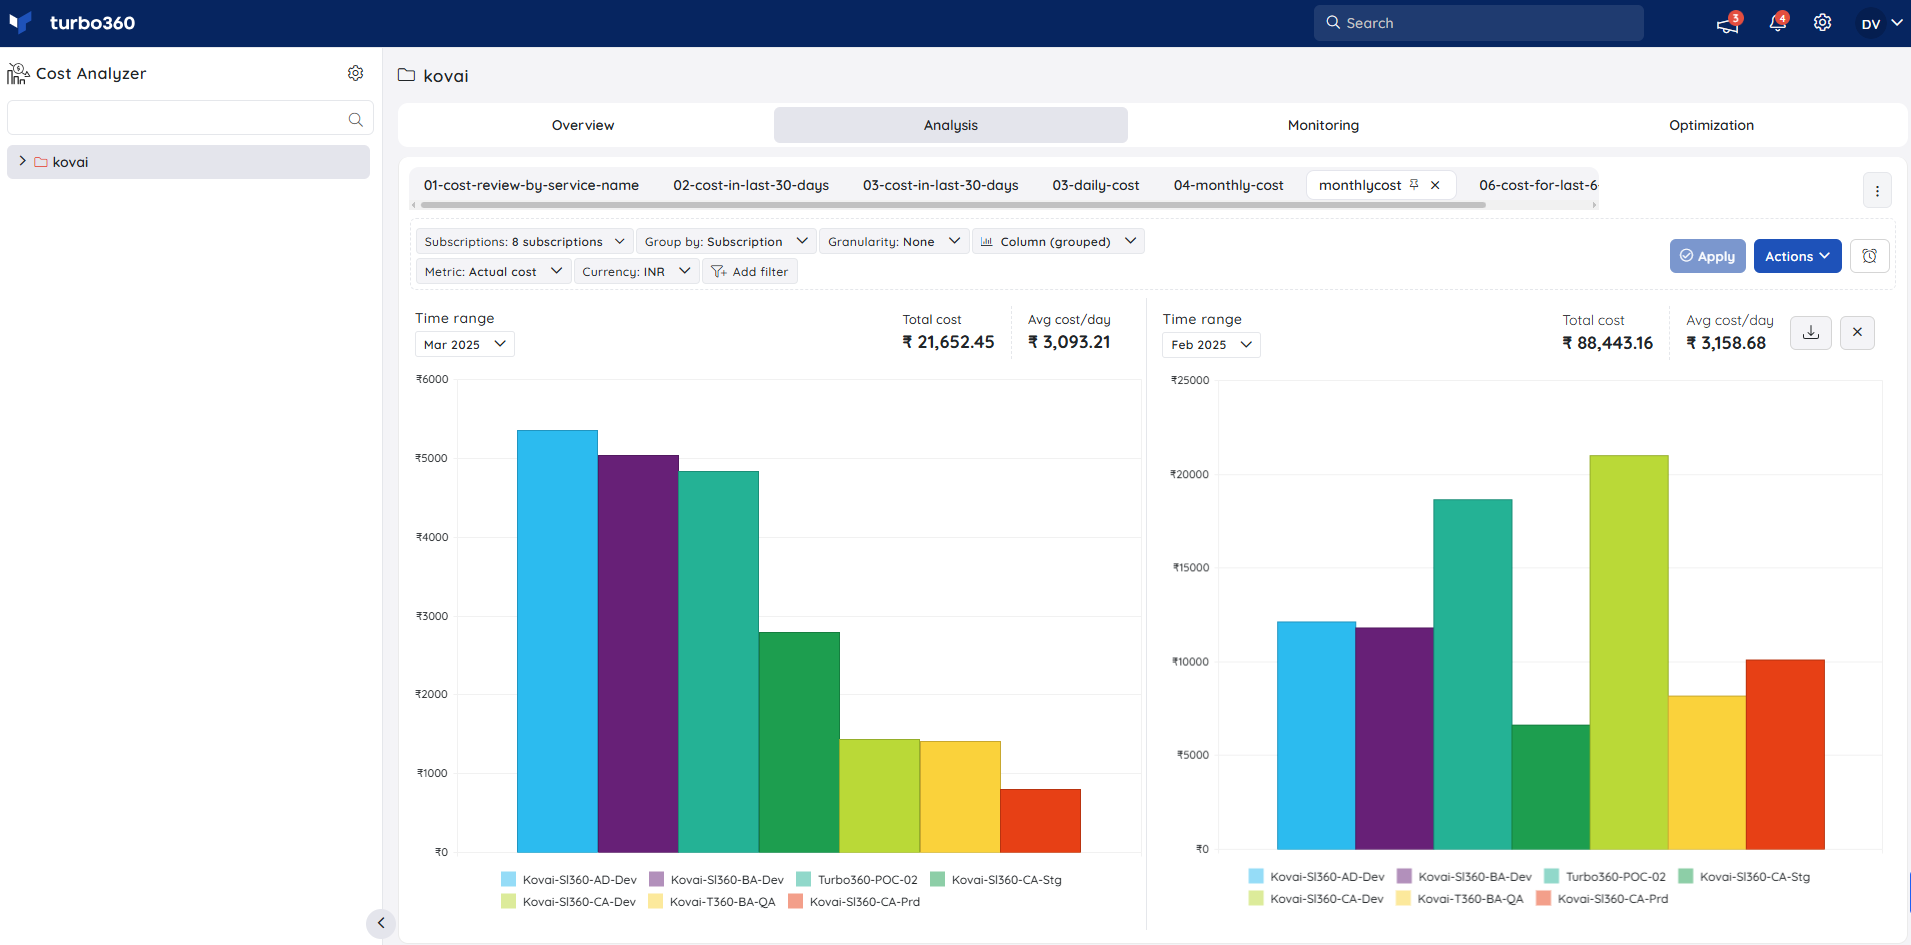
Cost comparison
Azure subscription costs for two different time ranges can be compared by selecting Compare from the Actions menu within an Analysis view.

Customize the filters and time ranges to view cost comparison for the selected subscriptions.
The Table chart offers two unique features that distinguish it from other chart types:
- It allows viewing the cost difference between two time ranges for individual subscriptions.
- Time ranges can be swapped, a functionality available exclusively in the Table chart.
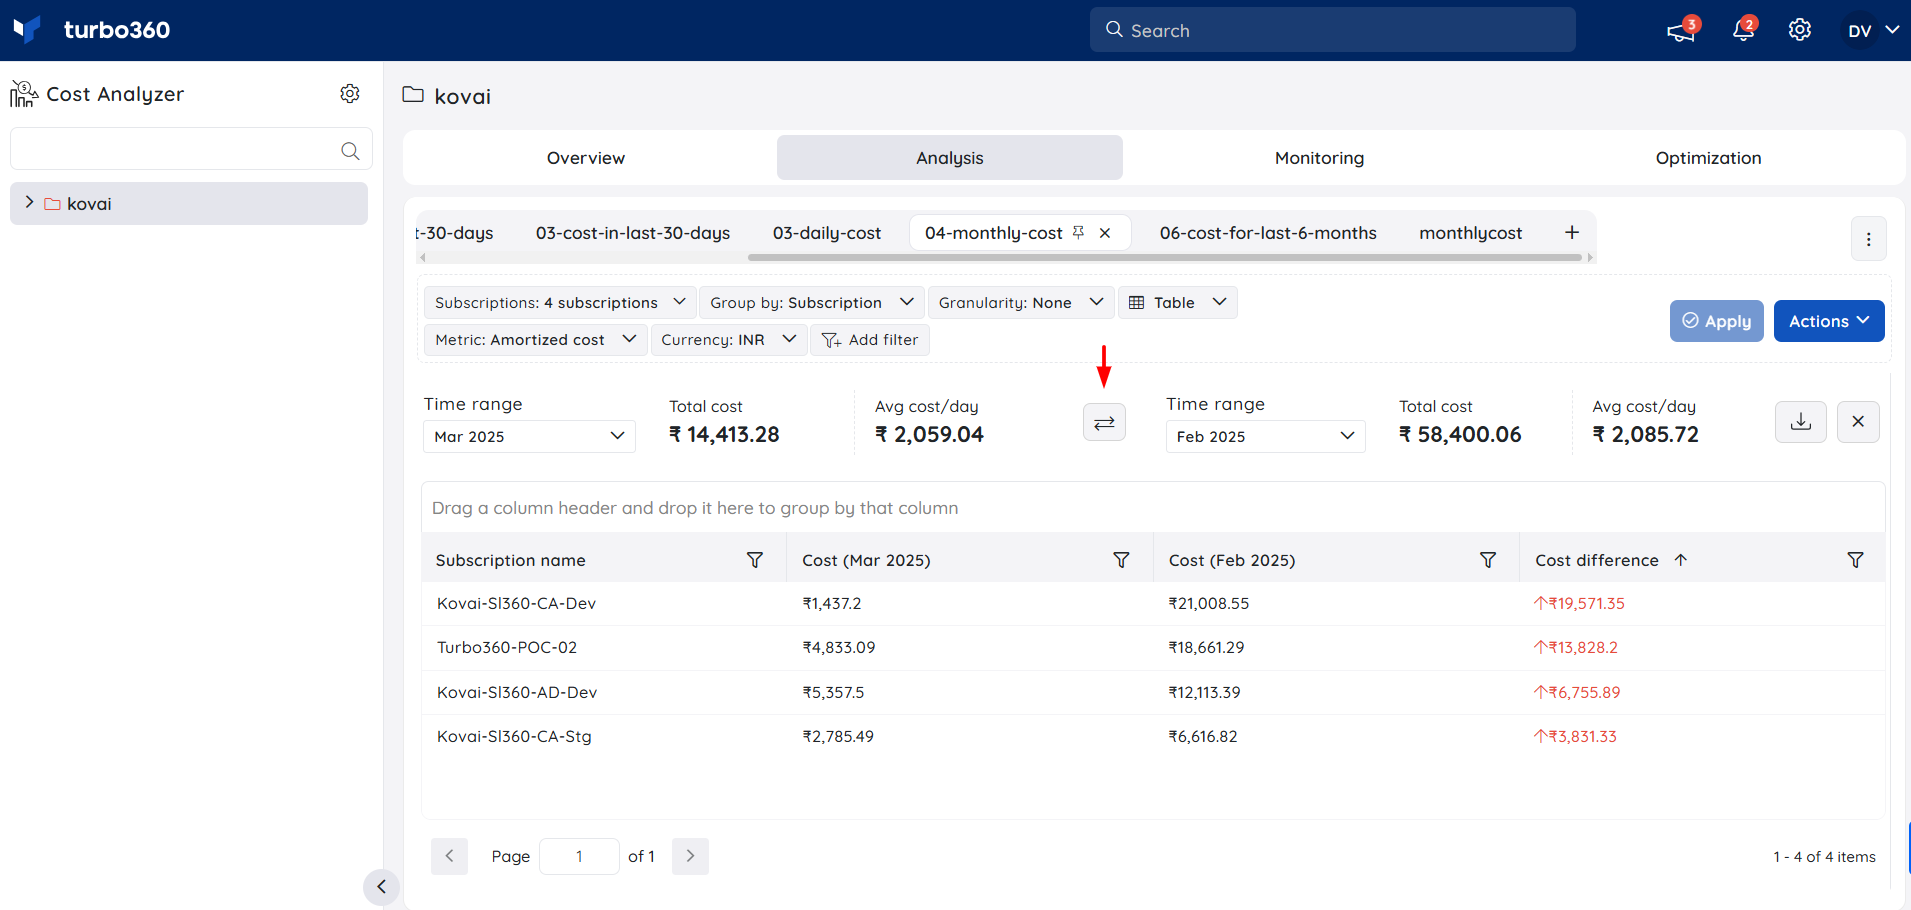
The Table chart supports Compare option only when the Granularity is set to None.
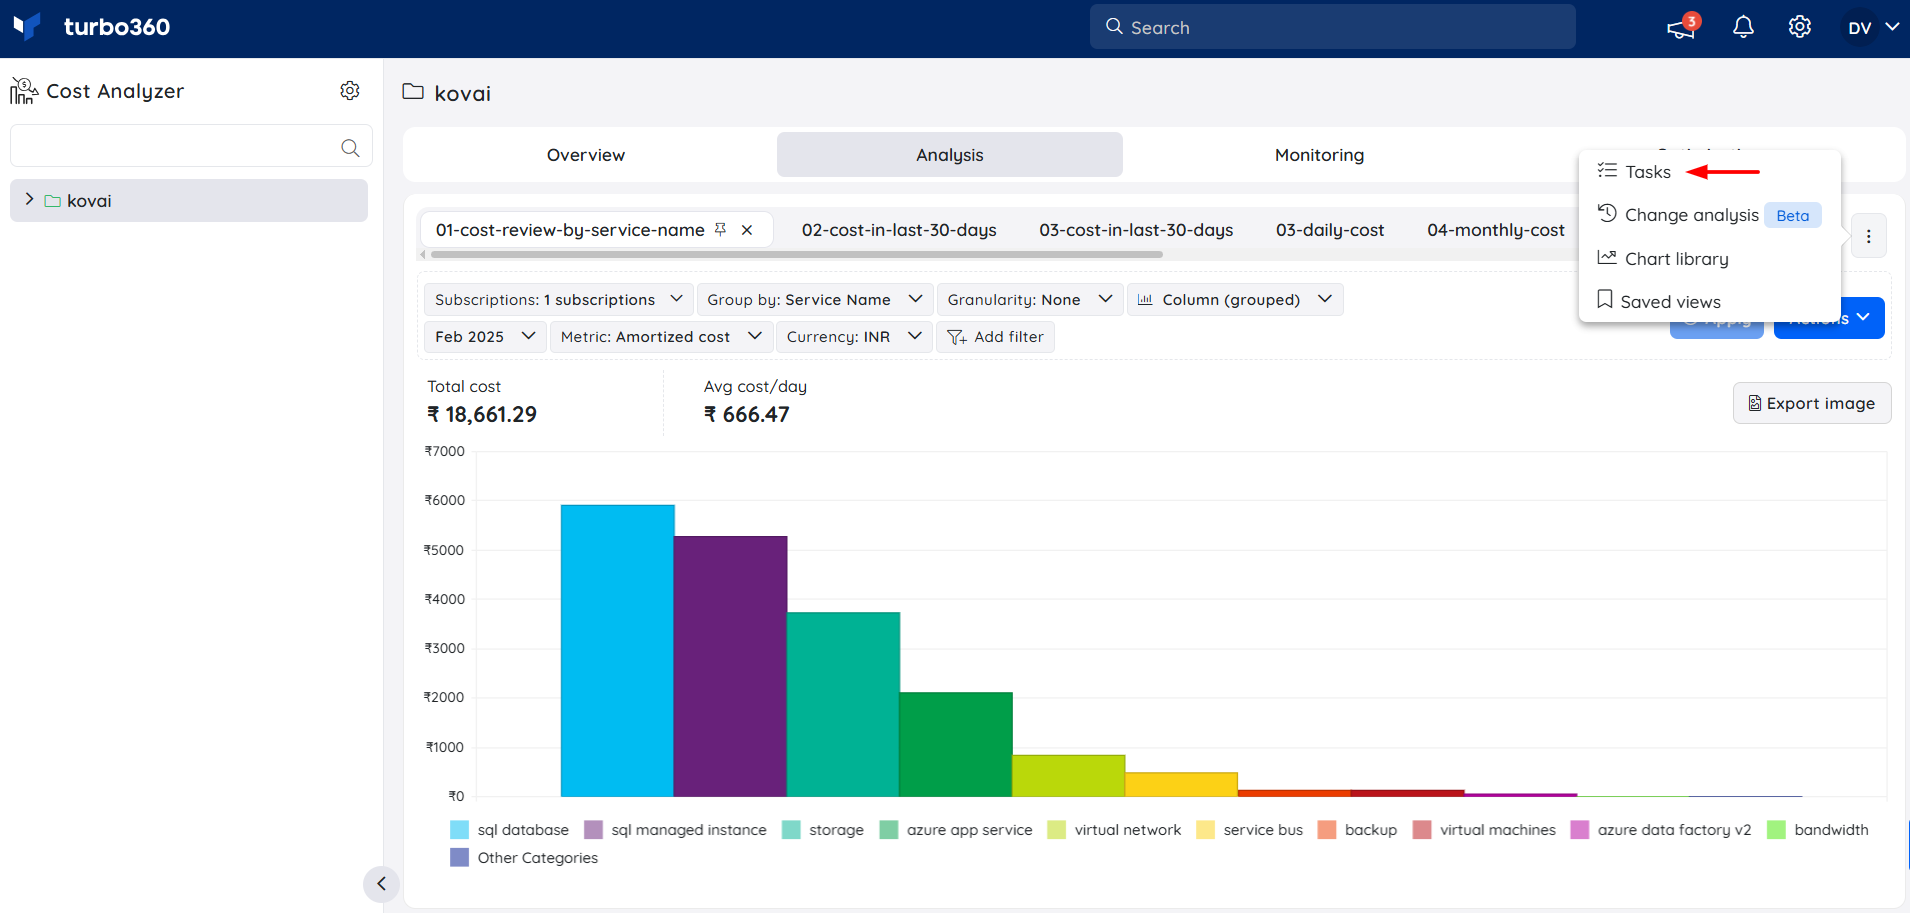
Task creation from Analysis views
Turbo360's Task planner, available through the profile drop-down menu, streamlines task scheduling, team assignments, and centralized oversight within the platform.
To efficiently monitor spending, review cost-saving opportunities, and implement optimizations, the Cost Analyzer includes built-in Task management, allowing users to create and manage tasks directly within the module.
Refer to the steps below to create inline tasks from Cost Analyzer
- Navigate to the Analysis section of a cost management group.
- Click the context menu and select the Tasks option.
- Click the Add Task button to create a new task.
- Enter the necessary details to complete the task assignment.
- Edit or delete tasks using the respective buttons within the module.
- Use the navigation link to access the global Task planner section. Users can view and manage tasks on the Task Planner board, with all updates automatically reflected in the Cost Analyzer task board.
Scheduled export
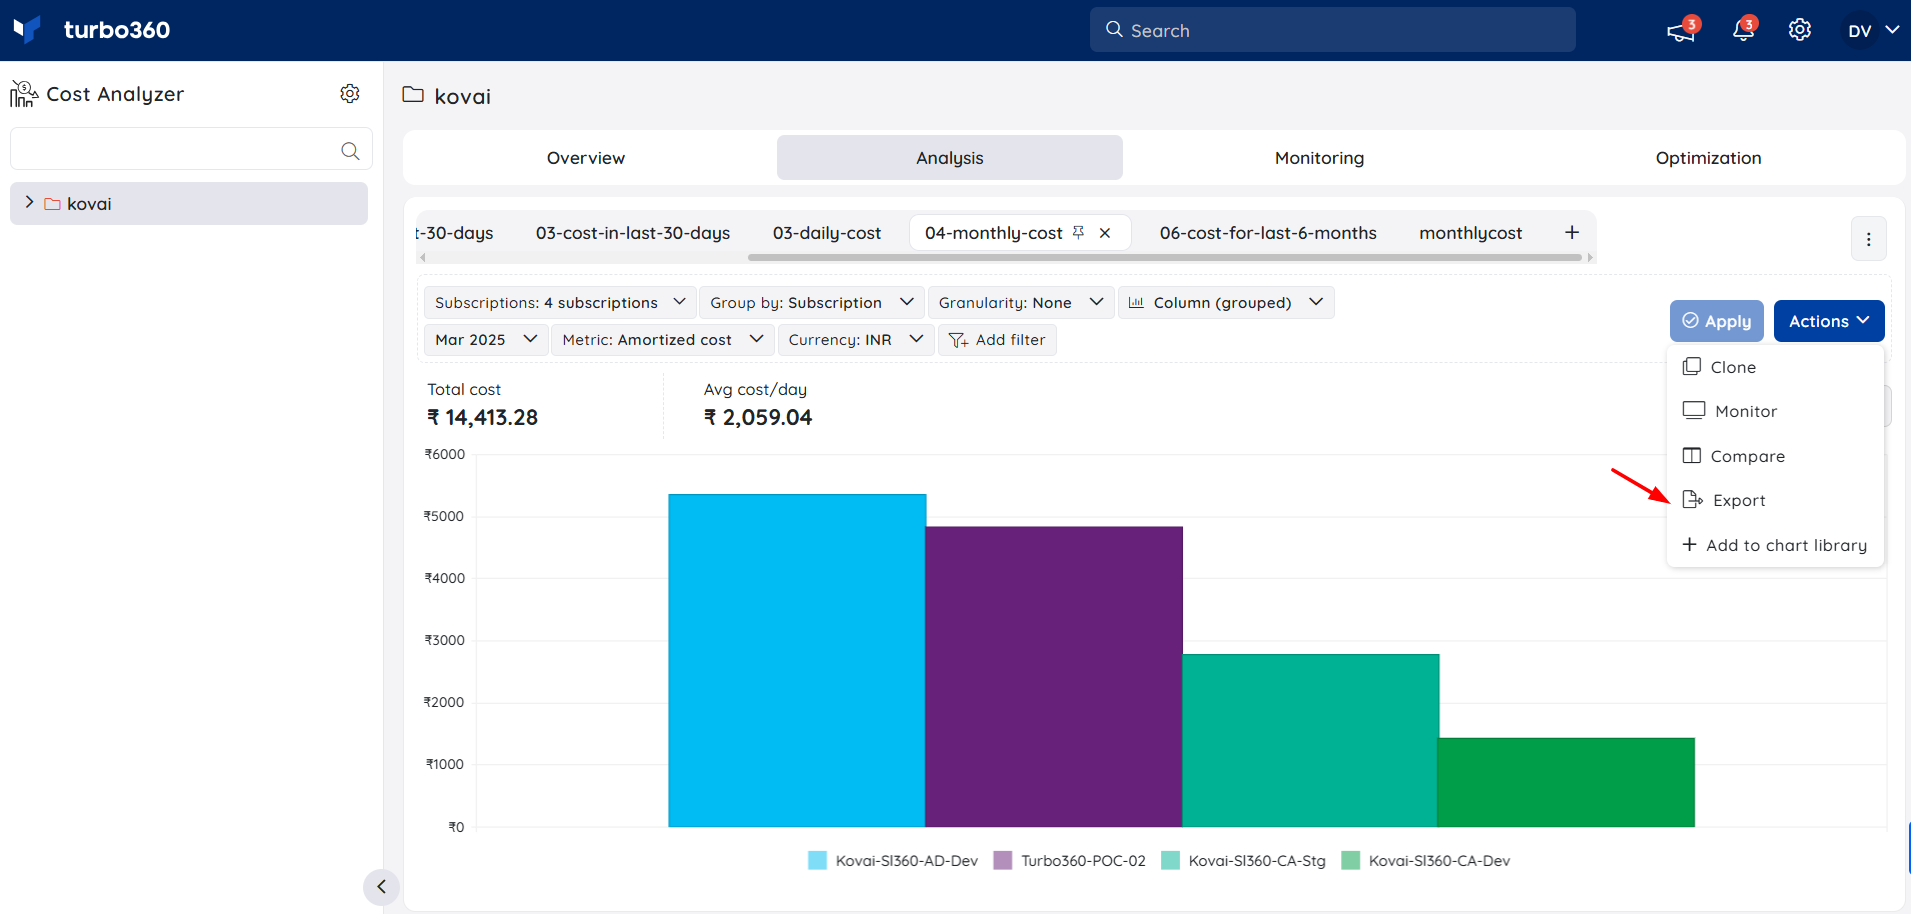
The Export feature in Cost Analysis lets users export cost data and insights from the analysis view.
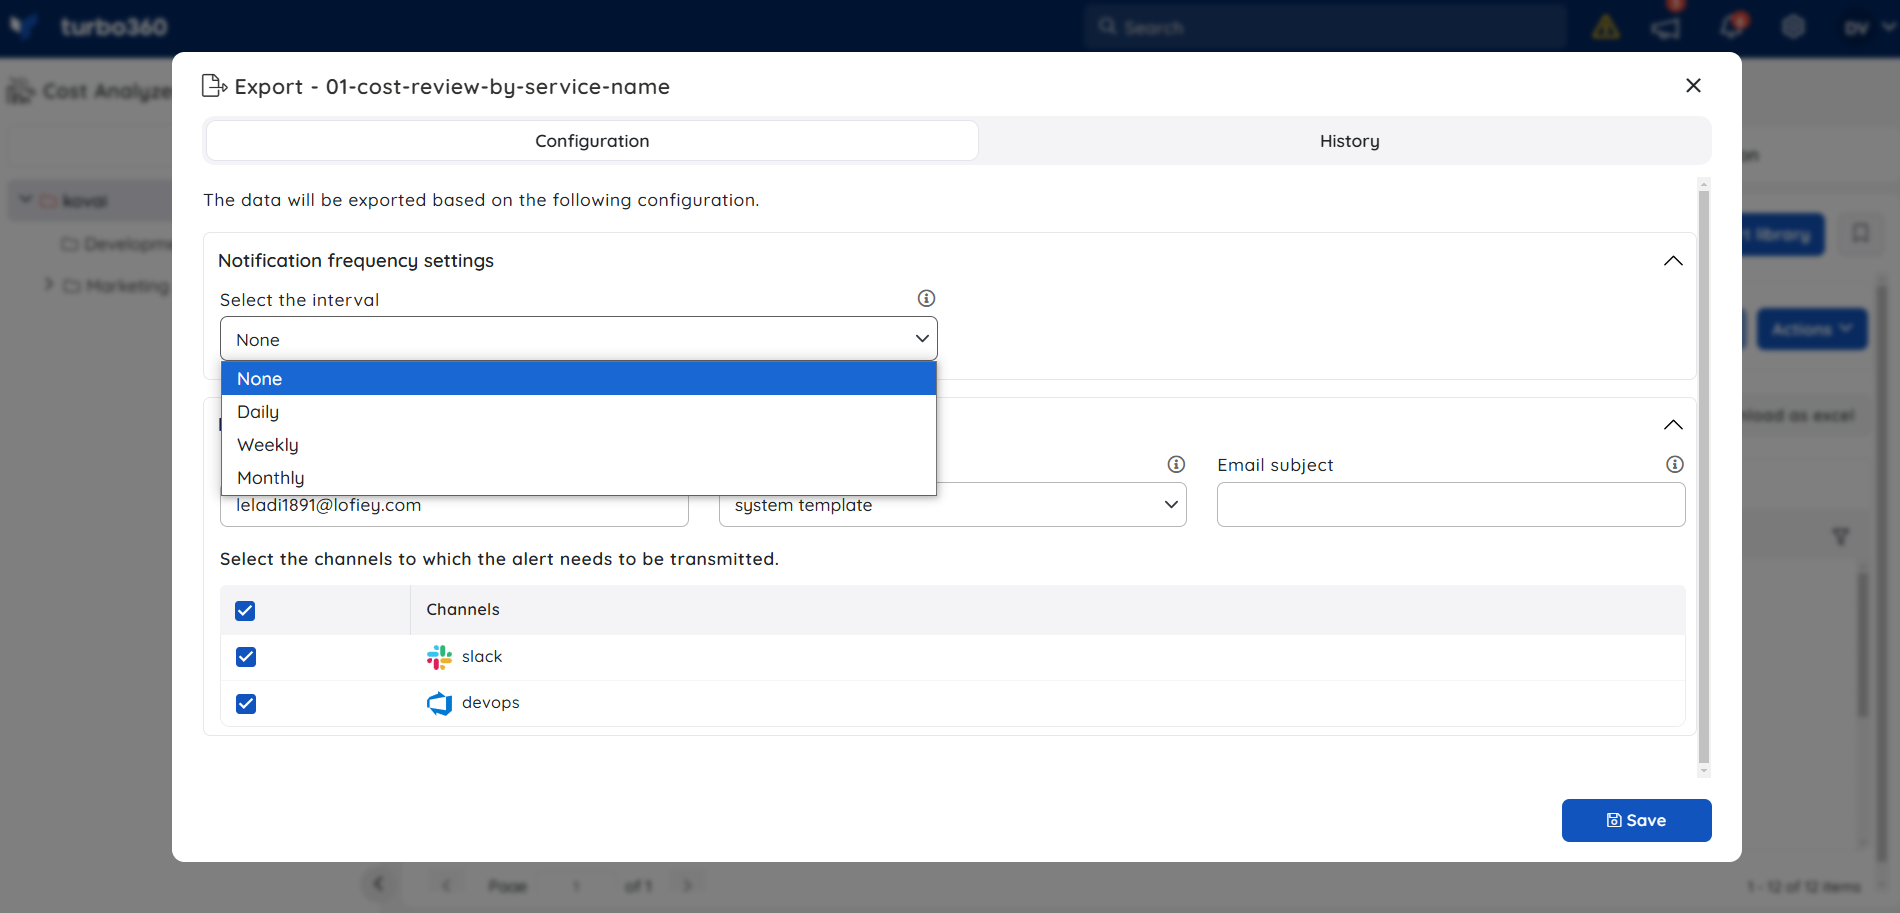
Recurring exports can be scheduled daily, weekly, or monthly to deliver the data automatically to configured notification channels.
The exported data will be available in Excel (.xlsx) format and includes all cost data shown in the analysis view.
Setting up scheduled exports
- Navigate to the Analysis section within the required cost management group.
- Create and configure the analysis view based on the recurring cost tracking requirements, then save the view.
- Select Actions -> Export to configure the export schedule.
Specify the export frequency as needed.
Configure the required notification services.
Enable Download the exported data from notifications (open link) to access the export directly from the alert.
Click Save to apply the settings.
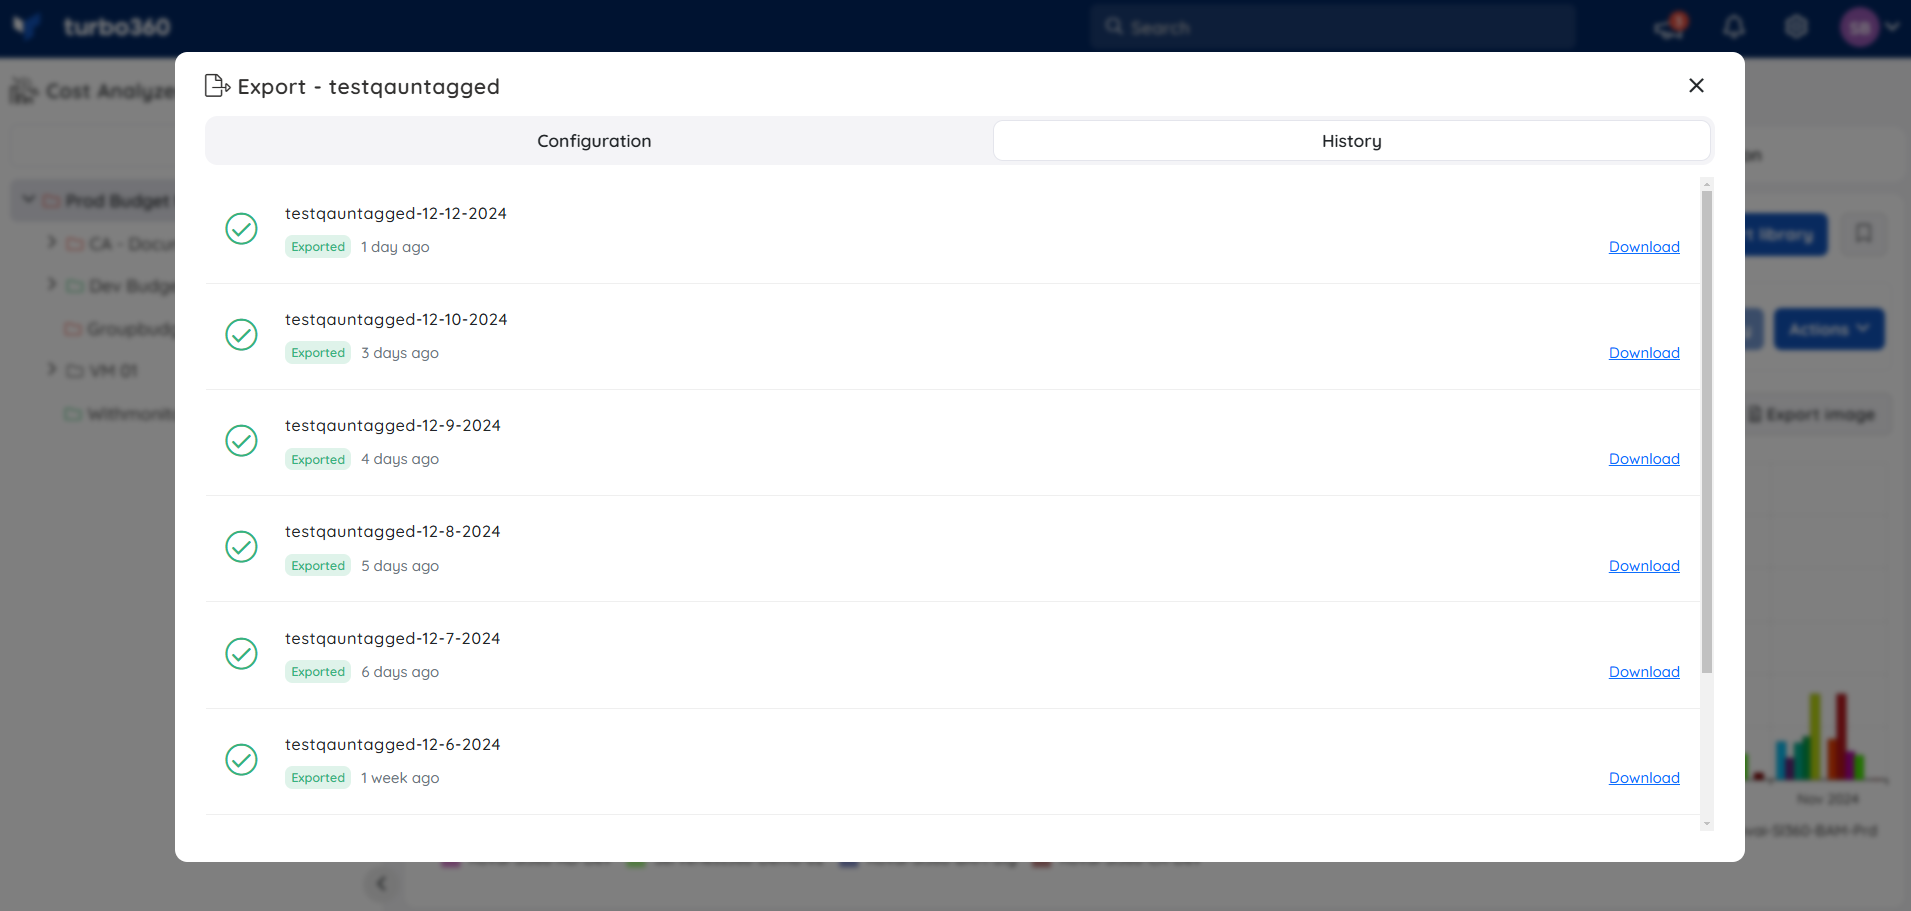
Use the History tab to access and download past exports.
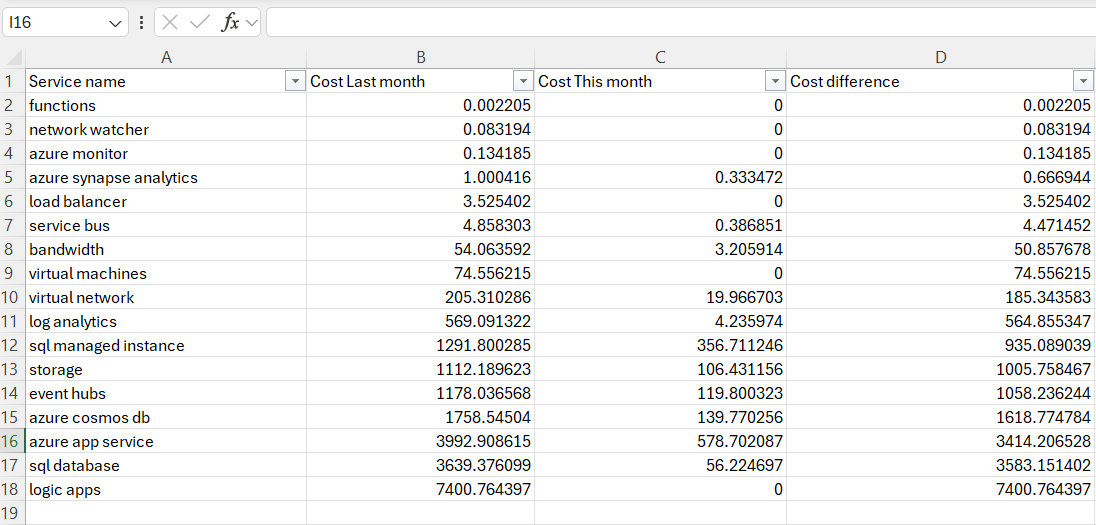
Sample export data
The image below illustrates a sample exported data generated for an analysis view within a cost management group:
Was this article helpful?