Spot instances
- 15 Apr 2026
- 1 Minute to read
- Print
- DarkLight
- Download PDF
Spot instances
- Updated on 15 Apr 2026
- 1 Minute to read
- Print
- DarkLight
- Download PDF
Article summary
Did you find this summary helpful?
Thank you for your feedback!
Introduction
The Spot instances view provides a list of all Spot Virtual Machines available across Azure subscriptions and highlights the cost incurred in the previous month along with the estimated savings compared to on-demand pricing.
This helps identify the cost benefits of running workloads on Spot VMs.
Navigation
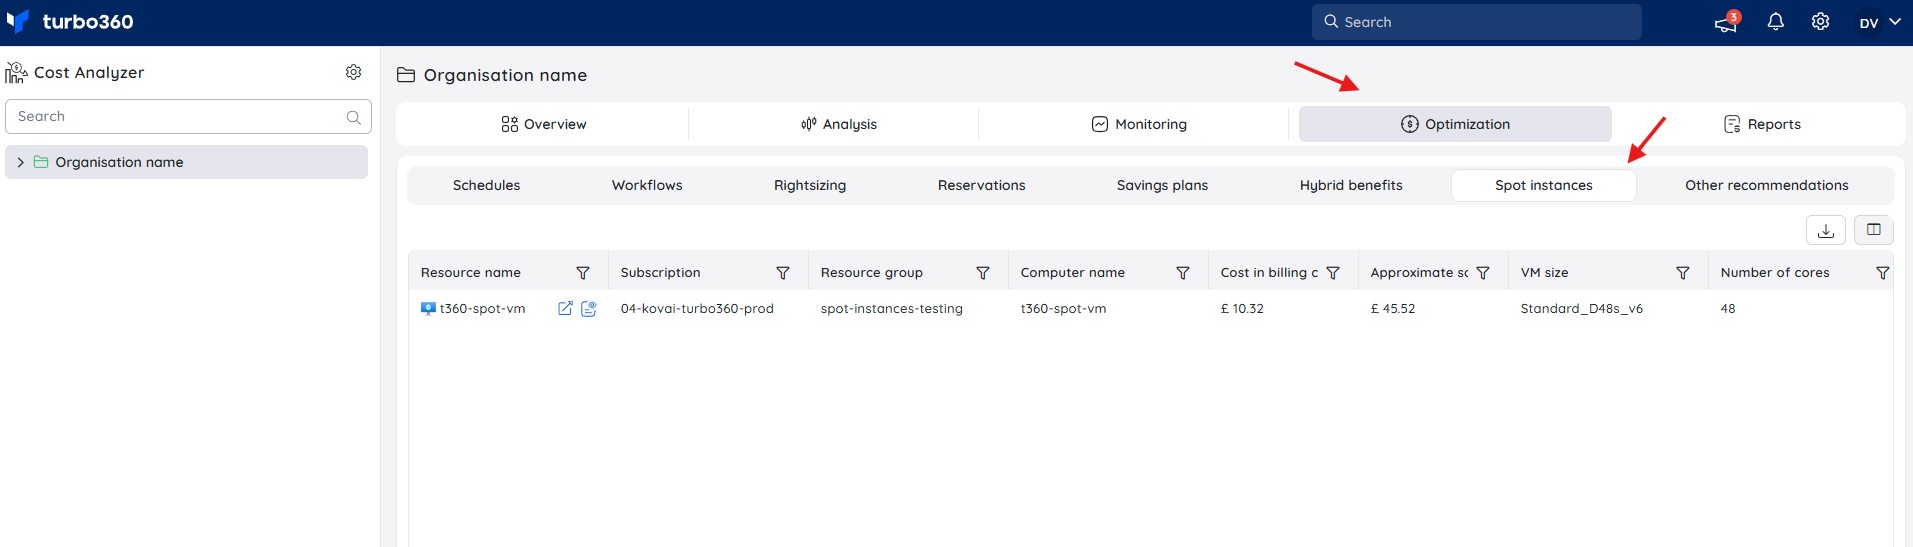
- Switch to the Optimization tab available within a cost management group.
- Choose Spot instances from the available optimization categories.
This view presents a structured table of all Spot VM resources available in the Azure subscriptions.
Understanding the interface
Each row represents a Spot VM and provides cost details for the previous month and resource details.
Resource inventory
Each row represents an individual Spot Virtual Machine, allowing users to quickly identify:
- Resource name
- Subscription
- Resource group
- Computer (VM) name
This contextual information ensures that every cost insight is tied back to a specific workload.
Cost in billing currency
This column reflects the actual cost incurred for each Spot VM during the previous billing cycle.
Approximate savings
This column highlights the estimated savings achieved by using Spot Instances instead of equivalent on-demand VMs.
The value is derived by comparing:
- Spot VM cost (actual spend)
- Corresponding on-demand pricing for the same configuration
This allows users to immediately quantify the financial benefit of their Spot usage.
VM configuration insights
Additional columns such as:
- VM size (e.g., Standard_D48s_v6)
- Number of cores
offer deeper visibility into the scale and capability of each instance. This helps teams correlate cost and savings with workload size and performance characteristics.
Export
Use the download icon (top-right of the table) to export the Spot Instances data for offline analysis.
Savings calculation
- The system analyzes Spot VM usage from the previous month.
- It determines the equivalent on-demand pricing for the same VM size and configuration.
- The difference between on-demand cost and actual Spot cost is shown as Approximate savings.
Use case
Use this view to:
- Review Spot VM usage across subscriptions
- Identify cost benefits of Spot adoption
- Compare actual spend vs potential on-demand cost
Was this article helpful?