- 19 Nov 2024
- 3 Minutes to read
- Print
- DarkLight
- PDF
SQL Database
- Updated on 19 Nov 2024
- 3 Minutes to read
- Print
- DarkLight
- PDF
Introduction
Azure SQL Database is a general-purpose relational database-as-a-service (DBaaS) based on the latest stable version of Microsoft SQL Server Database Engine.
SQL Database is a high-performance, dependable, and secure cloud database that allows users to create data-driven applications and websites in their desired programming language without having to maintain infrastructure.
Queries
- Turbo360 extends its capability to execute SQL Queries without a need to switch to any database management tools.
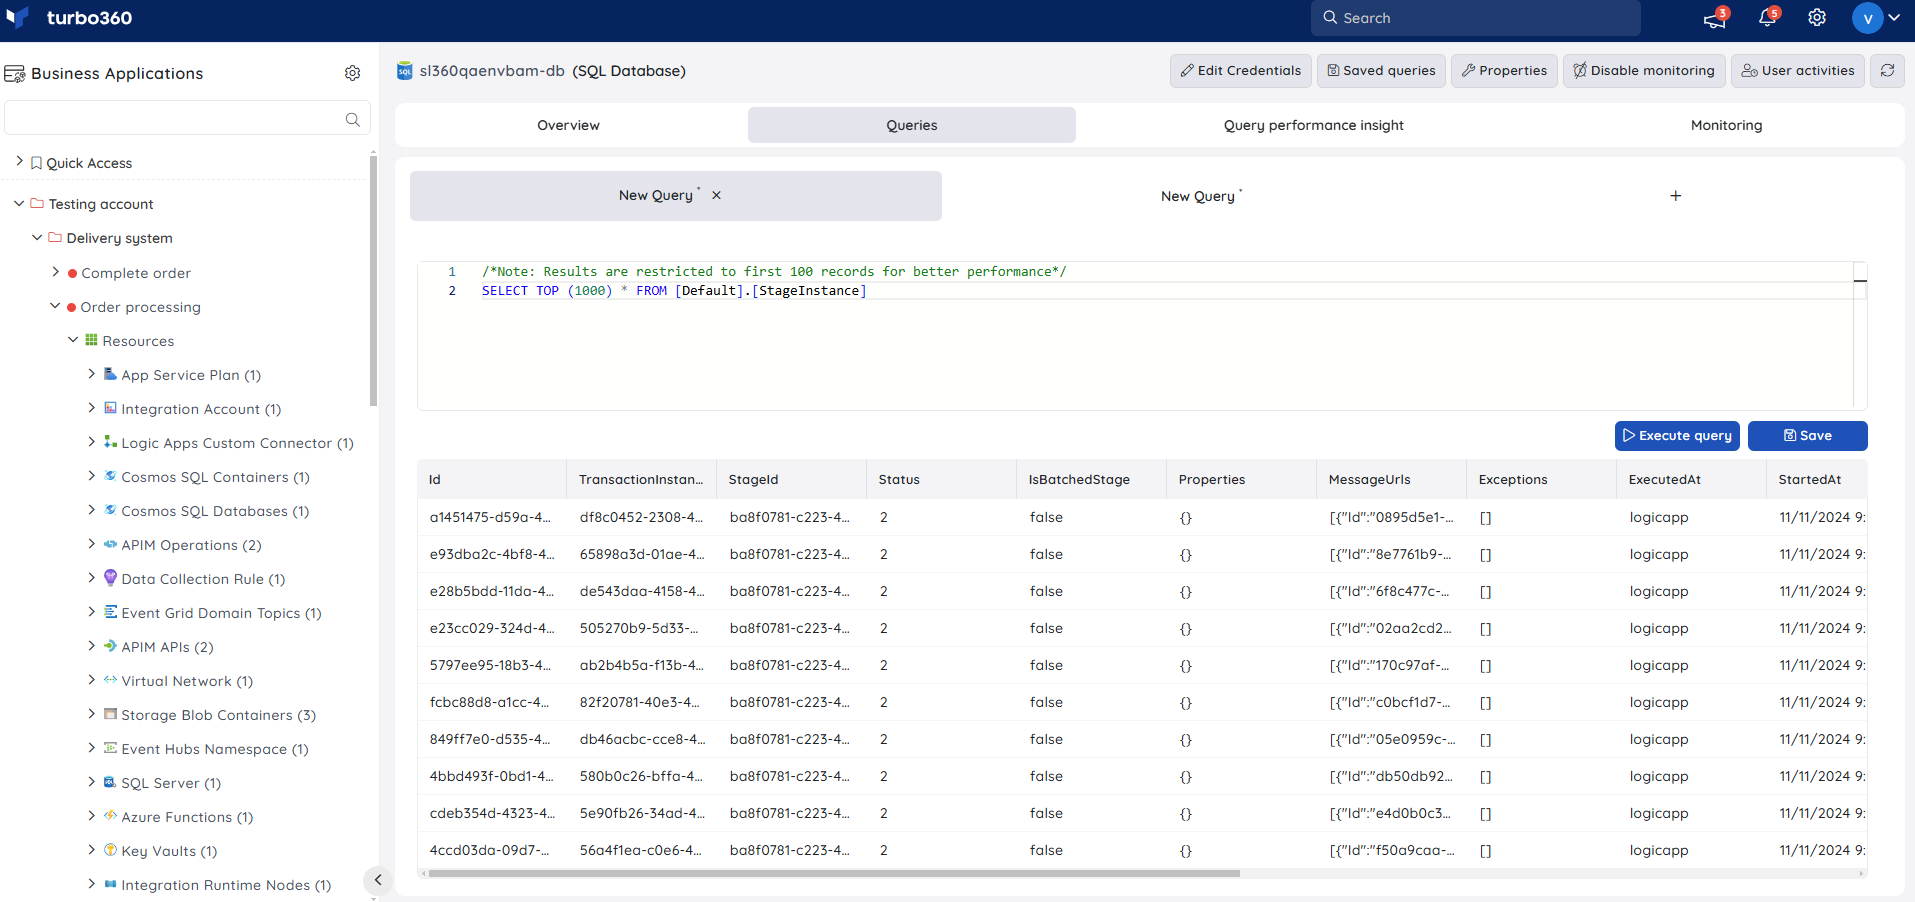
Consider a business scenario which requires checking the number error logs from the tables present in the database from different servers. Using any database management tools requires switching between different servers to check the number of logs.
Here comes the significant usage of Turbo360. When multiple SQL databases from different servers are associated to a Business application, queries can be executed on all the associated databases without having to switch servers.
Turbo360 also provides the capability to the save the queries that are frequently used, so that the process of manually entering the query can be eliminated.
Pre- requisites
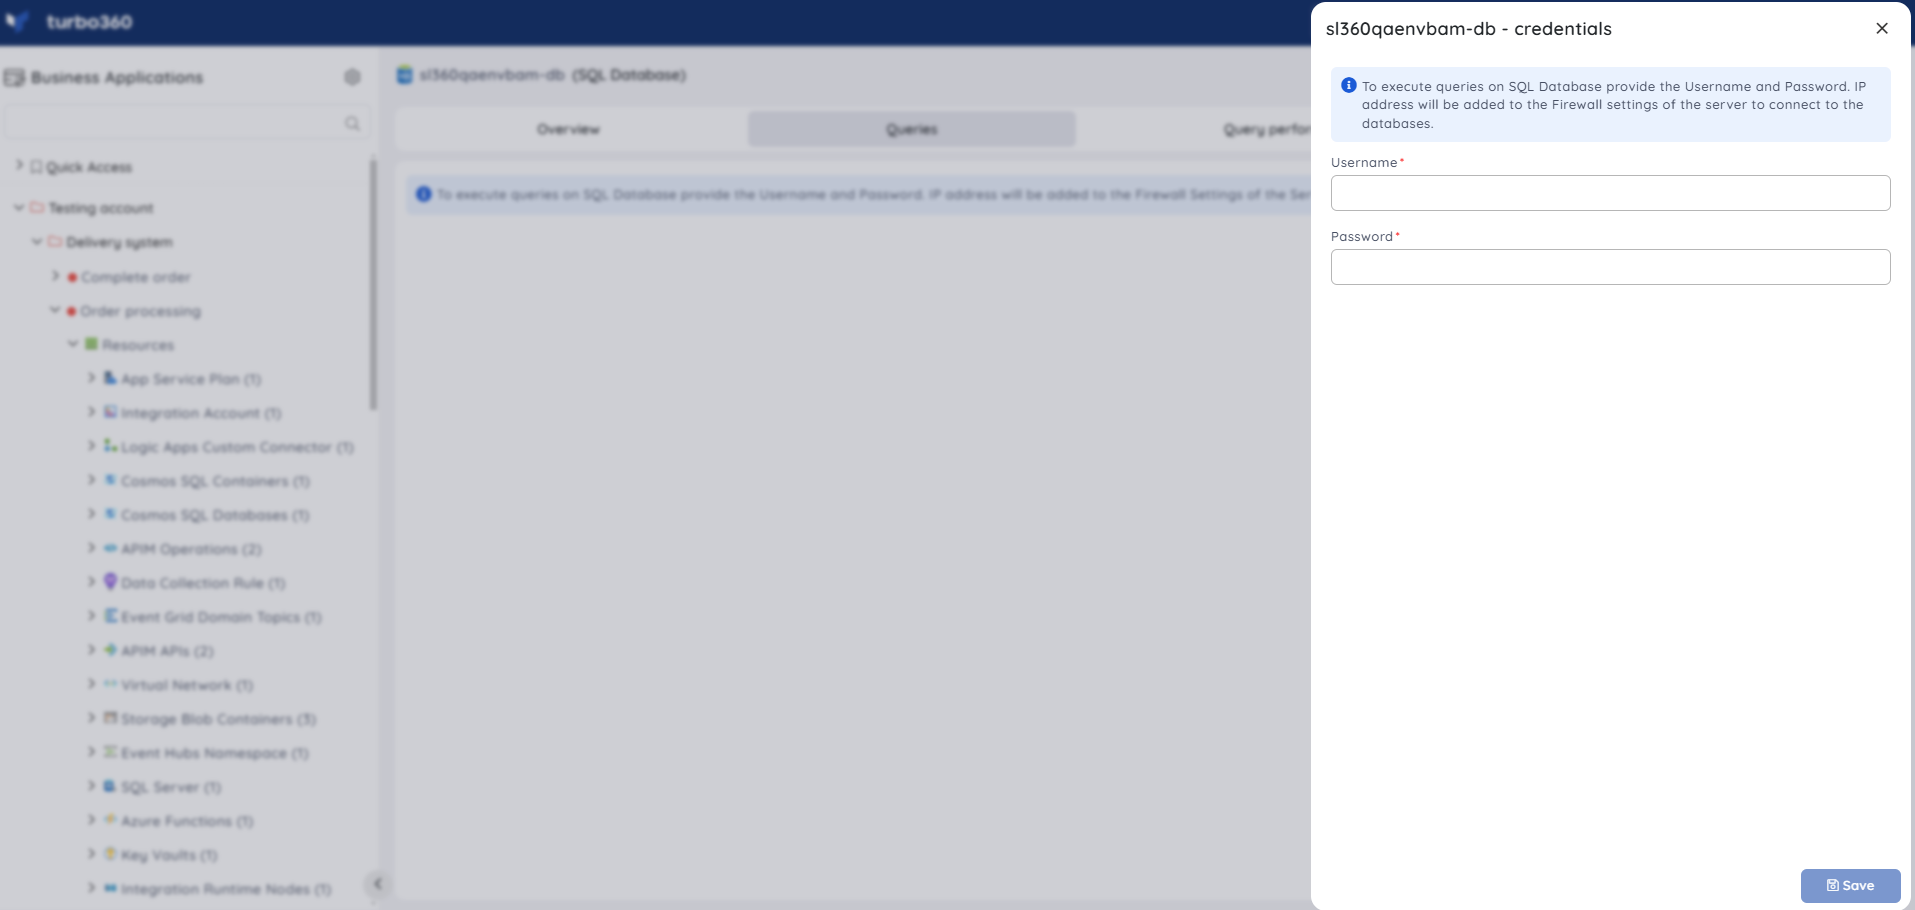
- To execute queries on SQL Database, user should be authenticated by providing the Username and Password.
Note
Turbo360's IP address will be added to the Firewall Settings of the Server to connect to the Databases.
Query Performance Insight
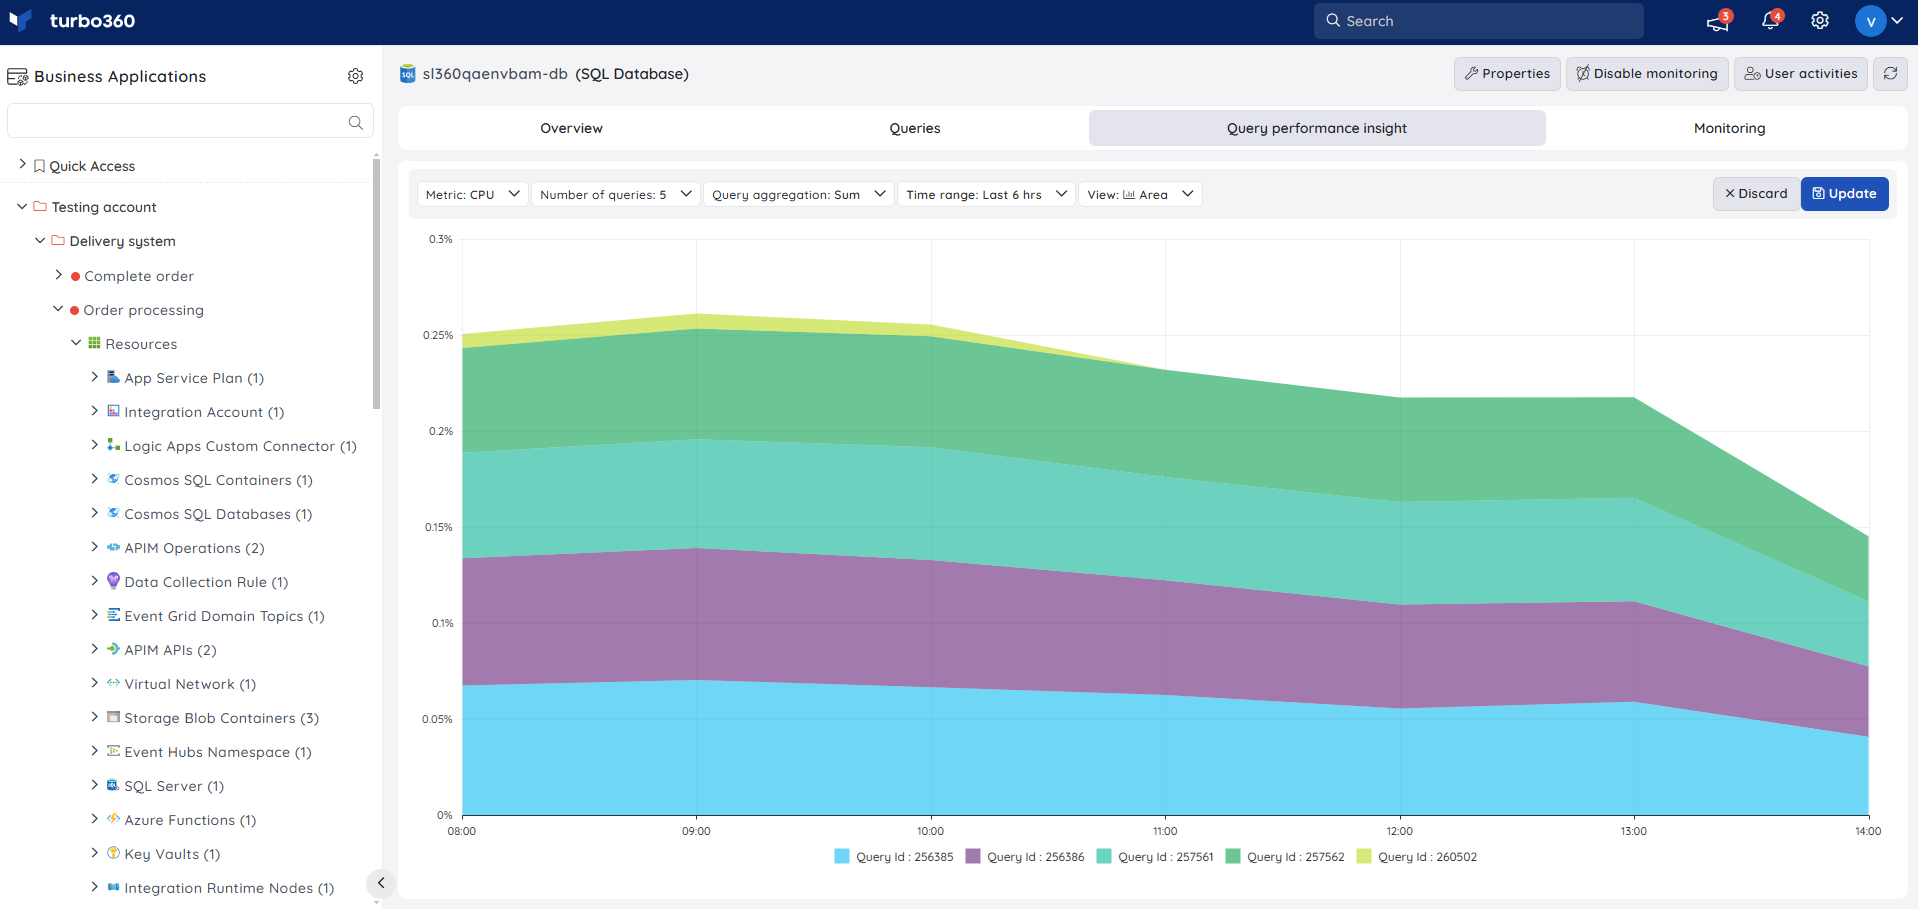
Query Performance Insight (QPI) in Turbo360 helps users to get insights on Top 5, 10 or 20 queries based on different metrics namely, CPU, DataIO, LogIO, Duration or Execution Count.
Resource Dashboard
Users have access to a default SQL Database Dashboard within the SQL Database resource, allowing for enhanced data visualisation and tracking of real-time data.
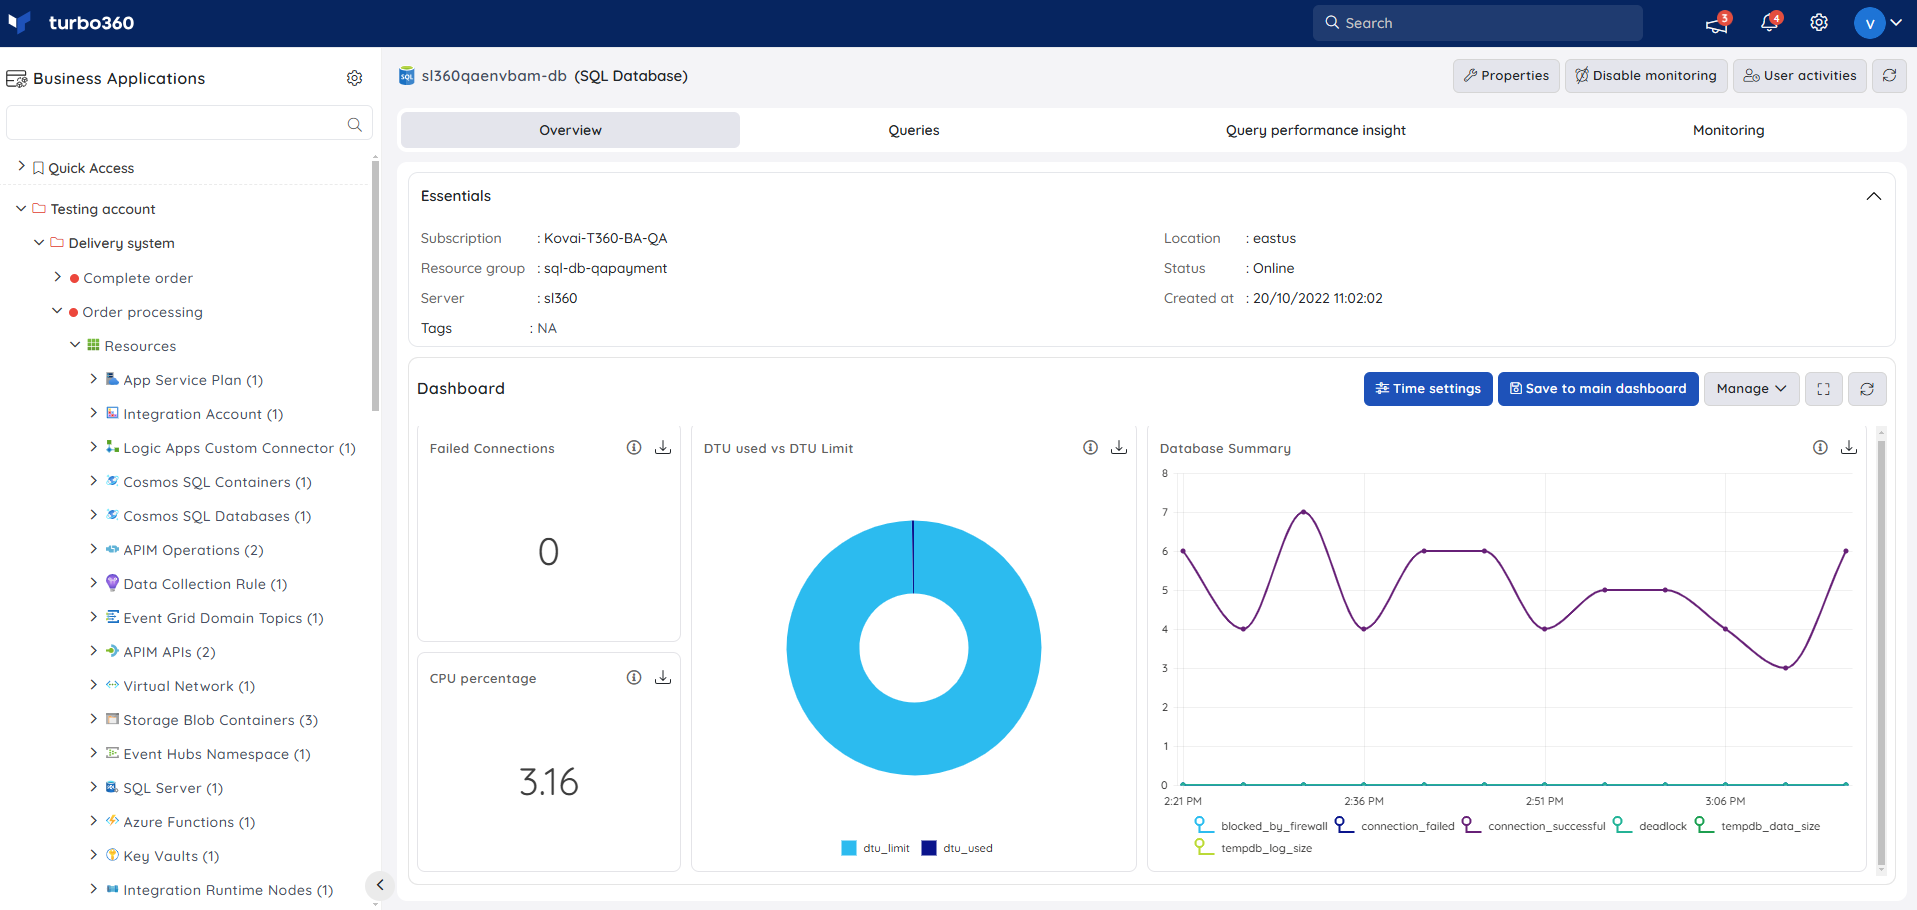
Users are provided with the following pre-defined Dashboard widgets, which can be customised to meet their specific needs.
1. Failed Connections
2. DTU used vs DTU Limit
3. Database Summary
4. CPU percentage
Monitoring
Availability status monitoring
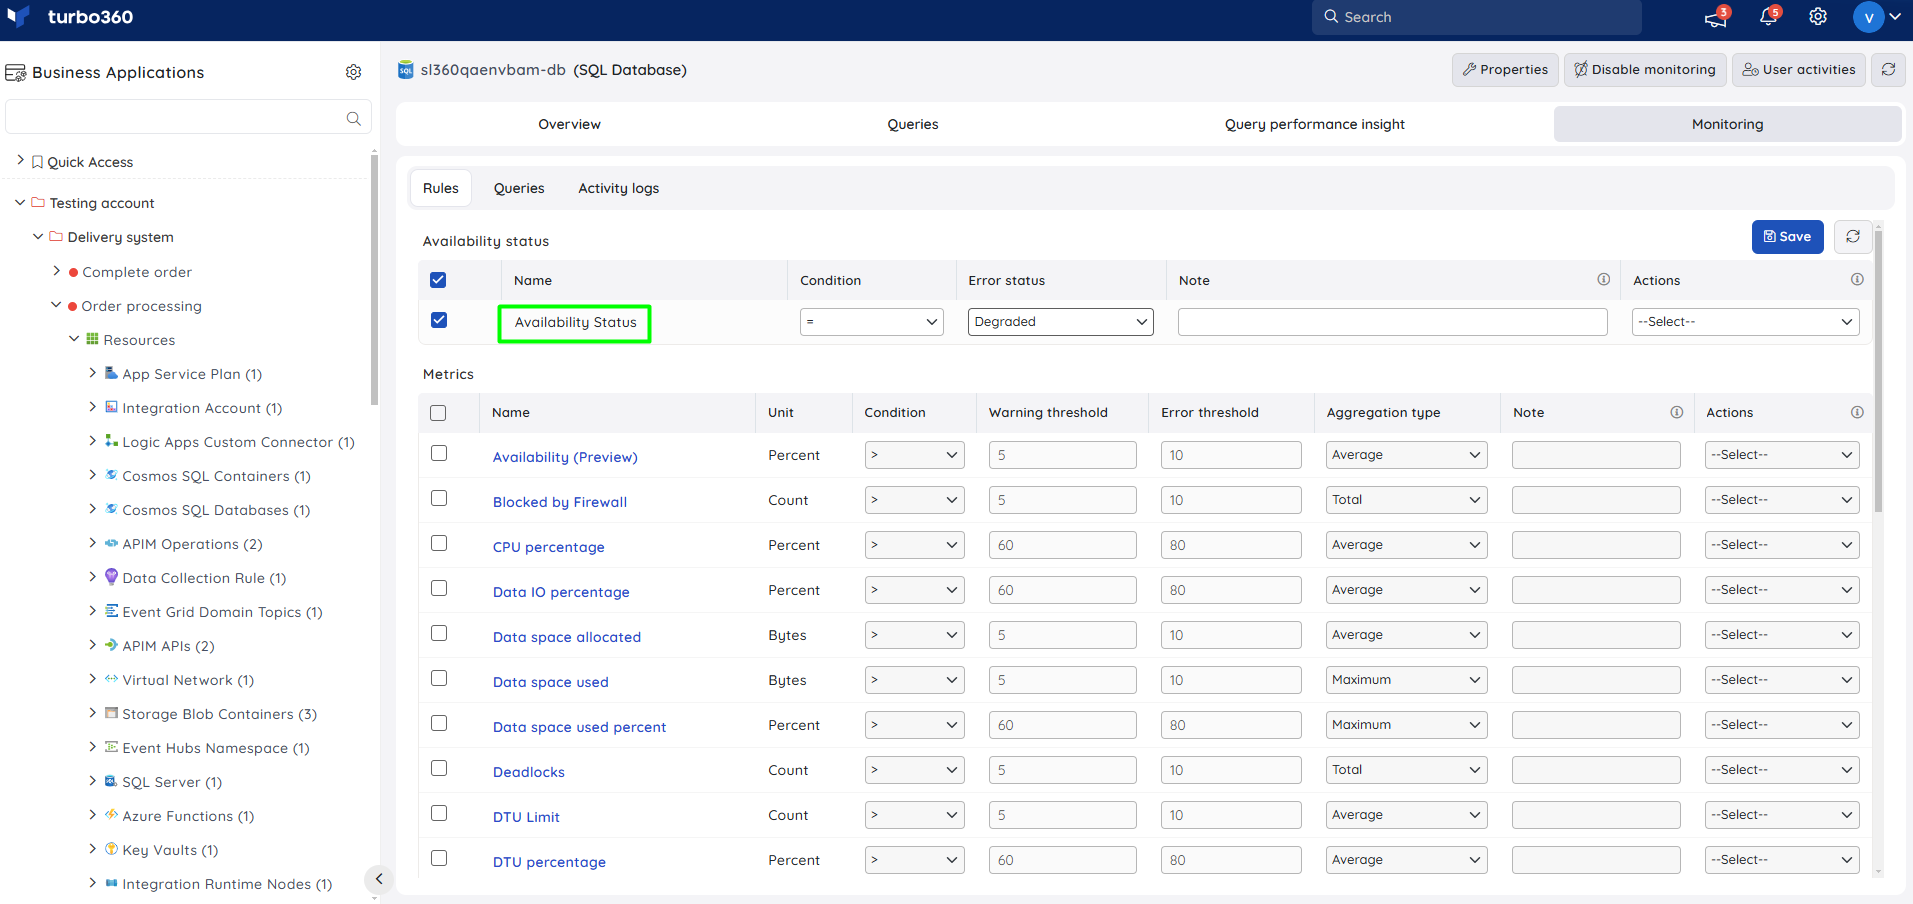
The resource health status can be monitored for SQL Databases by configuring the Availability status monitoring rule.
- Navigate to SQL Database -> Monitoring
- Configure Availability status with the desired threshold
- Click Save
Metric monitoring
- Navigate to SQL Database -> Monitoring
- Select the necessary monitoring metrics and configure the threshold values
- Click Save
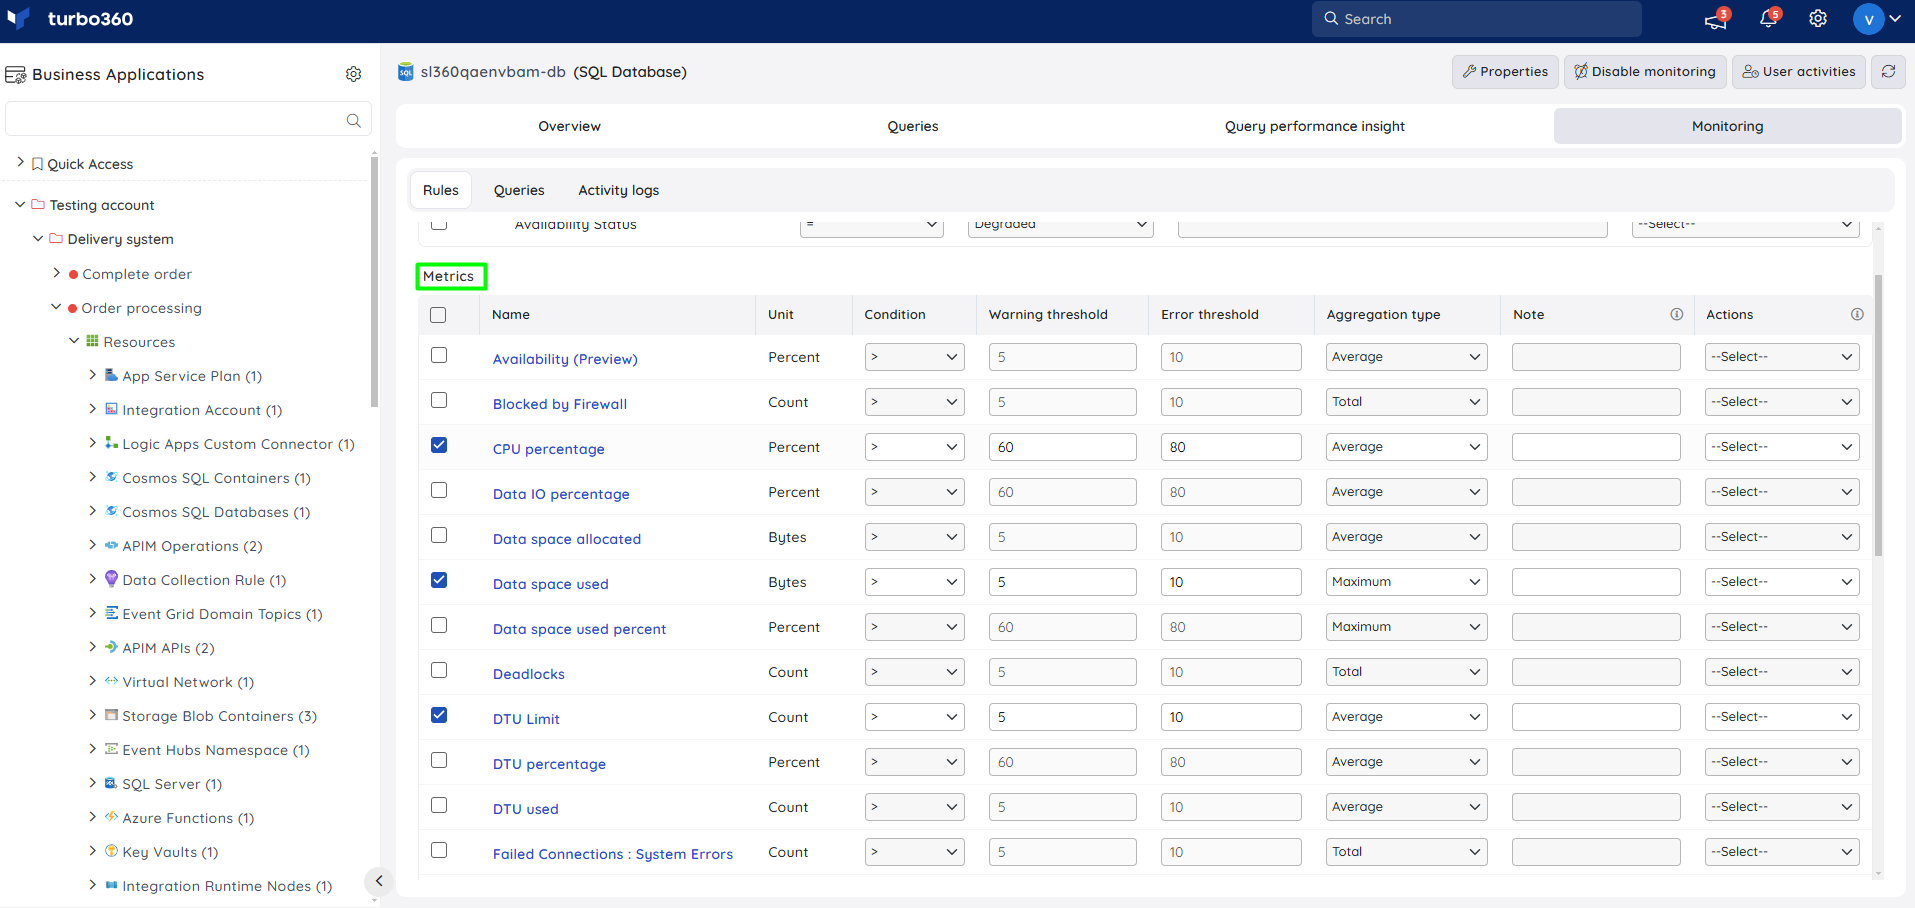
The threshold values can also be provided with any metric name, defining the monitoring rule to be violated when the metric value configured at threshold field is met.
Monitoring rules will be saved for SQL Database, and the monitoring state for the metrics will be reflected after every monitoring cycle.
Monitoring Recommendations
Metrics
When monitoring your Azure SQL Database there are a number of metrics available which indicate how your database might be performing.
DTU Model
| Metric | Warning | Error |
|---|---|---|
| DTU Percentage | 90 | 95 |
- DTU percentage applies to the DTU billing model and is a combo of other counters which represent the performance of the database.
vCore Model
| Metric | Warning | Error |
|---|---|---|
| CPU percentage | 90 | 95 |
| Data IO percentage | 90 | 95 |
| Data space used percent | 90 | 95 |
| Log IO percentage | 90 | 95 |
| SQL instance CPU percent | 90 | 95 |
| SQL instance memory percent | 90 | 95 |
| SQL Server process core percent | 90 | 95 |
| SQL Server process memory percent | 90 | 95 |
| Tempdb Percent Log Used | 90 | 95 |
The recommendations here are a guide for an application that is configured on Azure with appropriate scaling. There are a number of different scenarios which you can configure so we recommend discussing the monitoring with your DBA and application developers to make sure the settings are appropriate for your applications expected behaviour
Connection Monitoring
If you want to monitor the connections to your database then the below metrics are useful.
- Successful Connections
- Failed Connections : User Errors
Successful connections can be used to monitor for the expected max number of connections to detect scenarios where you might have a concern of an attack on your database. This counter would be used depending upon the way your application is configured to work.
Failed Connections may indicate the application is having issues connecting to your database.
Log Monitoring
If you are exporting your SQL Azure database logs to Log Analytics then we have a number of queries available in the query library for monitoring Log Analytics in Turbo360 which can be used with SQL Azure Database.
More Info
There is more info on the microsoft metrics on the below link:

