When you implement a schedule, understanding its behaviour and how it will impact your Azure bill helps you interpret your cost data correctly.
What you should typically expect
When you implement a schedule, you take a set of resources and change their billing status at defined points in time. A typical example is a VM shifted from running 24/7 to running from 9am to 5pm, five days a week.
This is a one-time change. Once the schedule is on, you'll see a significant cost saving over the following 30 days compared to the previous 30, and that lower cost level, becomes your new permanent baseline.
You have reduced the baseline cost, but you won't see that reduction appear as a new saving every month.
Discussion points
Below are some common observations and discussion points related to schedulers.
1️⃣ Actual cost drops once, then flat-lines
This is the most common misconception with a scheduler approach. You won't see huge month-over-month savings; you'll see a baseline drop in your costs in month 1, then a flat line as that reduction is maintained.
The diagram below shows what healthy scheduler behaviour looks like.
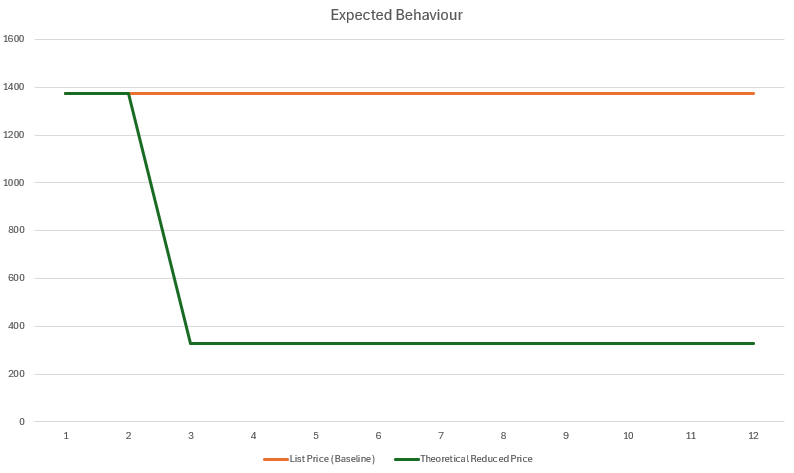
An Example Observation
Month 1 (Jan): Cost = 1400
Month 2 onward: Cost = 375, every single month
No further month-over-month reduction after month 3
What this tells us
The scheduler created a step change
Once the new baseline was reached, there was:
No additional incremental savings
No regression either
This is exactly how schedulers should behave.
Key takeaway
The scheduler permanently reduced the run-rate.
It did not create compounding monthly savings.
Sometimes you may misinterpret "flat" as "not working".
2️⃣ "Additional savings vs last month" only appears once
Observation
The data looks like this:
March shows 1025 savings
Every month after shows 0
Why this is important
This data point is the source of confusion.
Customers perceive:
Big theoretical savings every month
Zero "new" savings after month one
And conclude:
"The scheduler stopped saving us money."
What's actually happening
March captured the entire baseline drop
From April onward, the savings are already embedded
You are comparing a new steady state to itself
Key takeaway
Month-over-month deltas are the wrong metric for schedulers.
Schedulers should be measured by baseline reduction, not monthly variance.
3️⃣ Amortized cost aligns to the new baseline immediately
Observation
Amortized Cost equals 375 from January onward
It matches Actual Cost perfectly after the first drop
What this tells us
Reservations / Savings Plans are:
Either fully absorbed
Or fully reallocated elsewhere
Billing has stabilized around the new schedule-driven run-rate
This is actually a sign of a healthy state.
Key takeaway
Once amortization stabilizes, the environment is optimized.
4️⃣ I feel like I should be getting more cumulative savings
Observation
By Dec, Theoretical Cumulative Savings = 10,250
Monthly cost never drops below 375
Why this matters
The cumulative theoretical number is mathematically true but psychologically misleading.
Customers may think:
"We should be seeing thousands more in savings by now."
But in reality:
The unoptimized costs for the 12 months would have been 16,800 (1400 × 12)
The cost you paid was 6550 (1400 × 2 + 375 × 10)
The savings were realized as a permanent reduction when the scheduler started
Not as accumulating cash month by month
Your monthly savings are best measured against what you would have spent with no optimization: against the month before the scheduler was turned on
Key takeaway
When you use a scheduler, frame cumulative savings carefully when talking to stakeholders, or they will:
Undermine trust
Create unnecessary billing conversations
Distract from the real win (lower run-rate)
When discussing scheduler savings in, say, June, you may be talking to people who feel the costs haven't improved, because the line is flat. What they've forgotten is that the baseline drop already happened in March.