- 19 Nov 2024
- 2 Minutes to read
- Print
- DarkLight
- PDF
Virtual Machine
- Updated on 19 Nov 2024
- 2 Minutes to read
- Print
- DarkLight
- PDF
Introduction
Virtual Machines (VMs) are virtual computers with dedicated amounts of RAM, CPU power, and storage that are borrowed from a physical host computer. A virtual machine is a computer file, typically an image, that acts like a real computer.
A virtual machine can have any operating system, that runs in a window as a separate computing environment. Users can choose between the Linux distribution or Windows Server in terms of the operating system.
The virtual computing environment can be protected from any vulnerabilities by selecting one of the security types available in the Azure portal when creating a Virtual Machine.
Interlinked resources
Resources that are created during the deployment of a Virtual Machine are:
- Resource Group
- Storage Account
- Virtual Network
- Public IP Address
- Network Interface
- Data Disks
Functionality
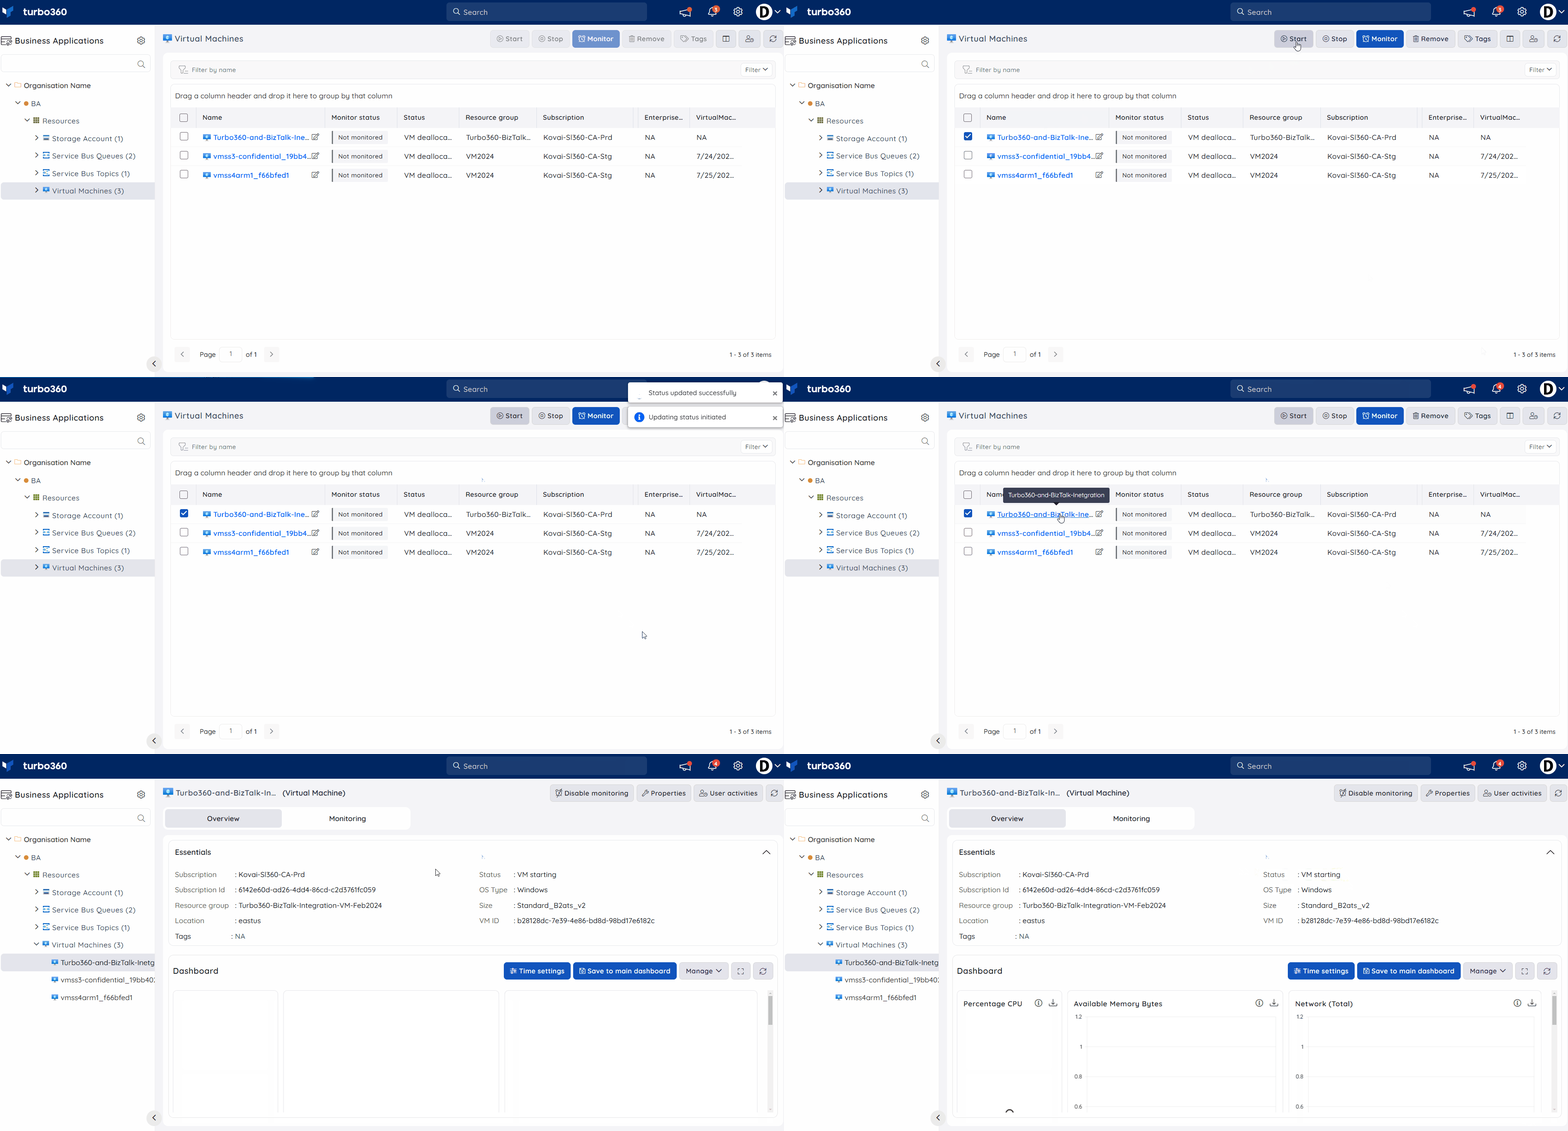
A Virtual Machine (VM) resource created using Microsoft Azure on any subscription can be managed with the help of Turbo360 by executing the operations supported by the Virtual Machine (VM).
The operations that can be performed include:
- Start
- Stop
- Restart
Any operation performed using Turbo360 gets reflected in the Azure portal, resulting in a feasible implementation.
Bulk operation
All the above-mentioned Virtual Machine (VM) operations can also be performed in bulk by choosing all the required resources from the Virtual Machines Resources section and selecting the required breadcrumb option.
Resource Dashboard
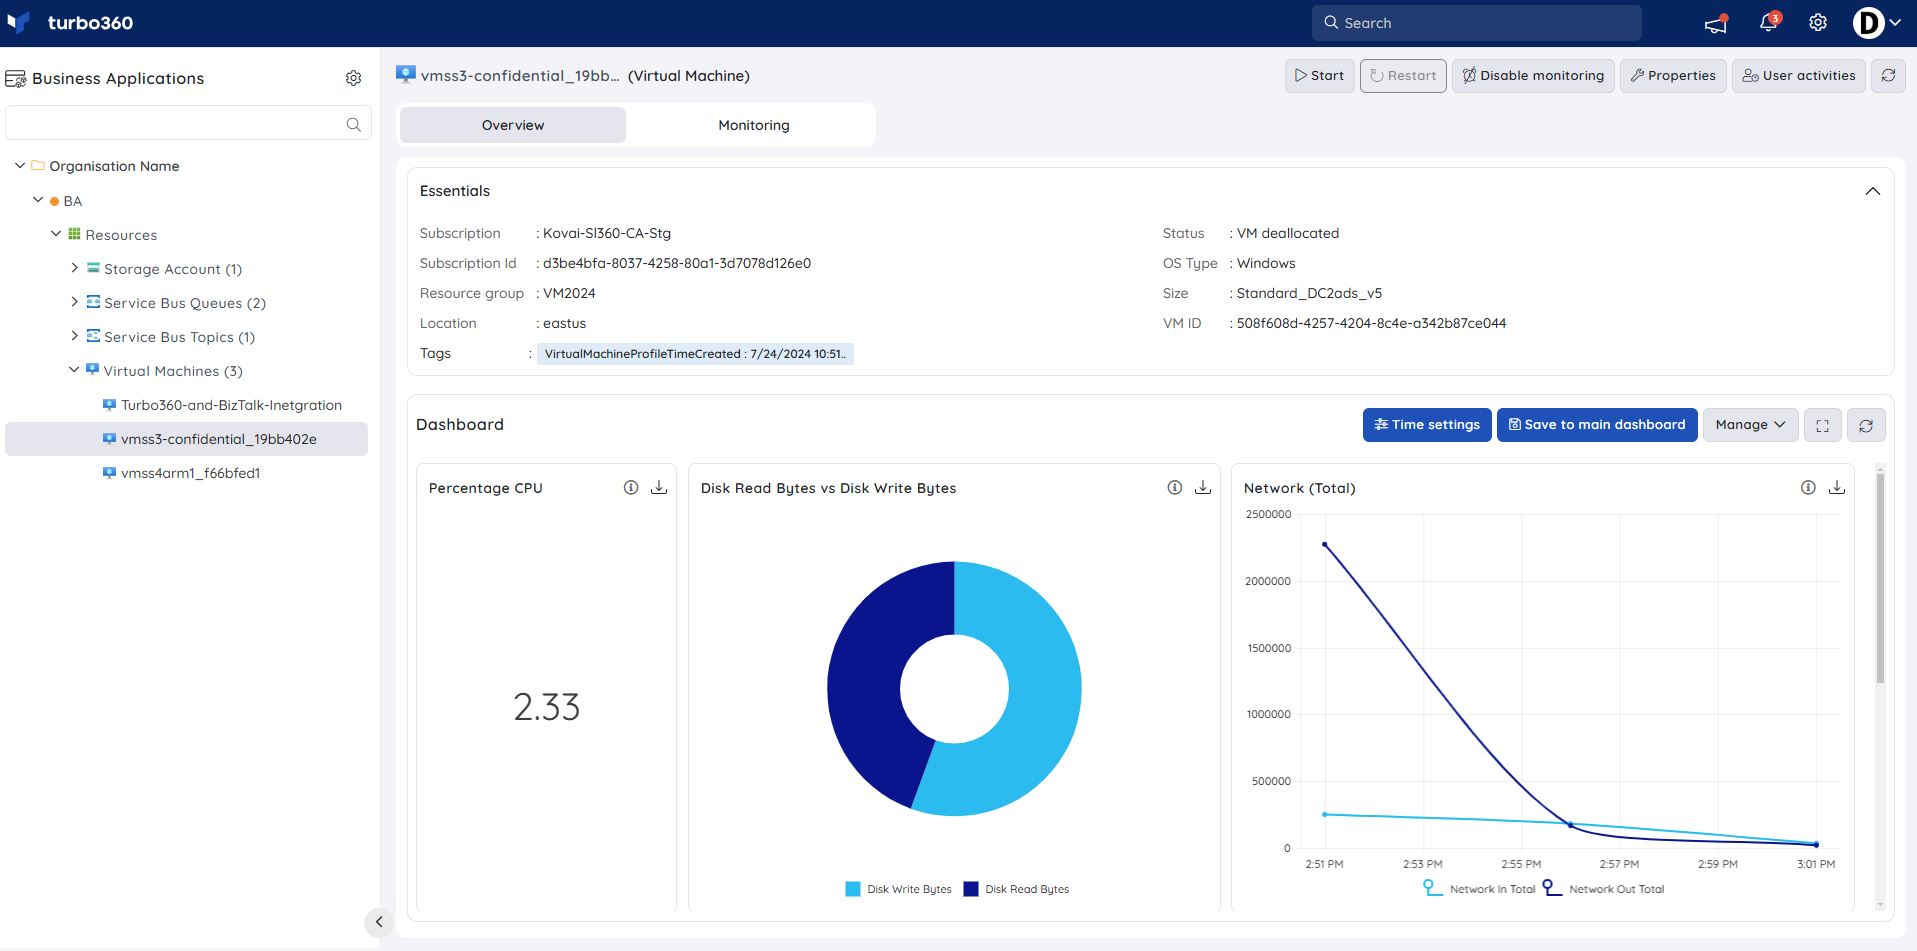
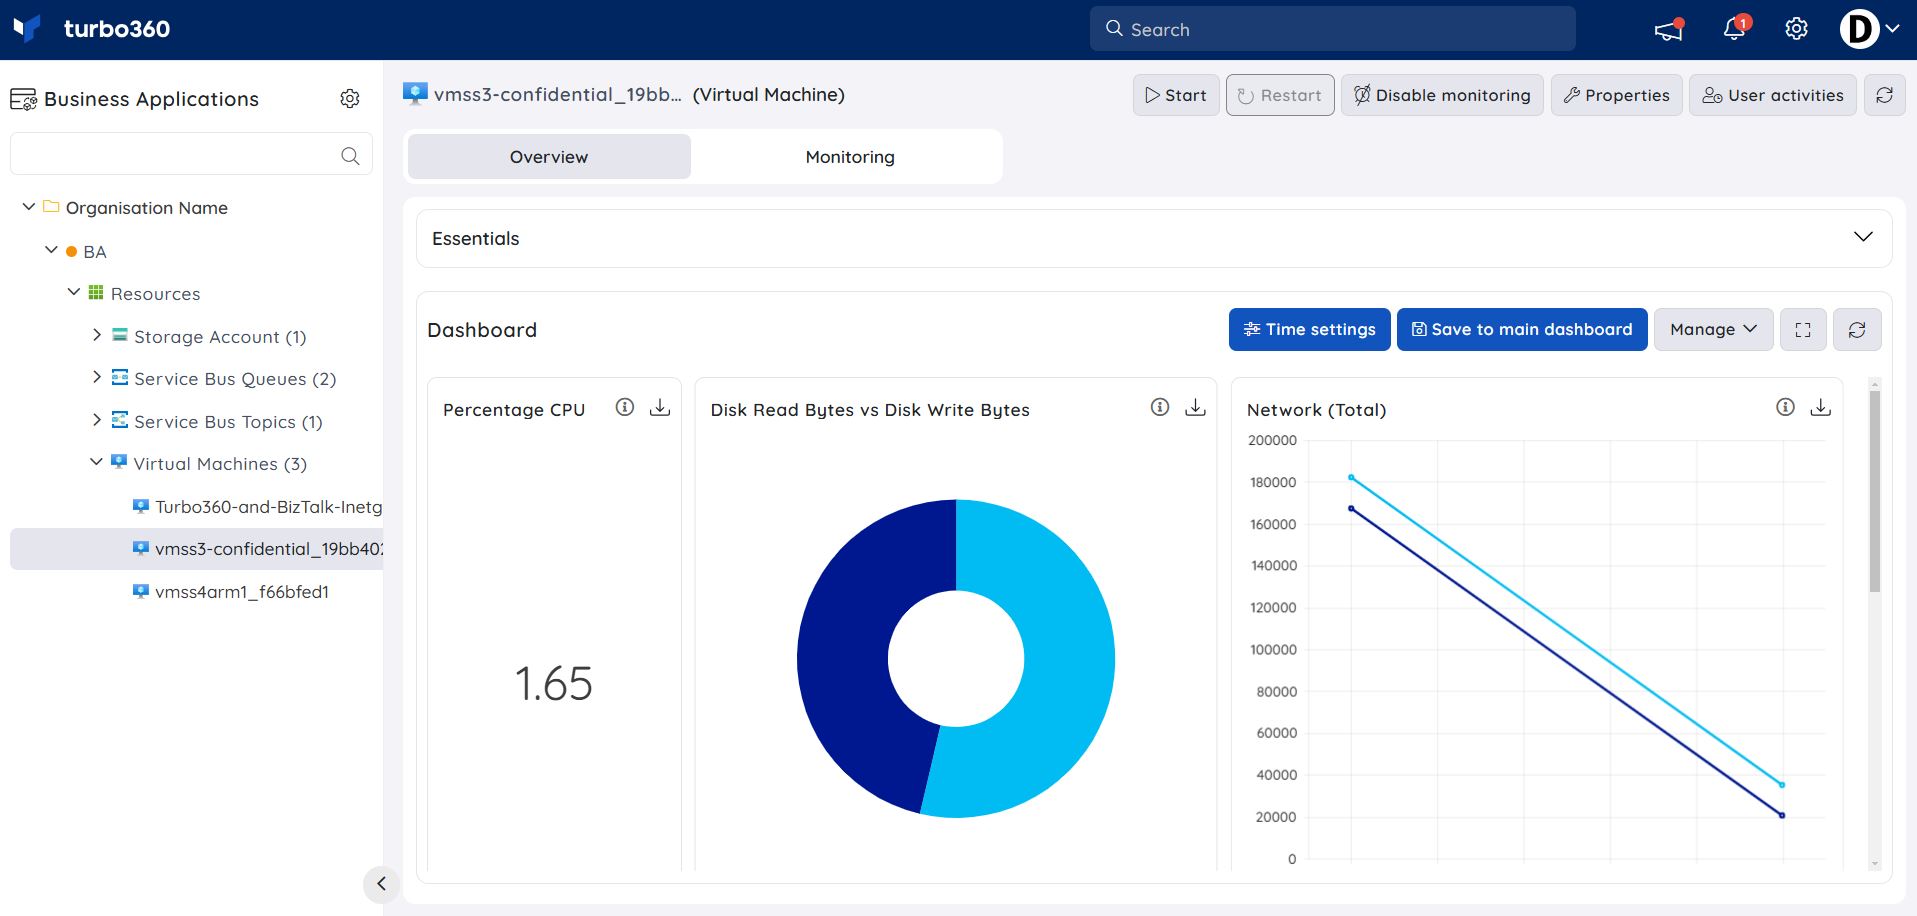
The Virtual Machine resources include a built-in Resource Dashboard with pre-defined dashboard widgets, allowing users to visualize the resource metrics at a specified time period.
The following are the pre-defined widgets of the Virtual Machine Resource Dashboard:
1. Percentage CPU
2. Available Memory Bytes
3. Network (Total)
4. Disk Read Bytes Vs Disk Write Bytes
5. Disk Operations/Sec (Average)
Monitoring
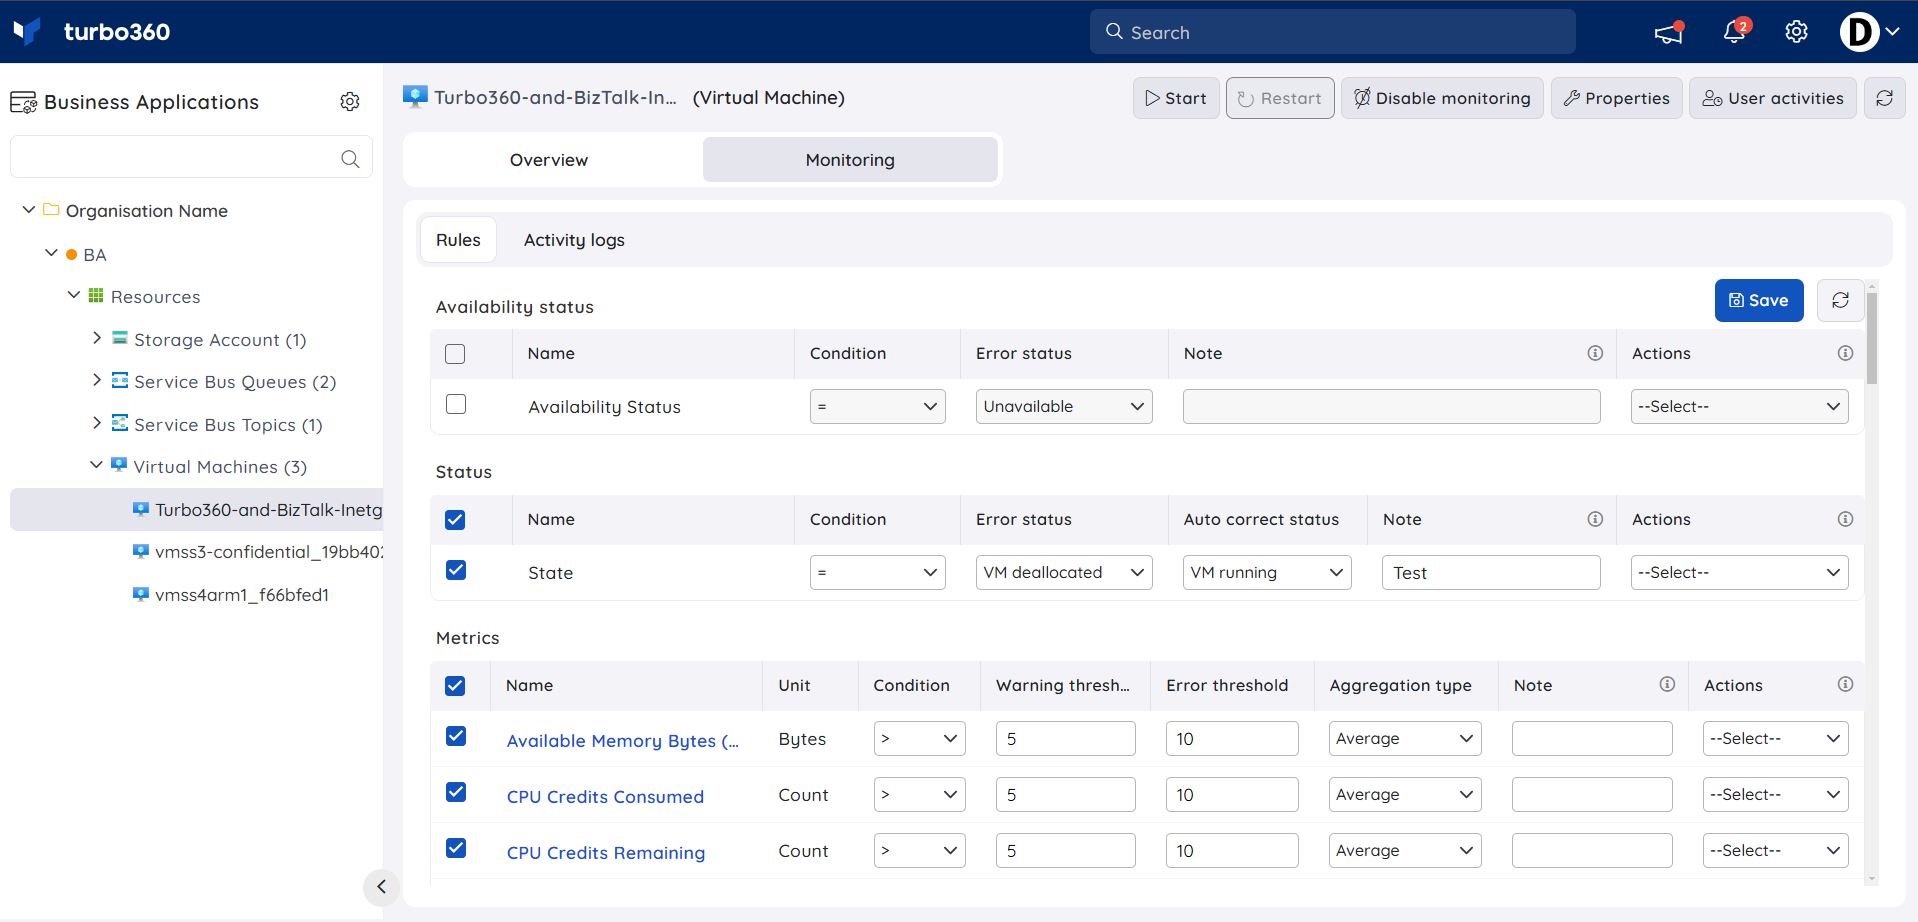
A Virtual Machine resource can be monitored by configuring the required rules available for monitoring.
Navigate to the Monitoring section of the resource to configure the monitoring rules for Virtual Machine.
Users can specify monitoring threshold values based on their needs.
When the monitoring rule type is a metric, selecting metrics against metric rules is also an option.
Monitoring Recommendations
In this section we will discuss some of the common monitoring recommendations and scenarios.
State
If you want to monitor that the state of your VM is in a running state then you can turn on state monitoring as shown below where we are raising an alert if the VM is in any state other than running.
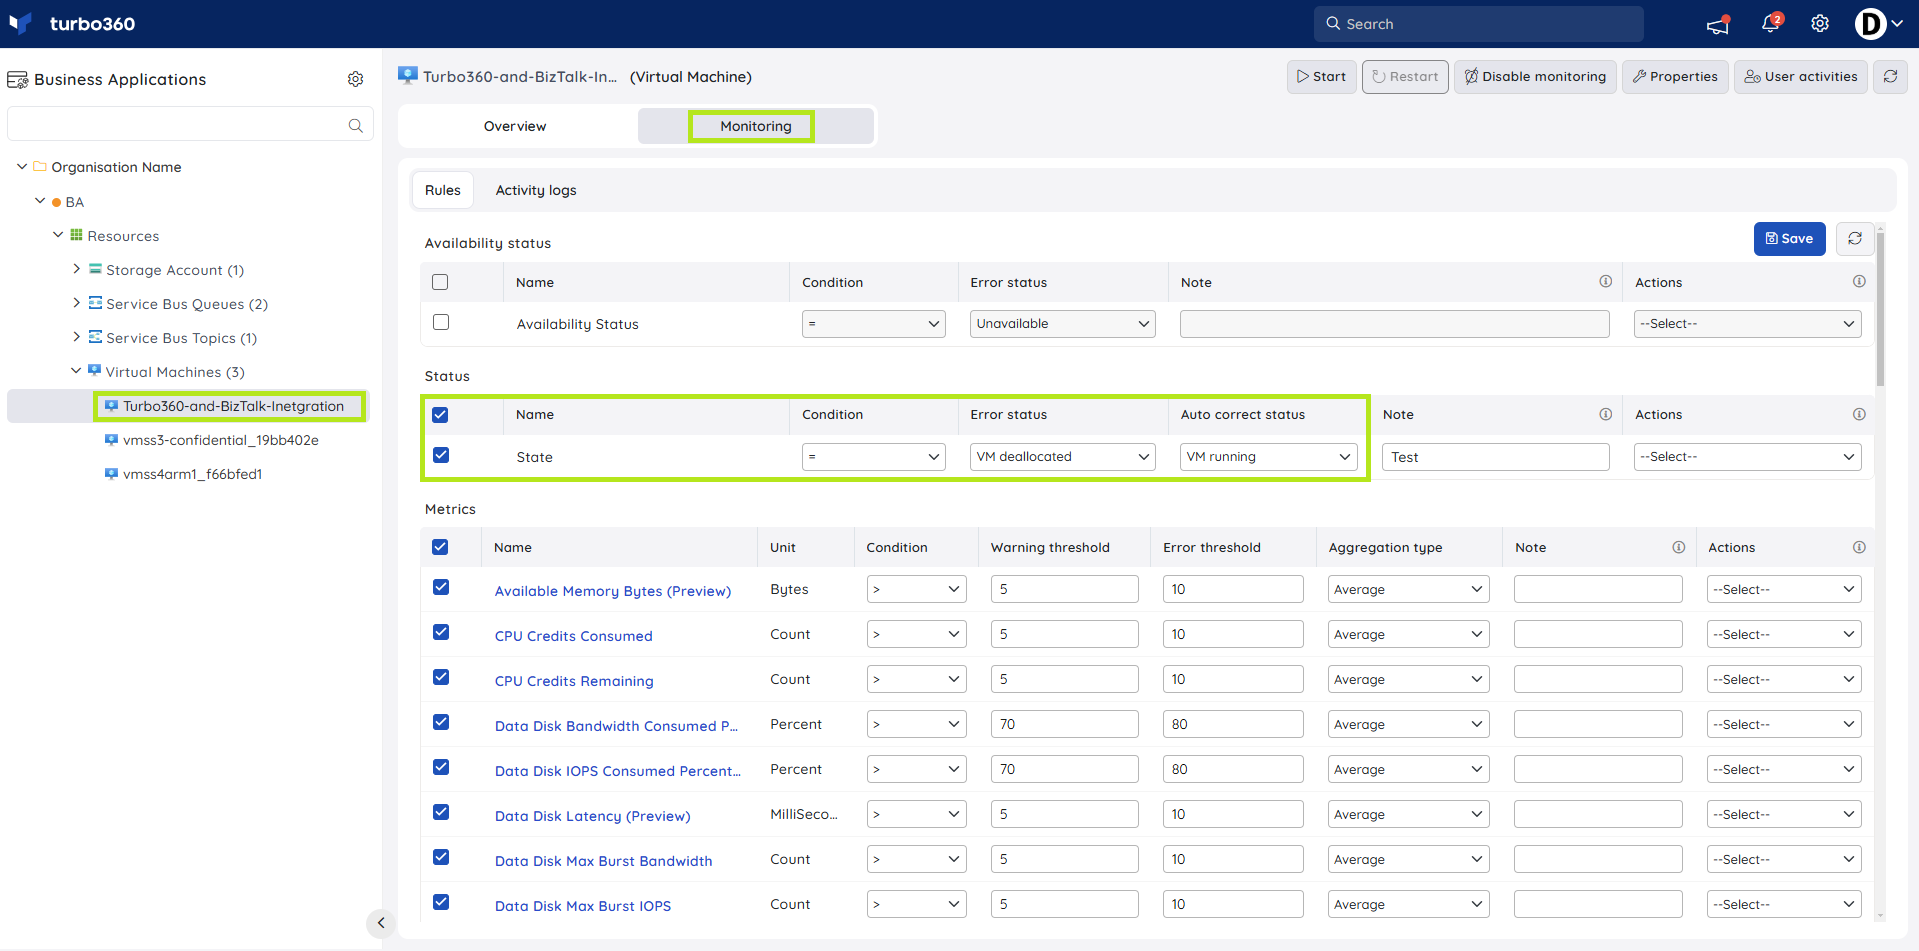
There are even options to auto-correct an error scenario and have Turbo360 turn the VM back on.
Metrics
With Azure VM there are a number of counters available to monitor.
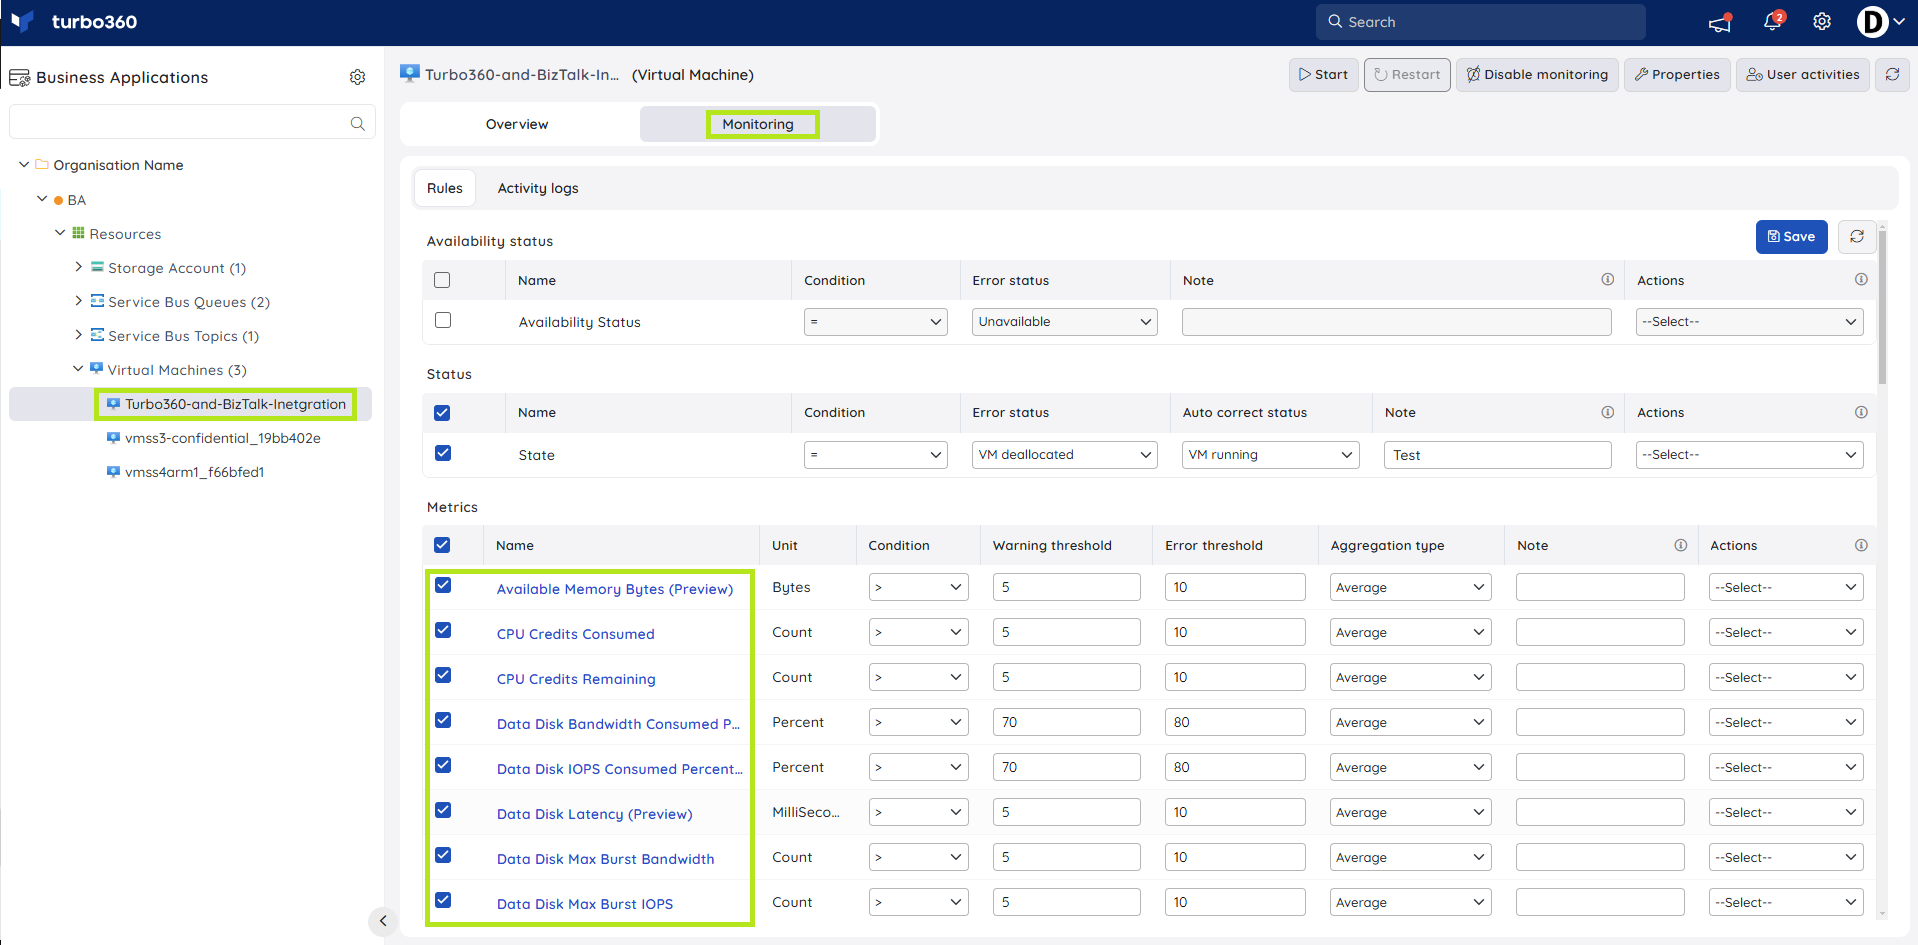
| Metric | Warning | Error |
|---|---|---|
| Percentage CPU | > 90 | > 95 |
| Available Memory Bytes (Preview) | Varies | Varies |
| Data Disk Bandwidth Consumed Percentage | > 90 | > 95 |
| Data Disk IOPS Consumed Percentage | > 90 | > 95 |
| OS Disk Bandwidth Consumed Percentage | > 90 | > 95 |
| OS Disk IOPS Consumed Percentage | > 90 | > 95 |
Note some of the disk metrics require premium storage.
Details of each counter are on the below page.
https://learn.microsoft.com/en-us/azure/virtual-machines/monitor-vm-reference#metrics
Log Queries
If you want to monitor internal guest performance characteristics from your VM then you are likely to be using the Azure Monitor Agent which would stream the log data to Azure Monitor. From there you can use kusto queries to monitor the status of metrics on the guest VM.
More Info
https://learn.microsoft.com/en-us/azure/virtual-machines/monitor-vm-reference


