- 14 Apr 2025
- 3 Minutes to read
- Print
- DarkLight
- PDF
Web App
- Updated on 14 Apr 2025
- 3 Minutes to read
- Print
- DarkLight
- PDF
Introduction
Web App is a cloud computing platform for hosting websites that was developed and is managed by Microsoft.
It is a platform as a service (PaaS) that enables the publication of Web apps that run on multiple frameworks and are written in various programming languages.
Functionality
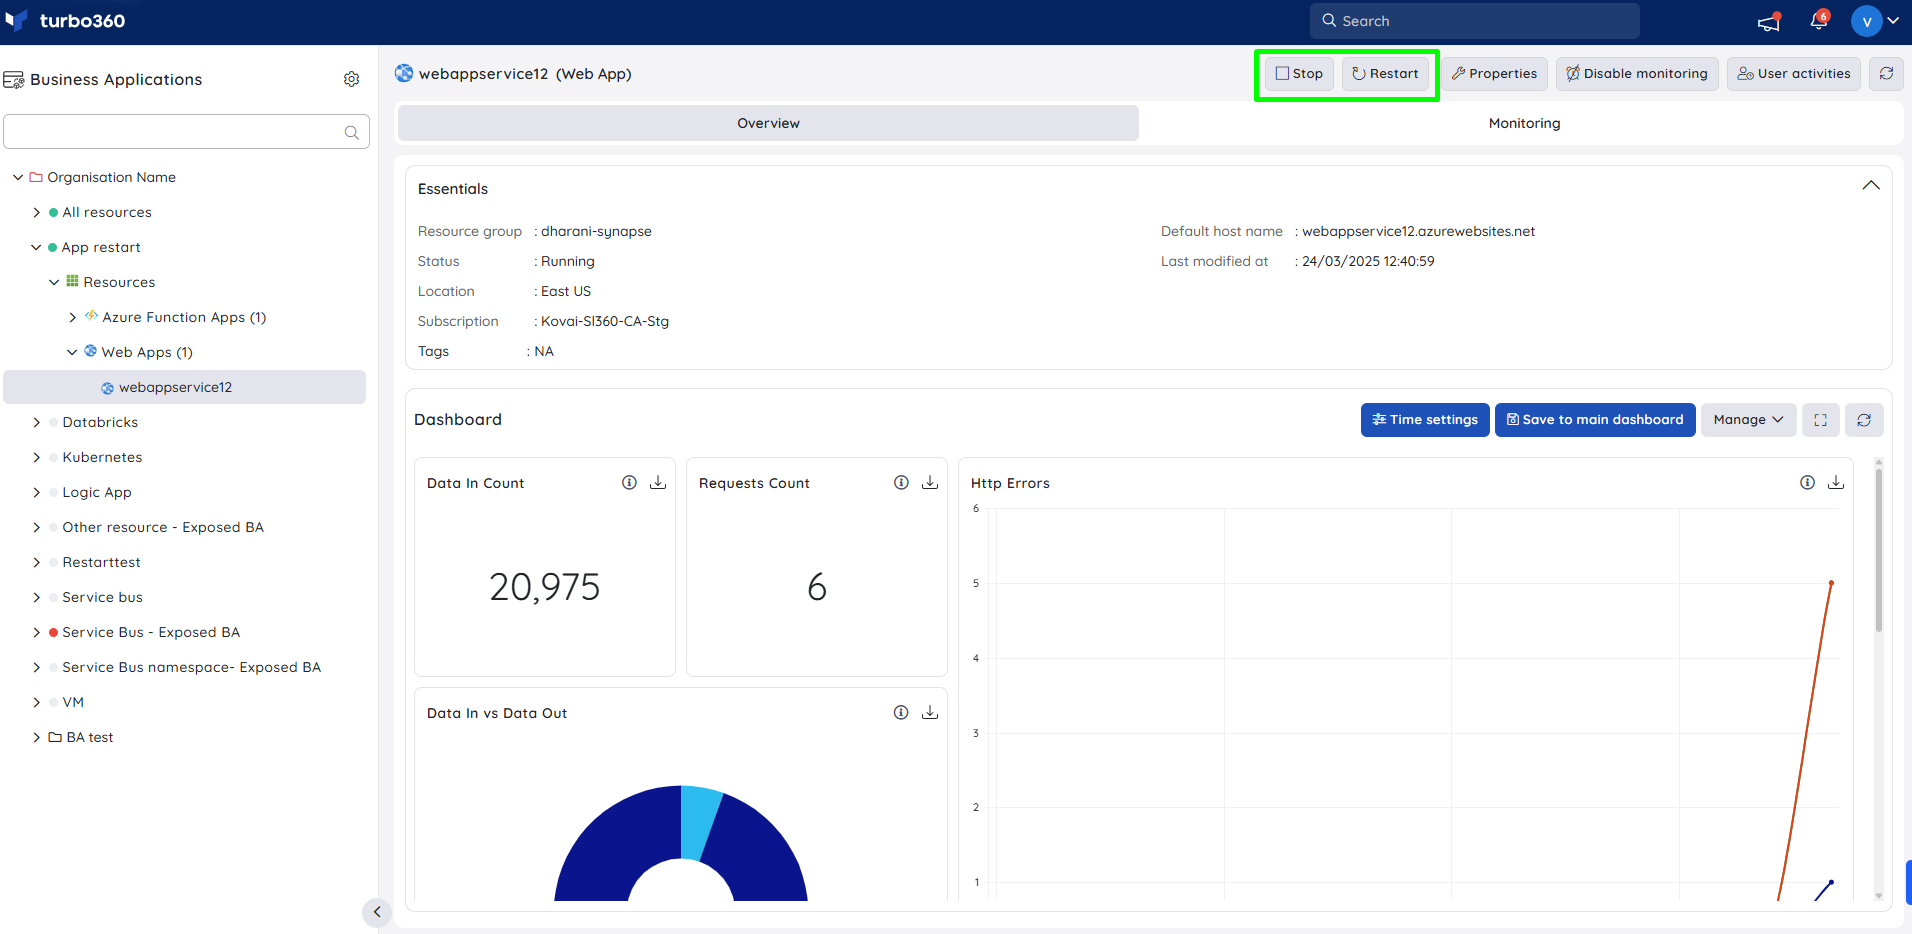
- Users can easily perform start, stop and restart operations for Web App resources using Turbo360.
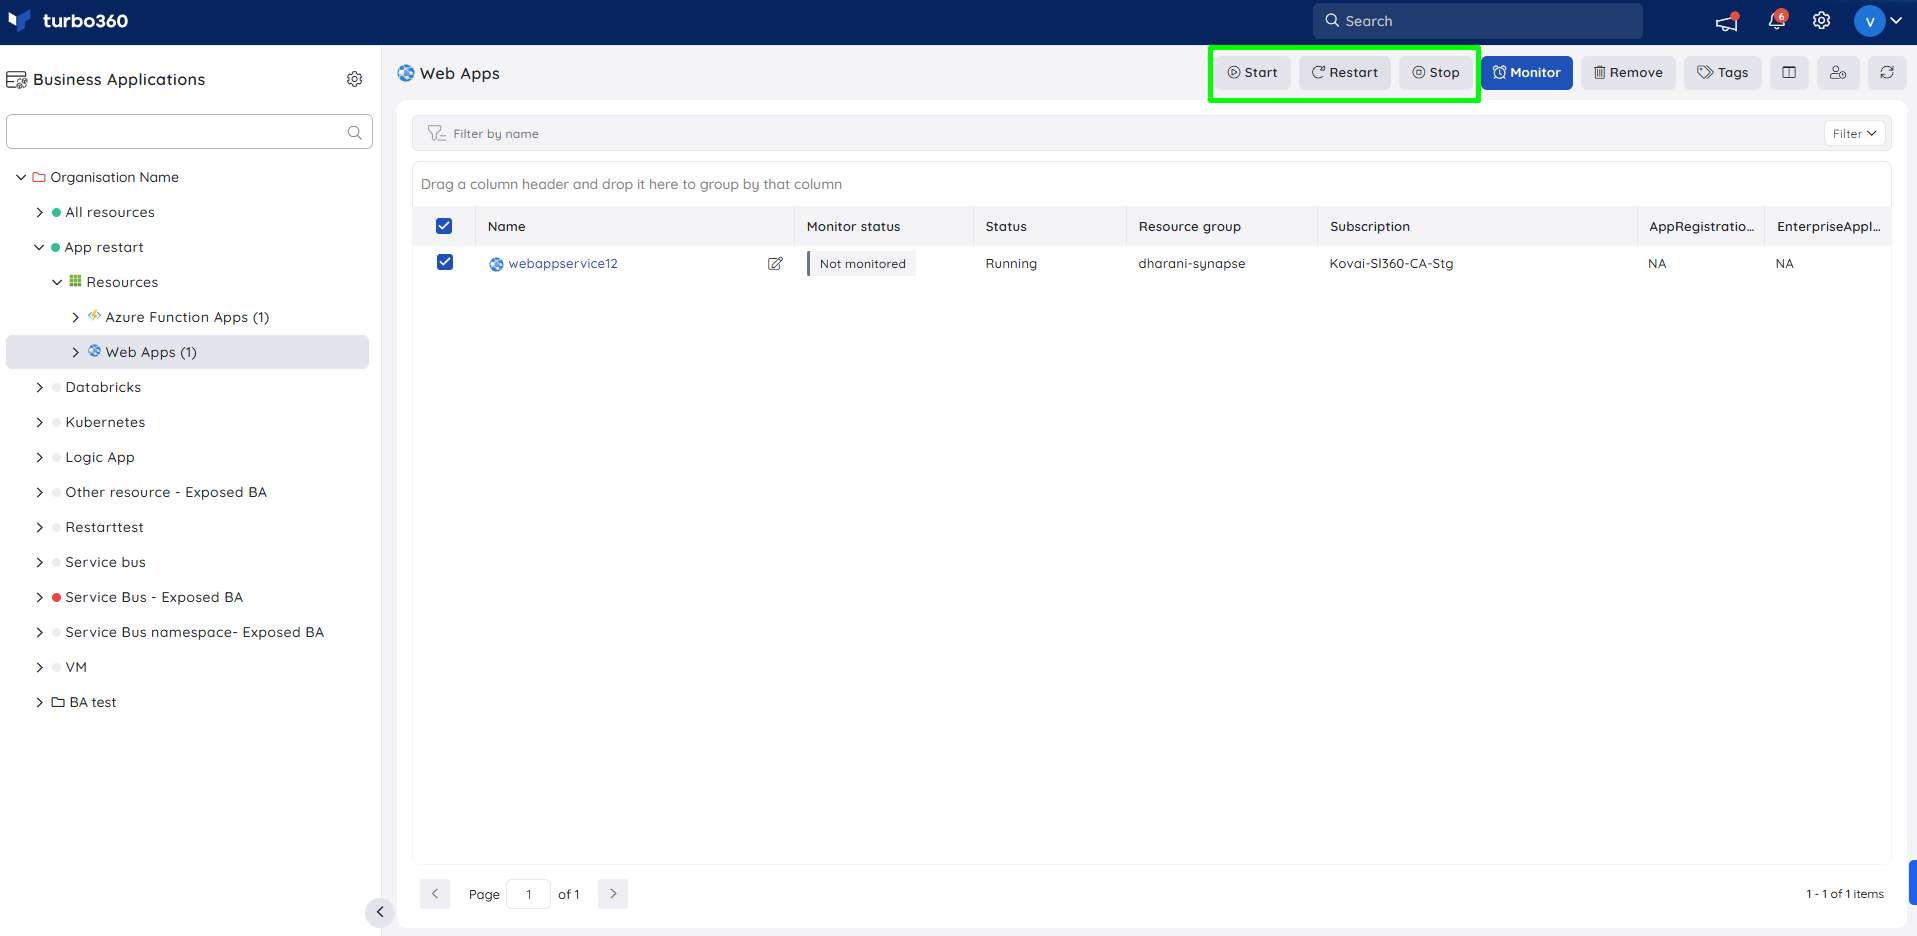
- The status of multiple web apps can be simultaneously by using the respective options available in the Web App resource section.
Resource Dashboard
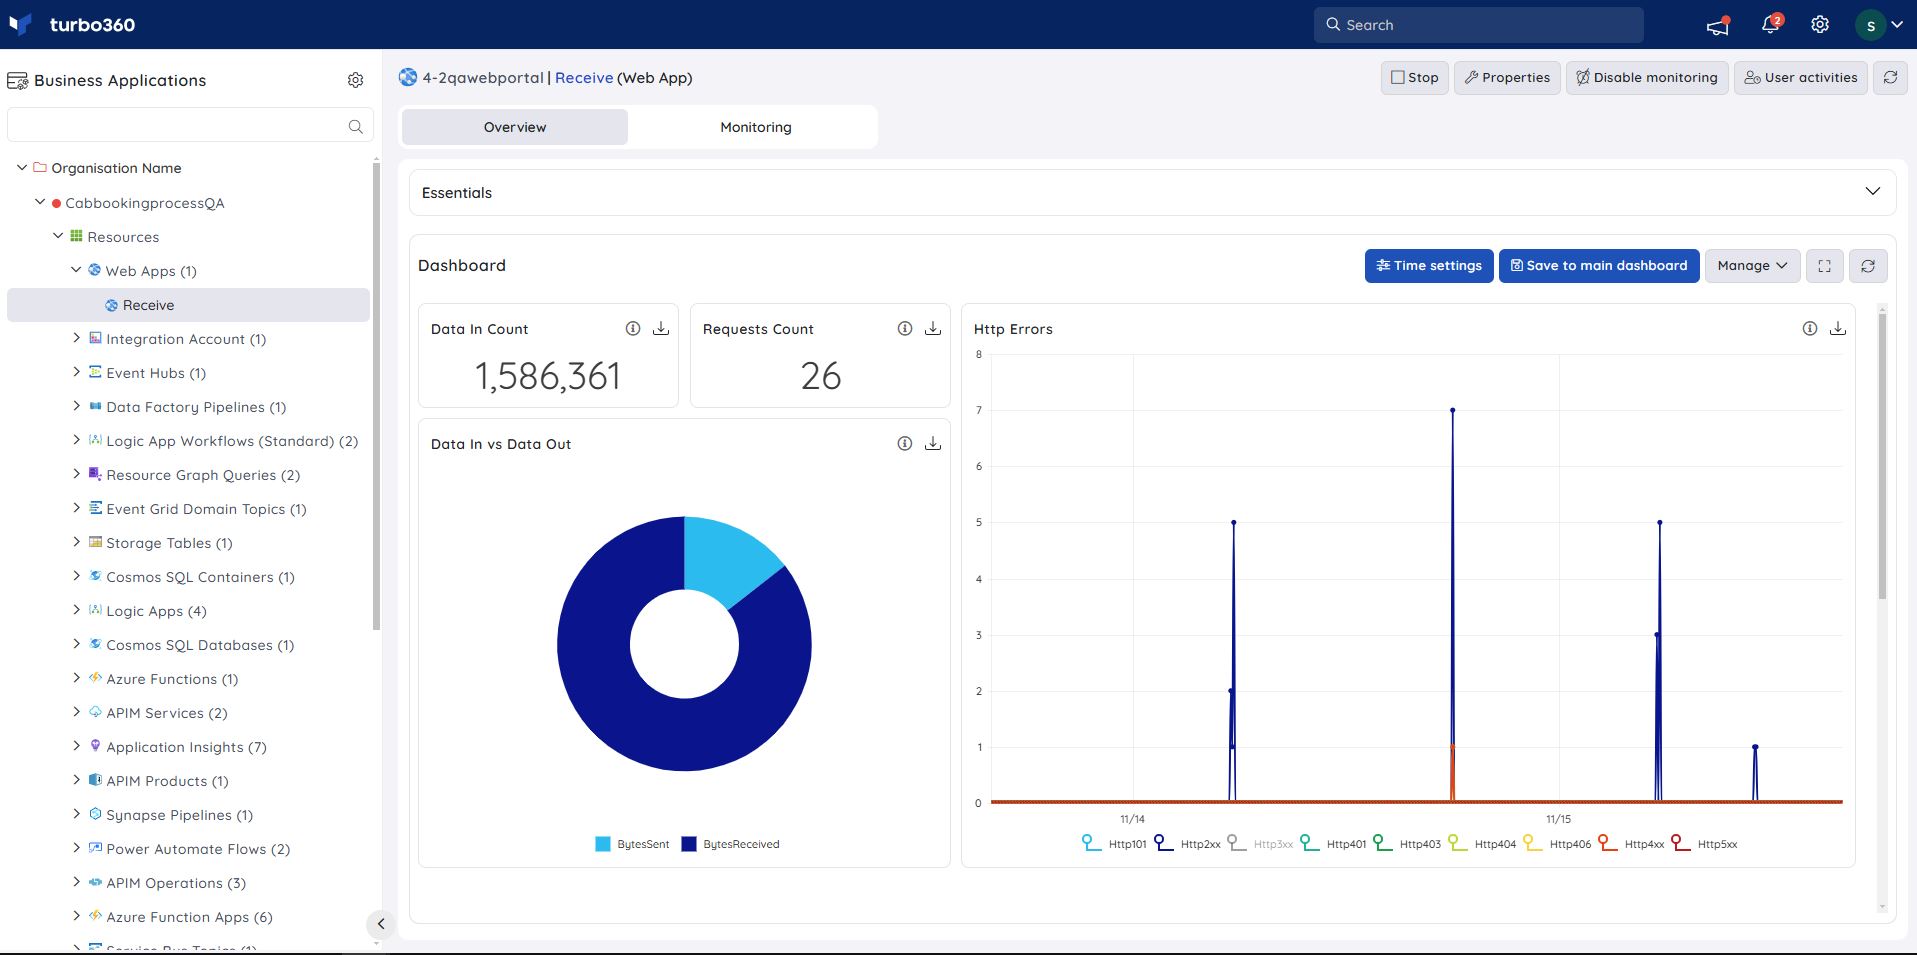
Users now have access to a default Web App Dashboard within the Web App resource, allowing for enhanced data visualisation and tracking of real-time data.
Users are provided with the following pre-defined Dashboard widgets, which can be customised to meet their specific needs.
1. Data In Count
2. Requests Count
3. Http Errors
4. Data In vs Data Out
5. Garbage Collections
6. IO Read vs IO Write
Monitoring
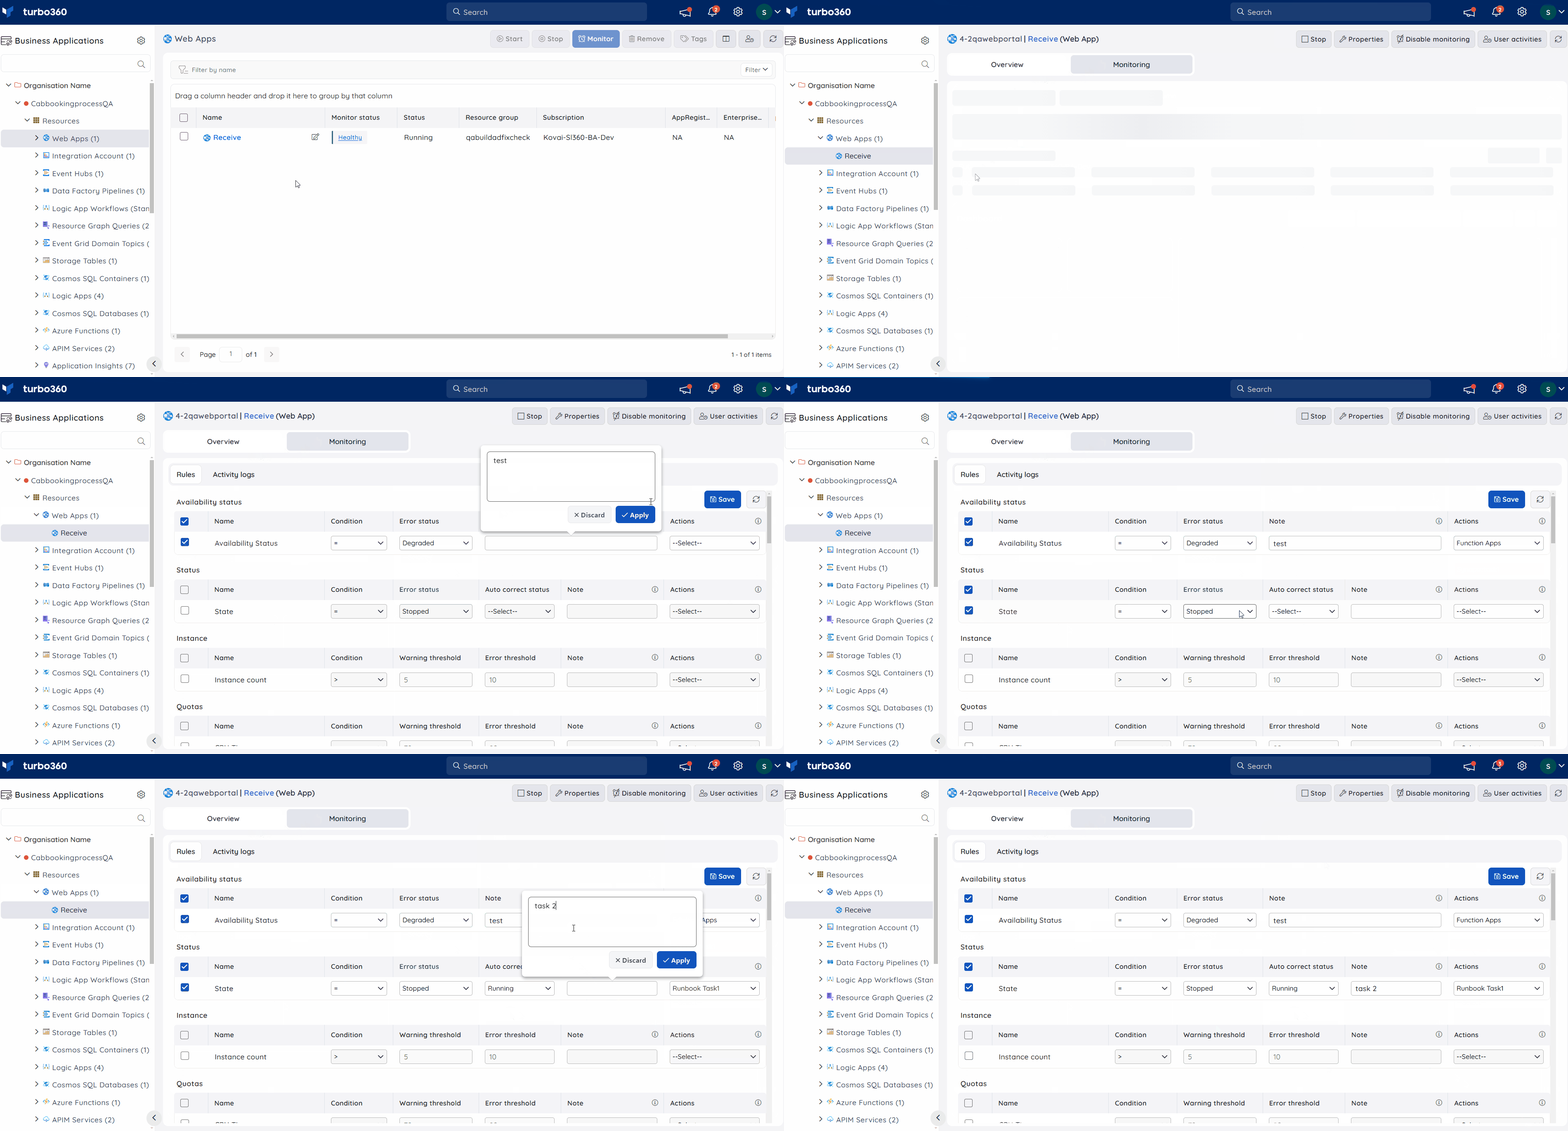
Status, Instance, Quotas and Metrics are the types of rules available for monitoring Web app.
Users can monitor their Web App resources by configuring the rules available for monitoring.
Navigate to the Monitoring section of the resource to configure the monitoring rules for Web App.
Users can specify monitoring threshold values based on their needs.
When the monitoring rule type is a metric, selecting metric against metric rules is also an option.
Monitoring Recommendations
State Monitoring
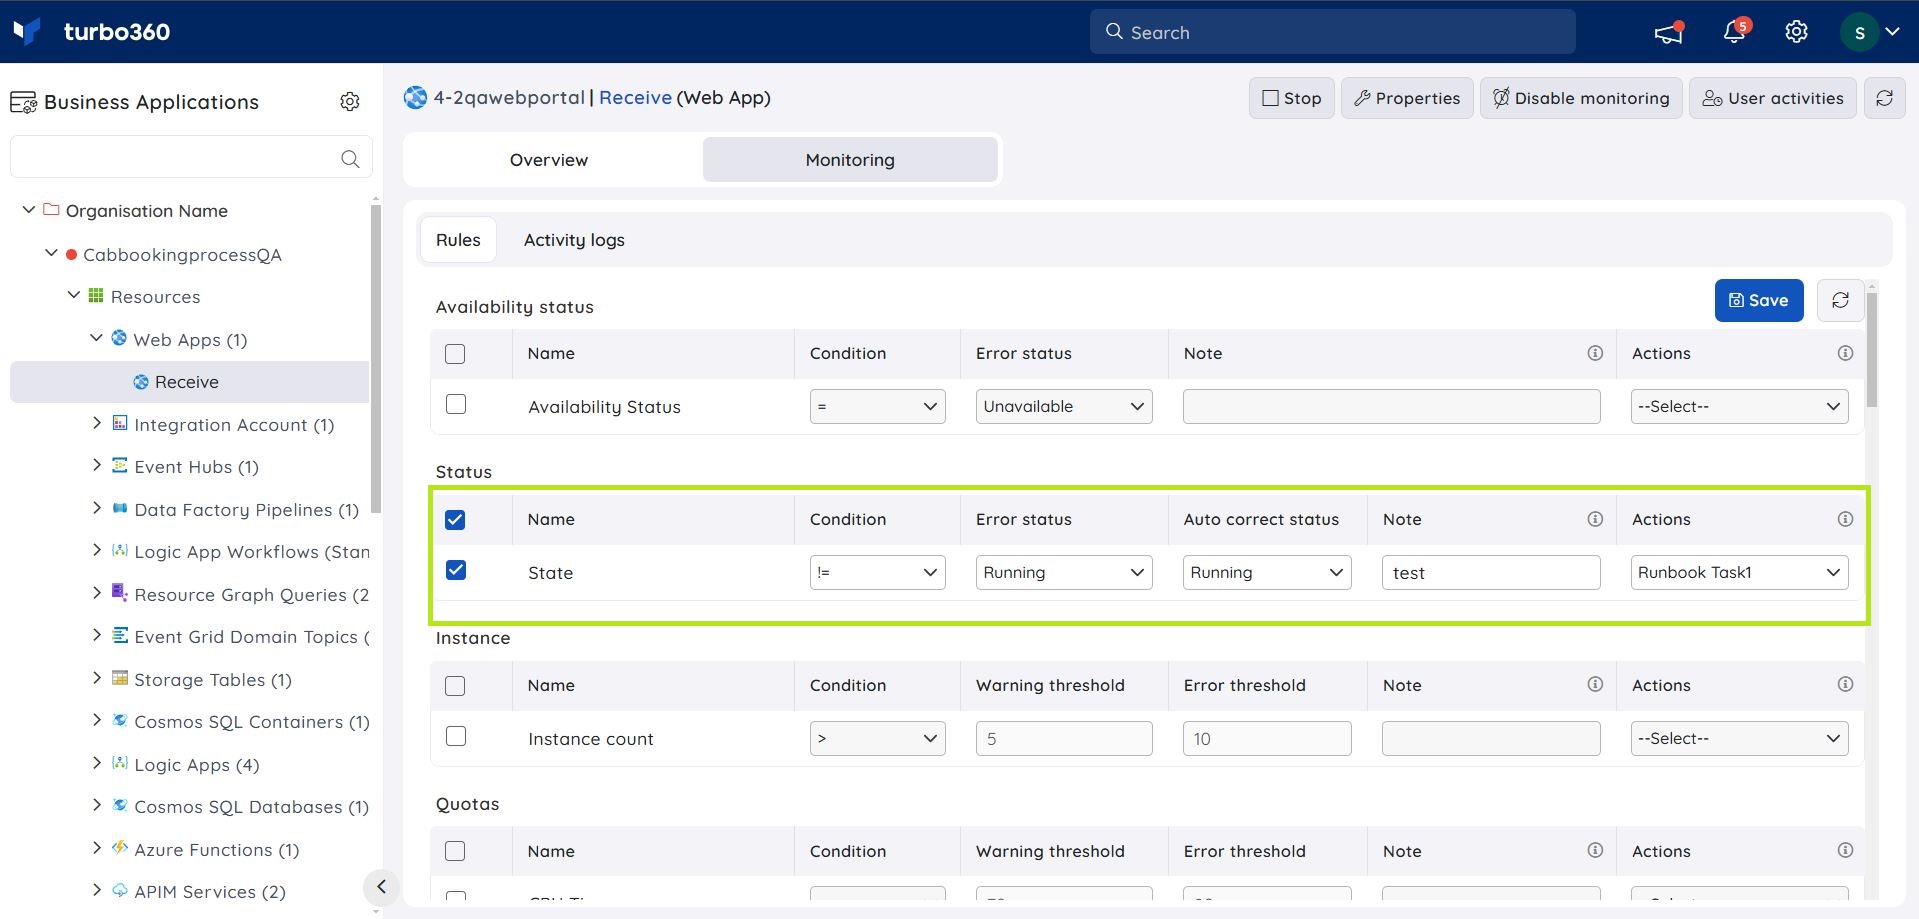
The state monitoring will raise an alert if your application is not in the expected state. In the example below you can see where I have configured the monitoring to raise an alert if the Web App is not in the running state.
There is also an auto-correct feature where you can tell Turbo360 to turn the web back on if it is not running.
Metrics Monitoring
The metrics monitoring for your application will often vary depending on what your application does and its typical usage patterns. Some of the common scenarios are below:
| Metric | Warning | Error |
|---|---|---|
| Http Server Errors | > 20 | > 50 |
| Response Time | 2 | 5 |
| Average Memory working set | Varies | Varies |
- You might decide to tune the HTTP 400 range of response codes depending upon the individual usage of your application
- Response Time is the time taken in secs for your application to respond. This is common across all pages or API's in this application. This is a good way to check on the overall response SLA for your application and you would choose a value which meets your SLA
- HTTP Server Errors is the number of 500 range responses returned by your application
- Average Memory working set is a common counter to monitor based on the expected memory use of your application. The thresholds will vary here depending on what your application does and the size of the plan you are using
- You may also choose to monitor metrics on a case by case basis
Consider your App Service Plan
When considering the monitoring for your web app, you should also consider the App Service Plan. If you have multiple apps on the same plan then things would be shared across all of the apps.
Default Settings
In the Turbo360 monitoring profiles features you can configure standard default settings for this resource type which can be used to apply to resources you add to a Business Application to reduce the maintenance of monitoring configuration.
Application Insights
If you want to do some lower level monitoring below the metrics API then you could be using Application Insights with your web app and in this case you can add Application Insights to your Business Application where kusto queries can be used to provide lower level monitoring if you want to monitor specific routes or dependencies.
There is more info about Application Insights monitoring here.
API EndPoint Monitor
In Turbo360 there is an API Endpoint monitor feature which can ping your API endpoint to add monitoring of the response for specific endpoints if you want to test them from the outside.
There is more info about API Endpoint Monitor here.
More Info
If you want to learn more about some of the lower level considerations for monitoring Web Apps then Microsoft documents the counters in this page:
https://learn.microsoft.com/en-us/azure/app-service/web-sites-monitor


