- 19 Nov 2024
- 3 Minutes to read
- Print
- DarkLight
- PDF
Application Insight
- Updated on 19 Nov 2024
- 3 Minutes to read
- Print
- DarkLight
- PDF
Introduction
Application Insights is a performance management service for web applications that allows users to monitor the performance of their website in Azure.
It will automatically detect performance anomalies and include powerful analytics tools to assist users in diagnosing problems and gaining a better understanding of how users of a customer interact with their app.
Application Insights works by sending data to Azure for analysis by including a small package in the customer's application and setting the Application Insights resource in the Azure.
Queries
The Queries section in the Application Insight resource offers a number of query-related operations.
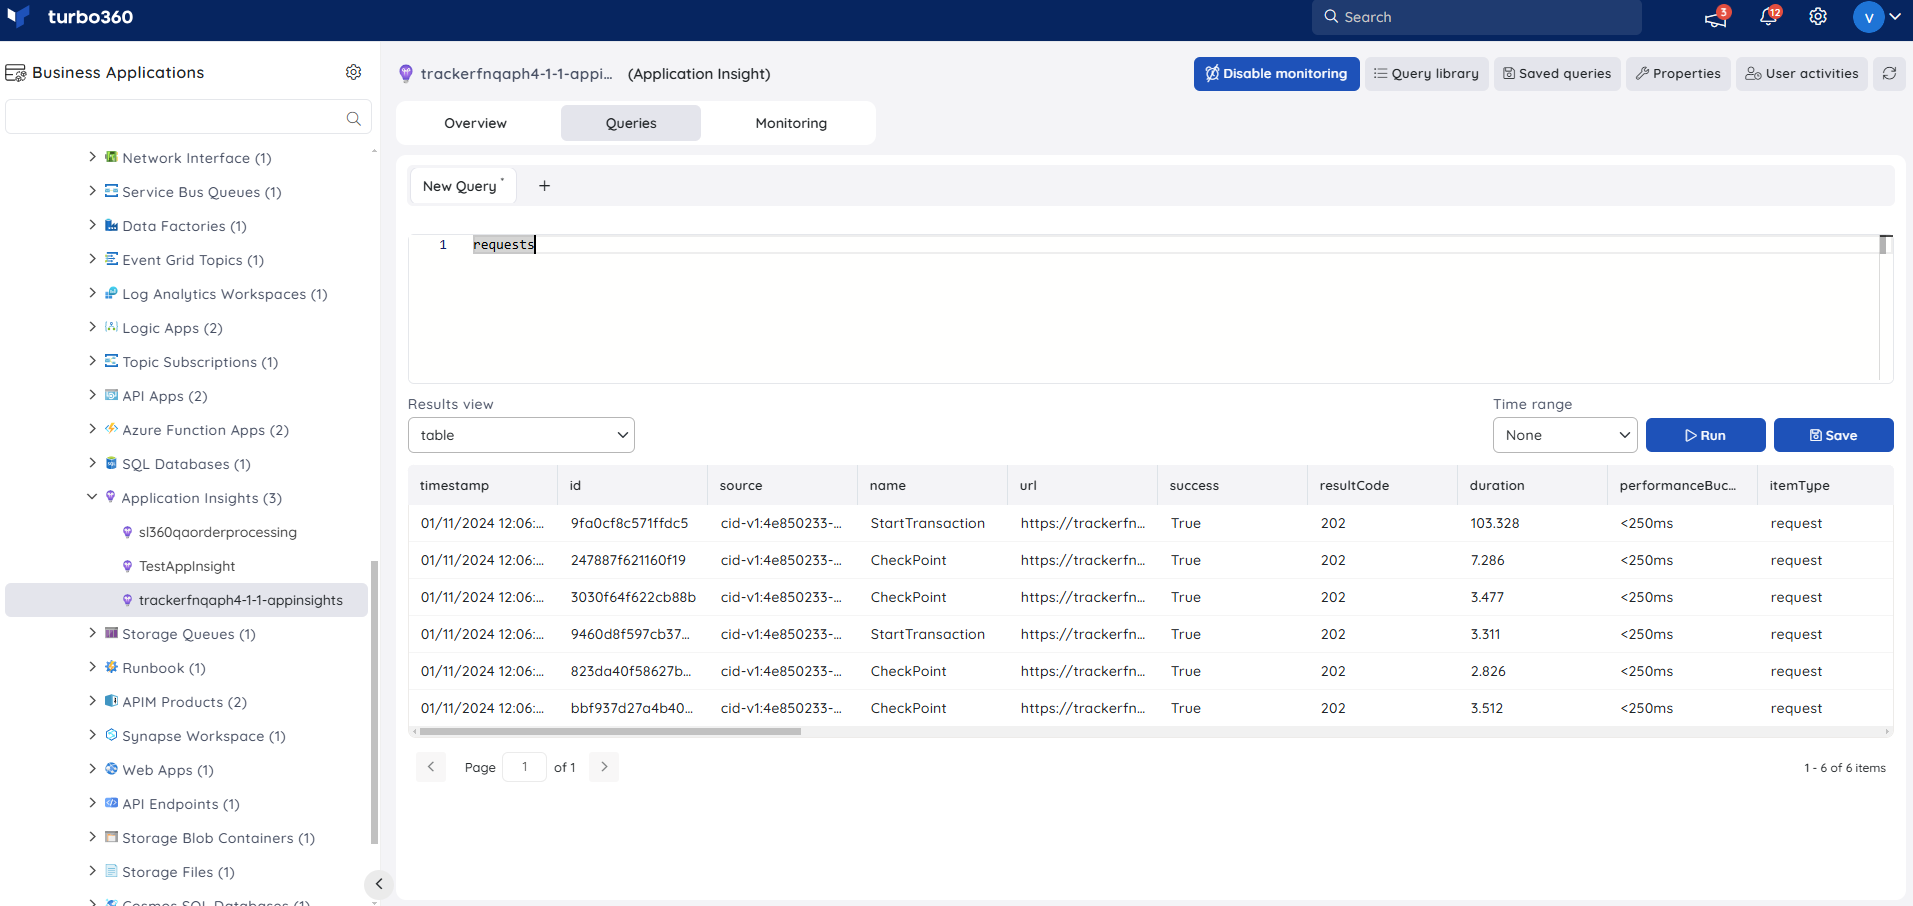
Users can write a query in the query field to generate data that meets their needs.
The query data can be viewed in any of the available formats:
- table
- line
- bar
- column
- donut
- area
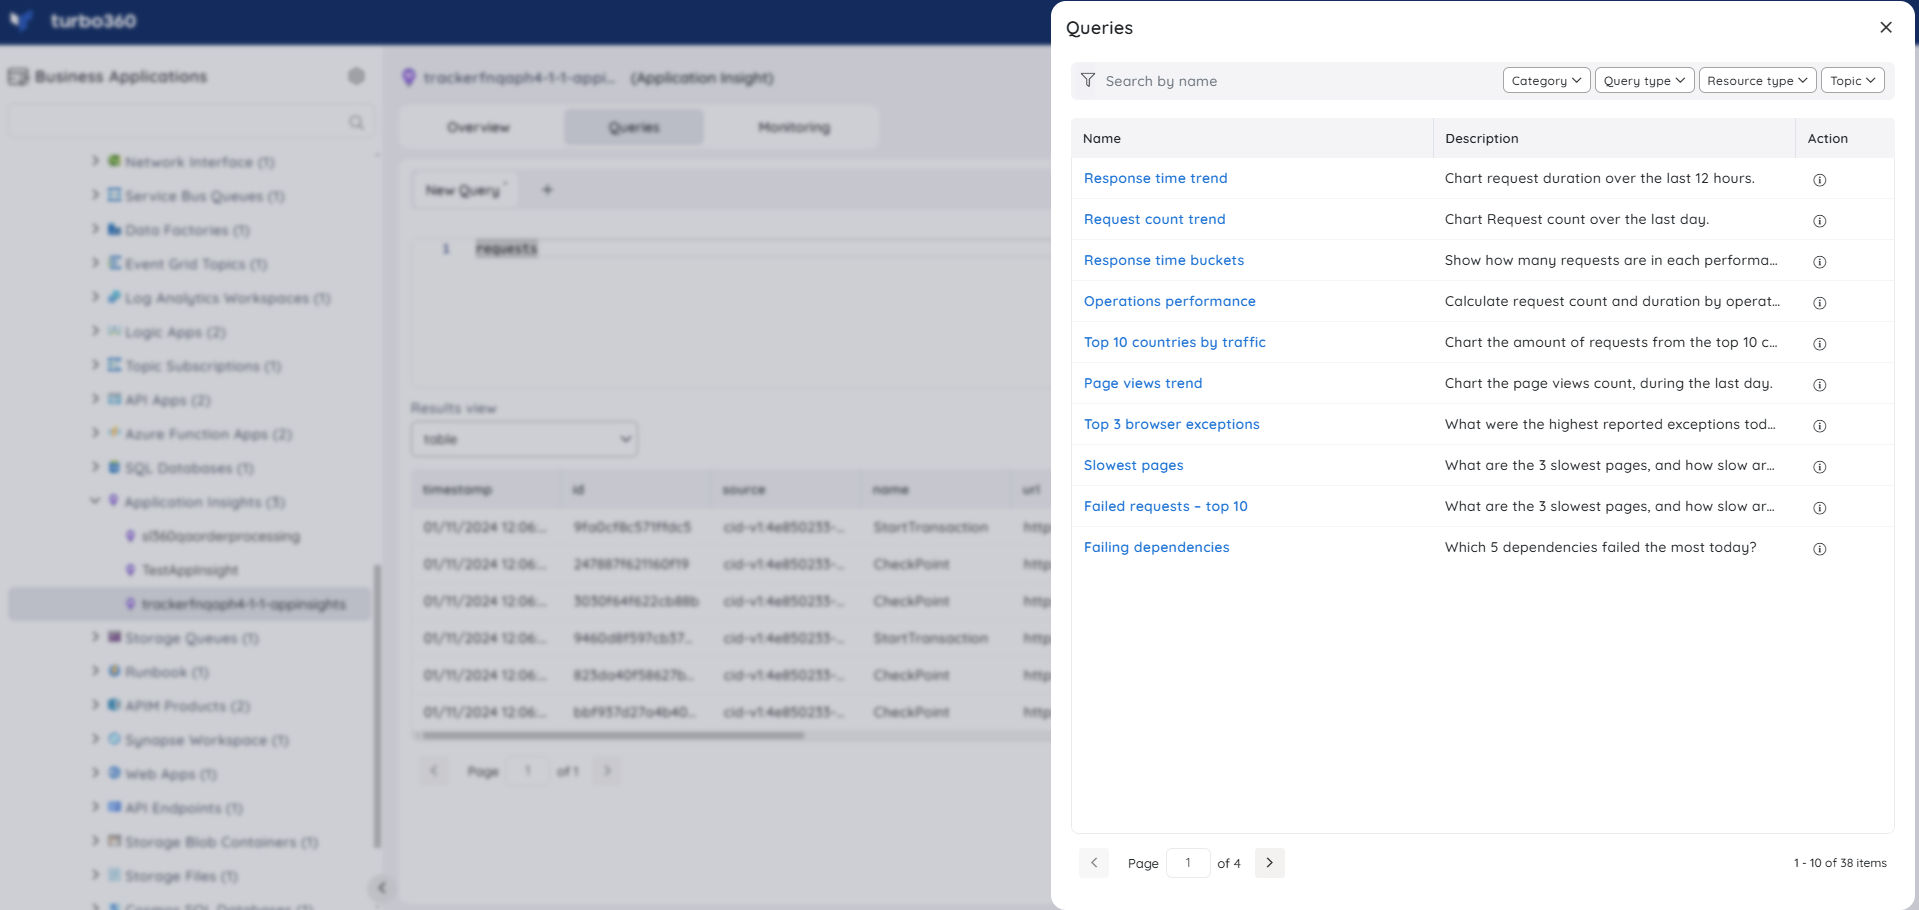
The Query library option in the Queries section allows users to access the preset queries from the Azure portal directly in Turbo360. Users can easily add any of those queries to their Saved queries using the Save icon found on each query.
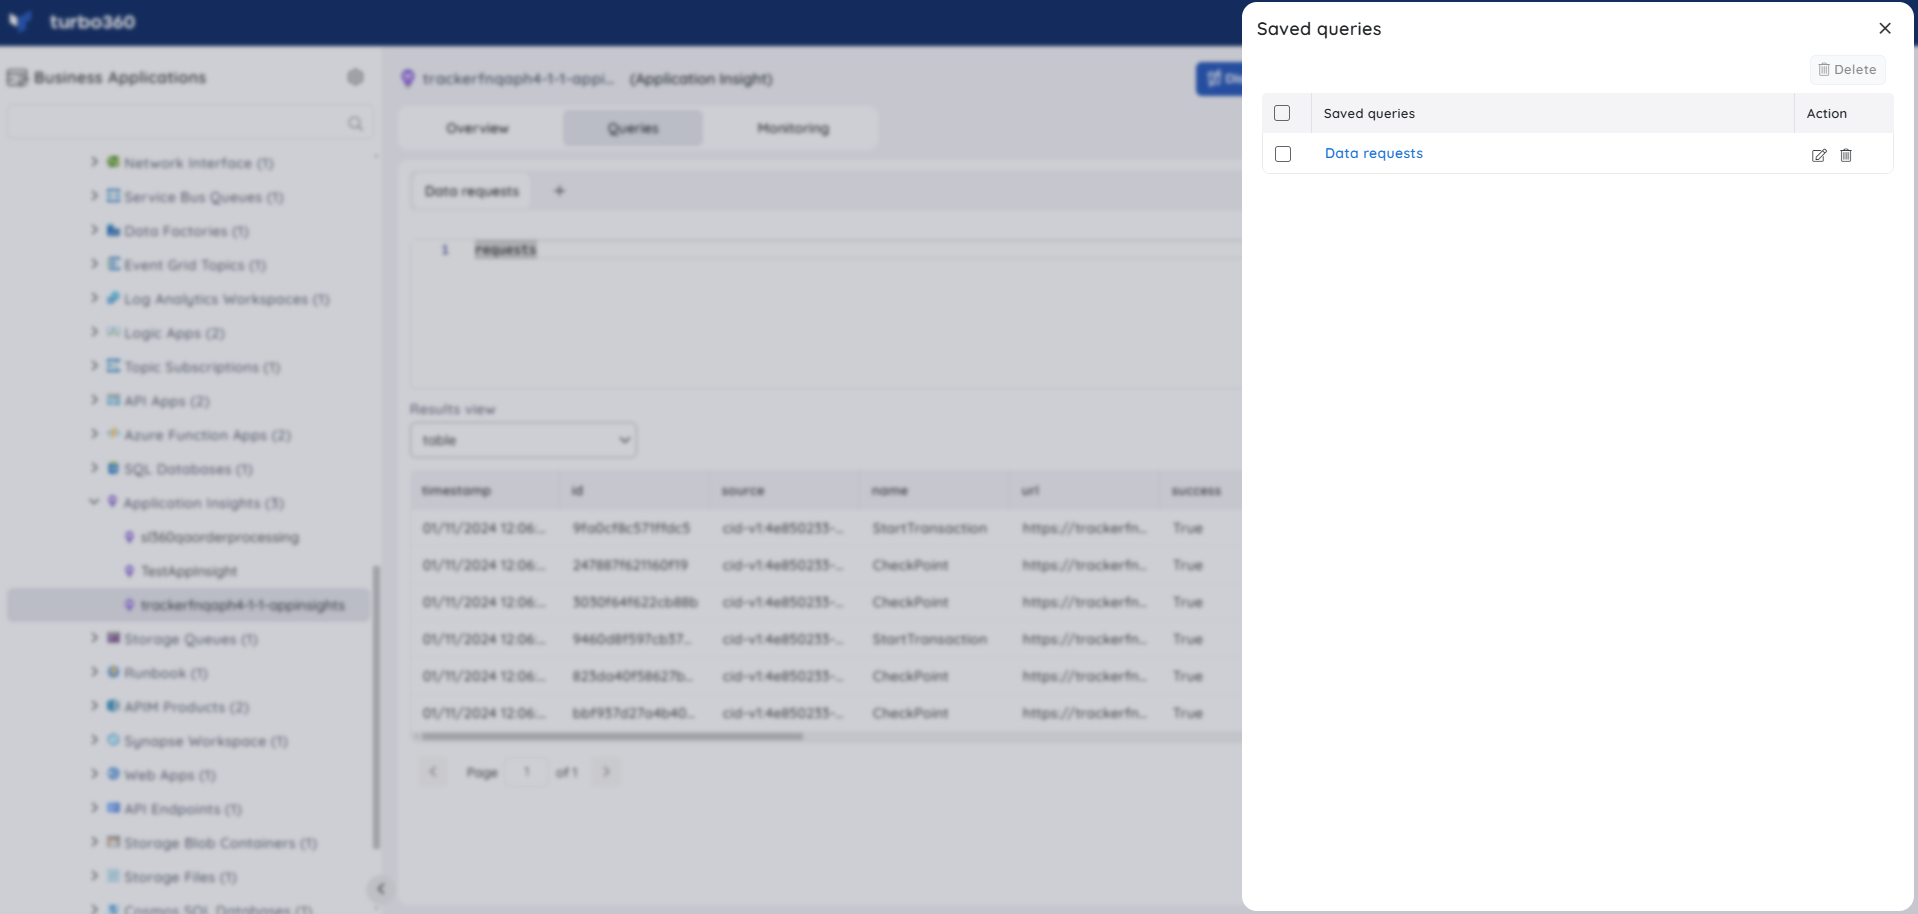
The Saved queries option in the Queries section allows users to access all the saved queries and quickly generate Query data. Users can also edit their saved queries and update their favorite query.
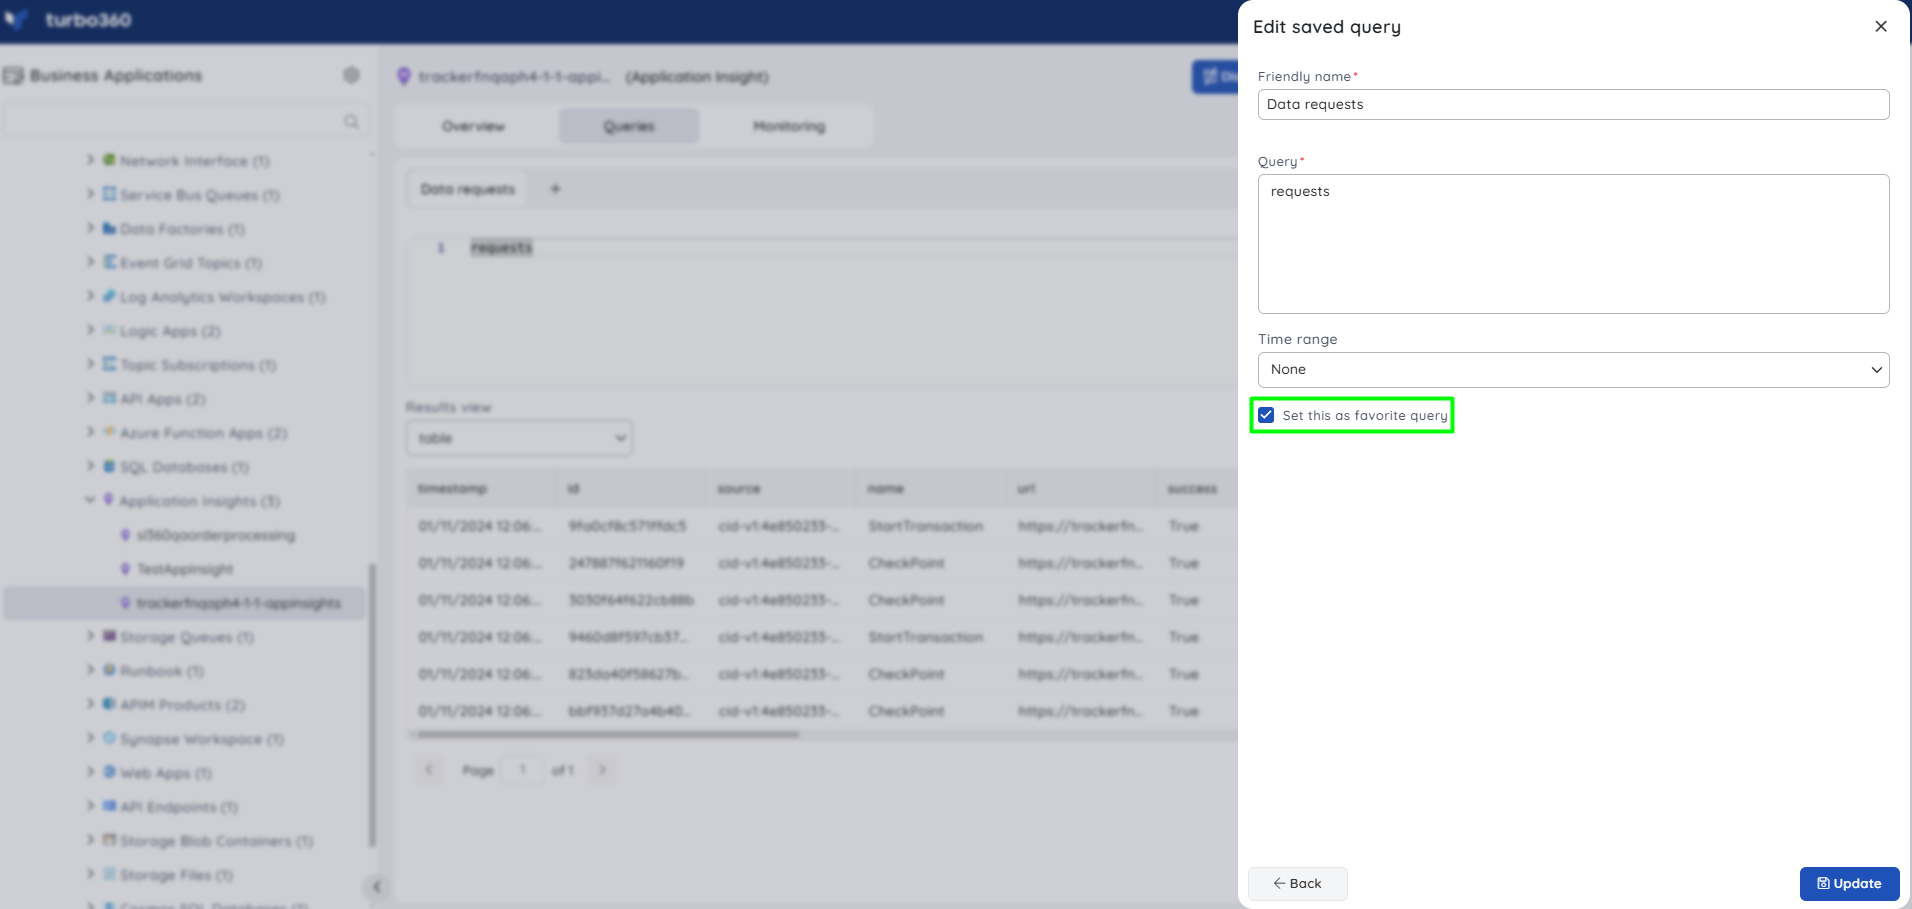
A Favorite query will be available by default in the Queries section. A query can be marked as a favorite by editing any of the saved queries or by saving a query.
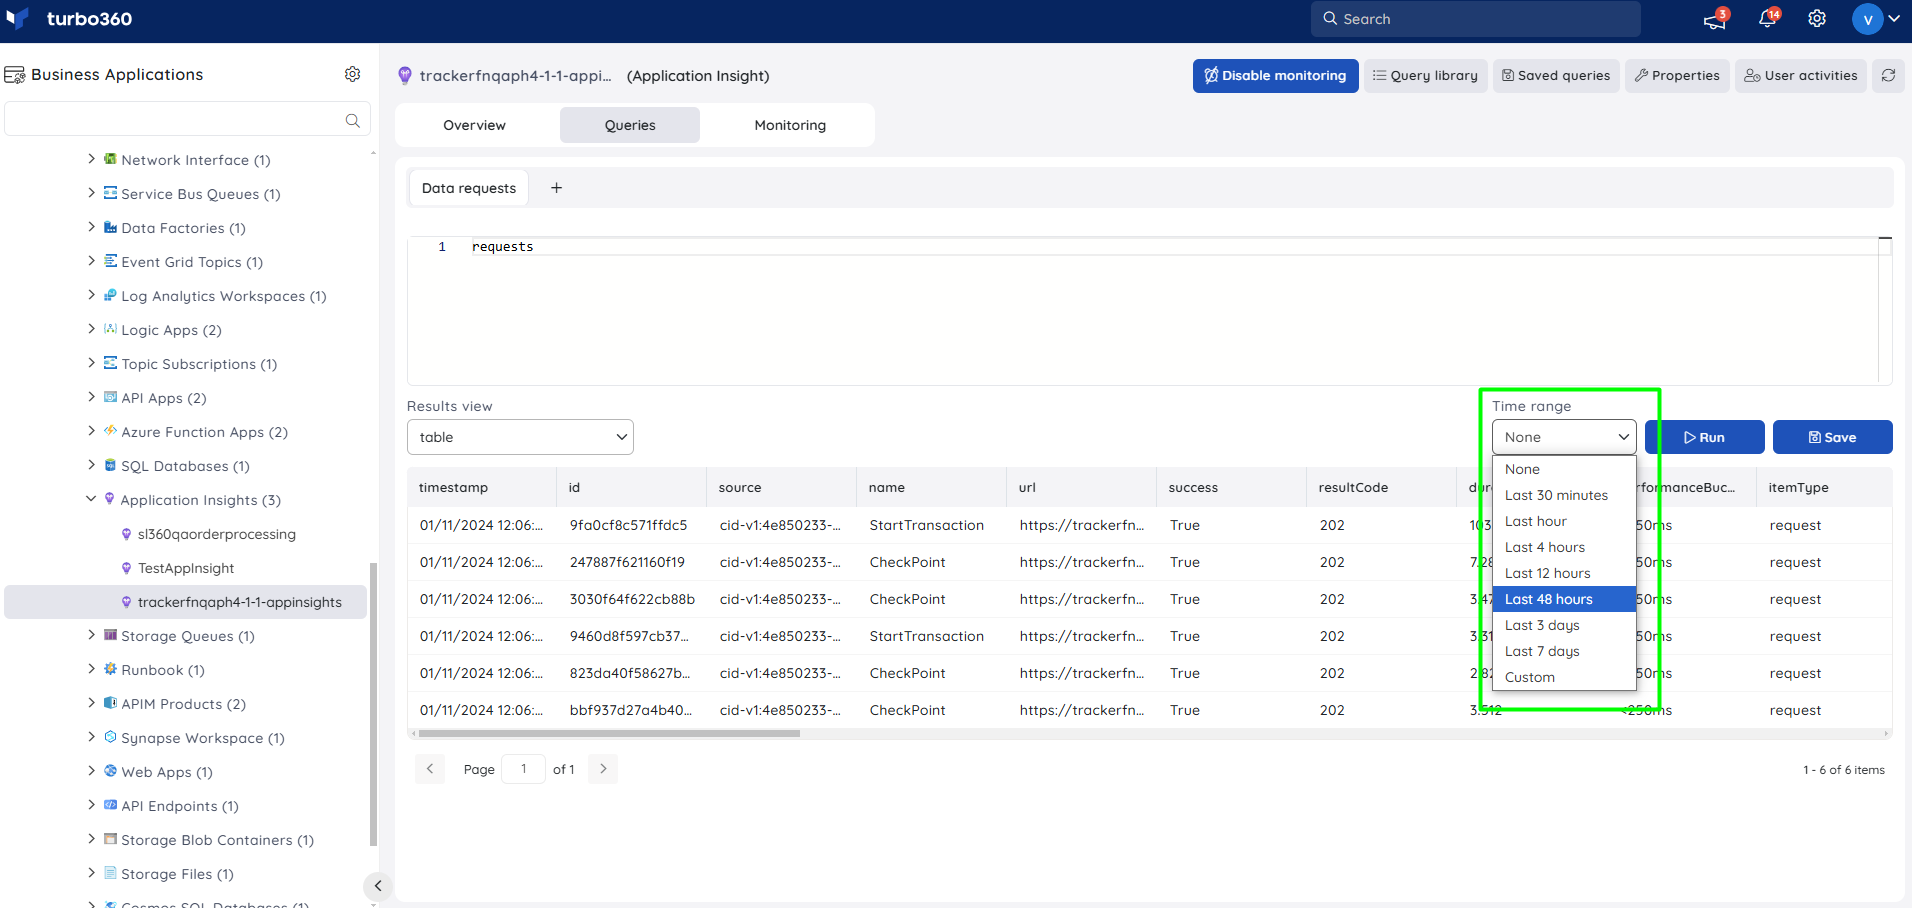
Time range
A time range filter can be applied to the queries to retrieve the subset of required data. The time can be provided in the query or by choosing from the time range filter.
Resource Dashboard
A default resource dashboard is available for Application Insight resources in the Overview section, allowing for enhanced data visualization and tracking of real-time data.
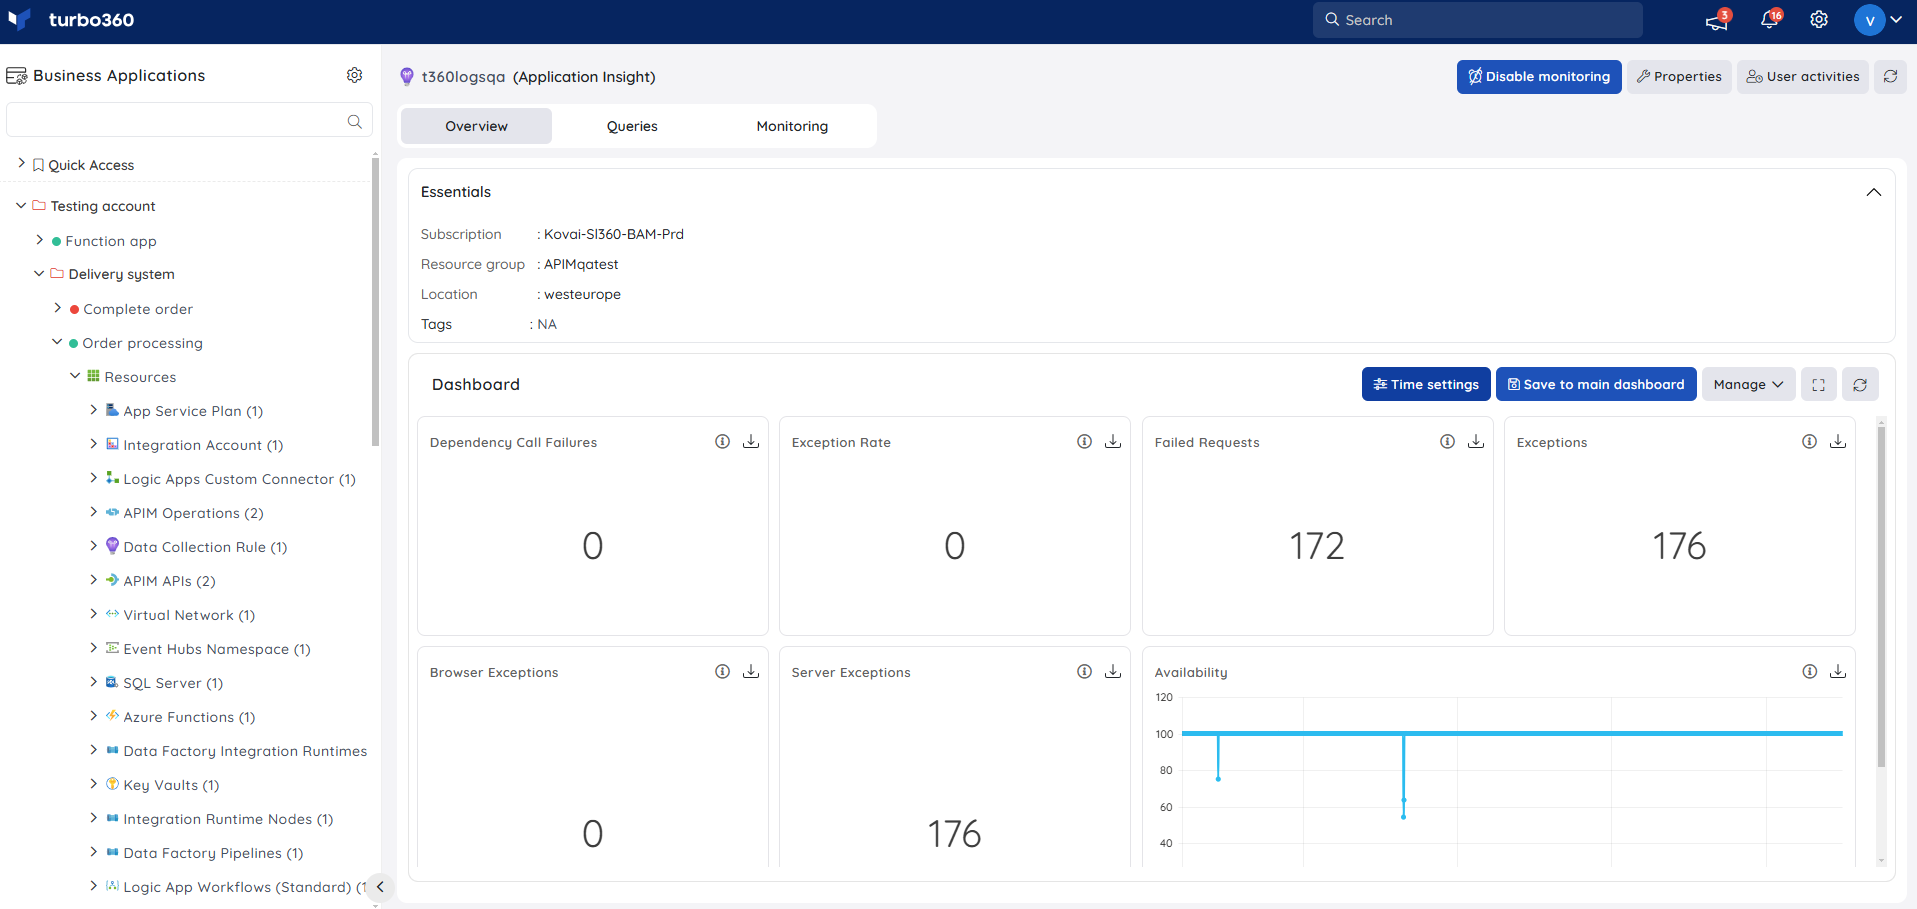
Users are provided the following pre-defined Dashboard widgets, which can be customized to meet their needs.
1. Dependency Call Failures
2. Exception Rate
3. Failed Requests
4. Exceptions
5. Browser Exceptions
6. Server Exceptions
7. Availability
8. Performance
Query widgets
Queries can also be used to generate real-time data for a more personalized user experience in Dashboard widgets.
Query widgets can be added to the Business Application and the Resource Dashboard when the Data source value for the Application Insight resource is set to Query in the widget configuration.
In the query field, type a valid query and hit the Run button. Users can customize the values on the x and y axis by selecting the appropriate data label from the Y-axis dropdown and the X-axis checkboxes.
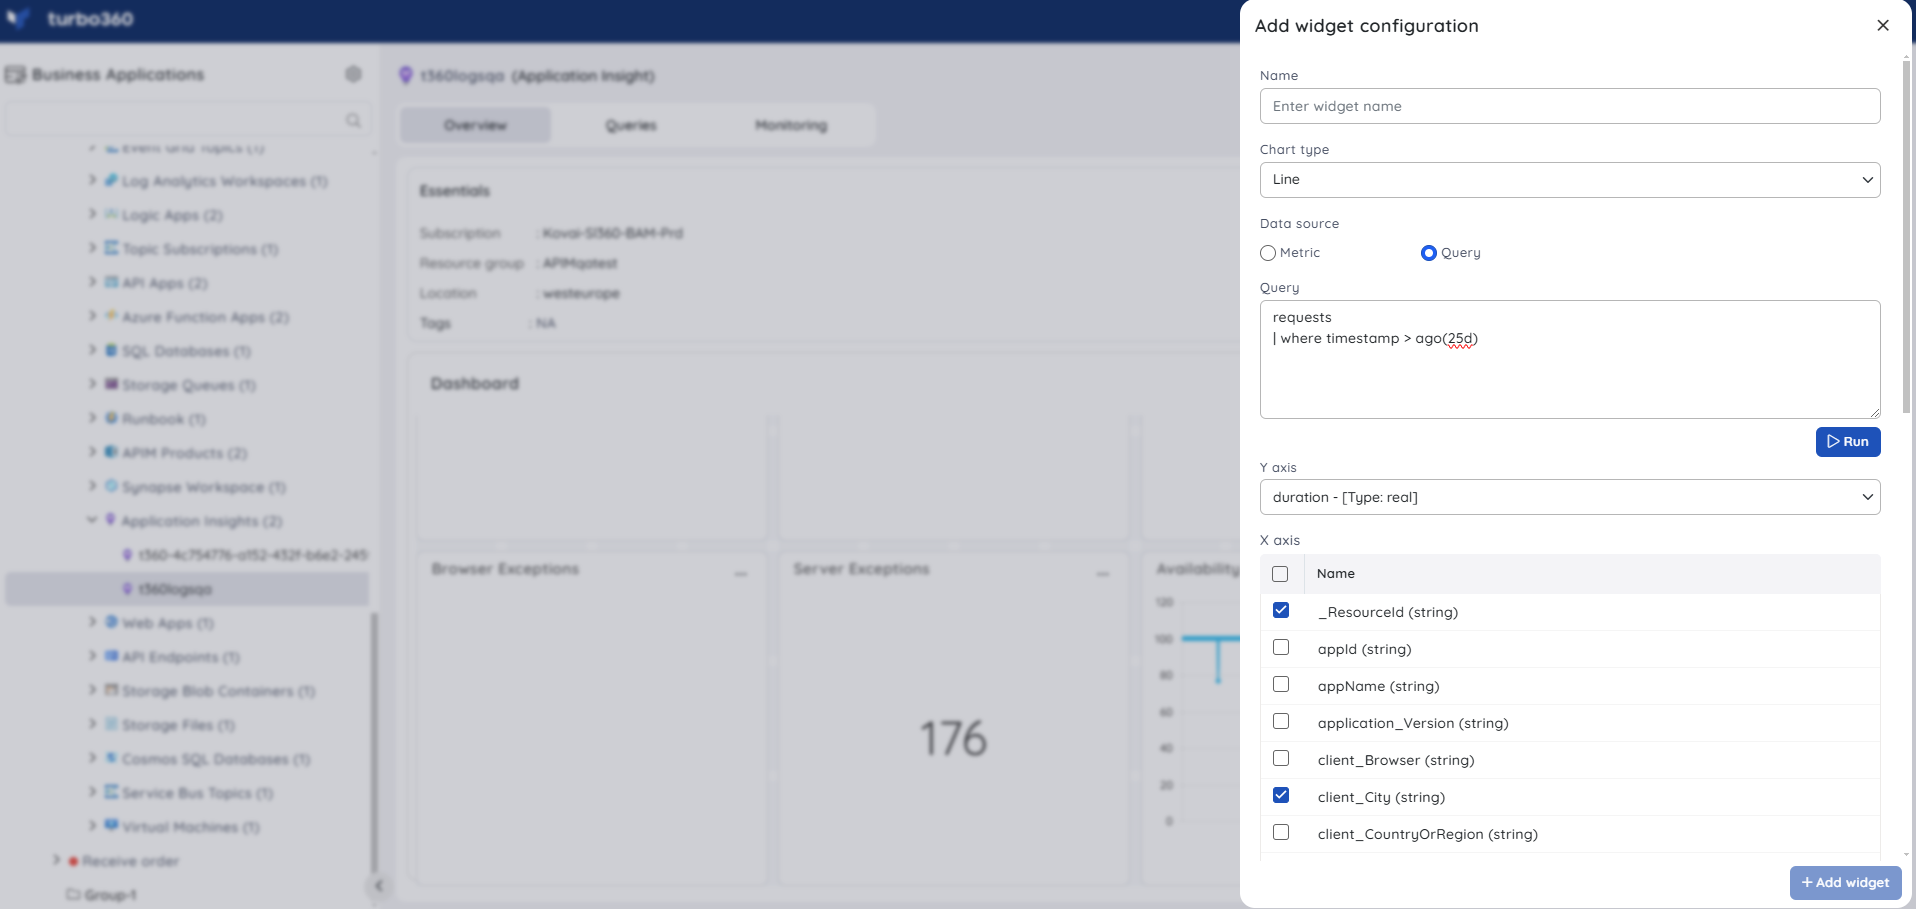
Query widgets do not display time settings information in their tooltip because the data is generated only for the desired query, regardless of time settings configuration.
Count charts do not support Query data sources.
Monitoring
- Navigate to Application Insight -> Monitoring to configure monitoring rules.
- You can configure the monitoring metrics under the Metrics and Properties tab and query rules under the Queries tab.
Metric monitoring
- Switch to the Metrics and properties tab to configure rules for metric monitoring
- Select the necessary monitoring metrics and configure the threshold values
- Click Save
The threshold values can also be provided with any metric name, defining the monitoring rule to be violated when the metric value configured at threshold field is met.
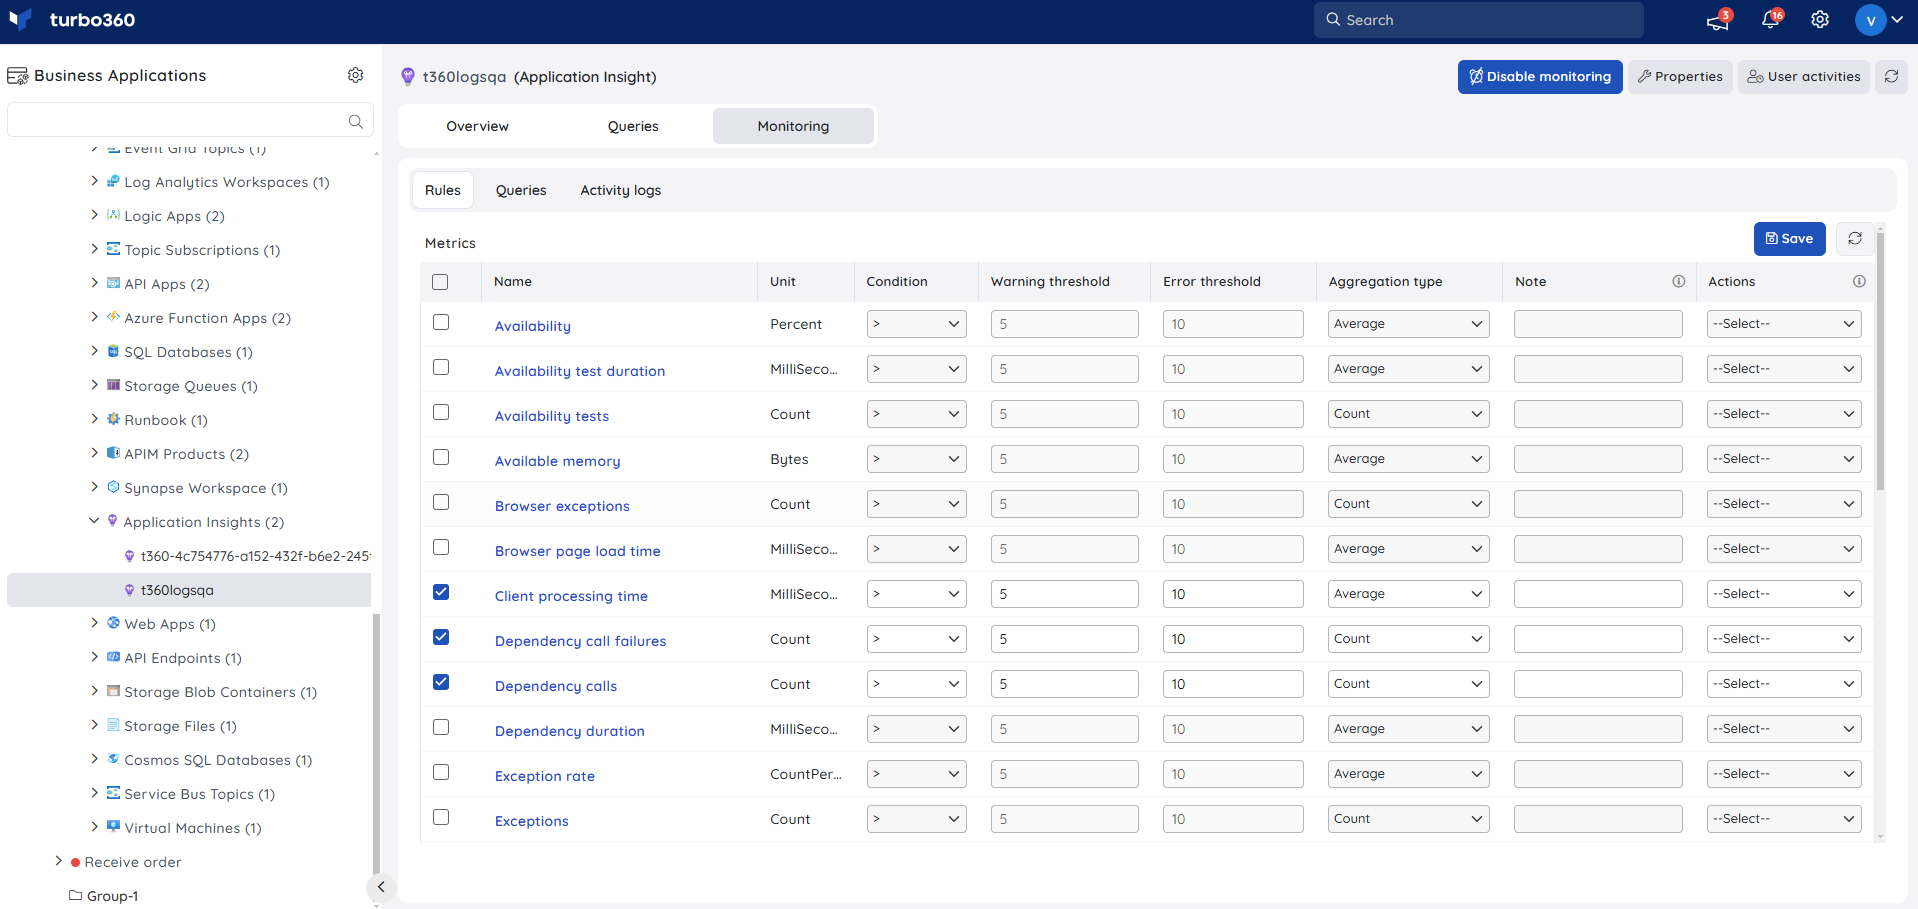
Monitoring rules will be saved for Application Insights, and the monitoring state for the metrics will be reflected after every monitoring cycle.
Query monitoring
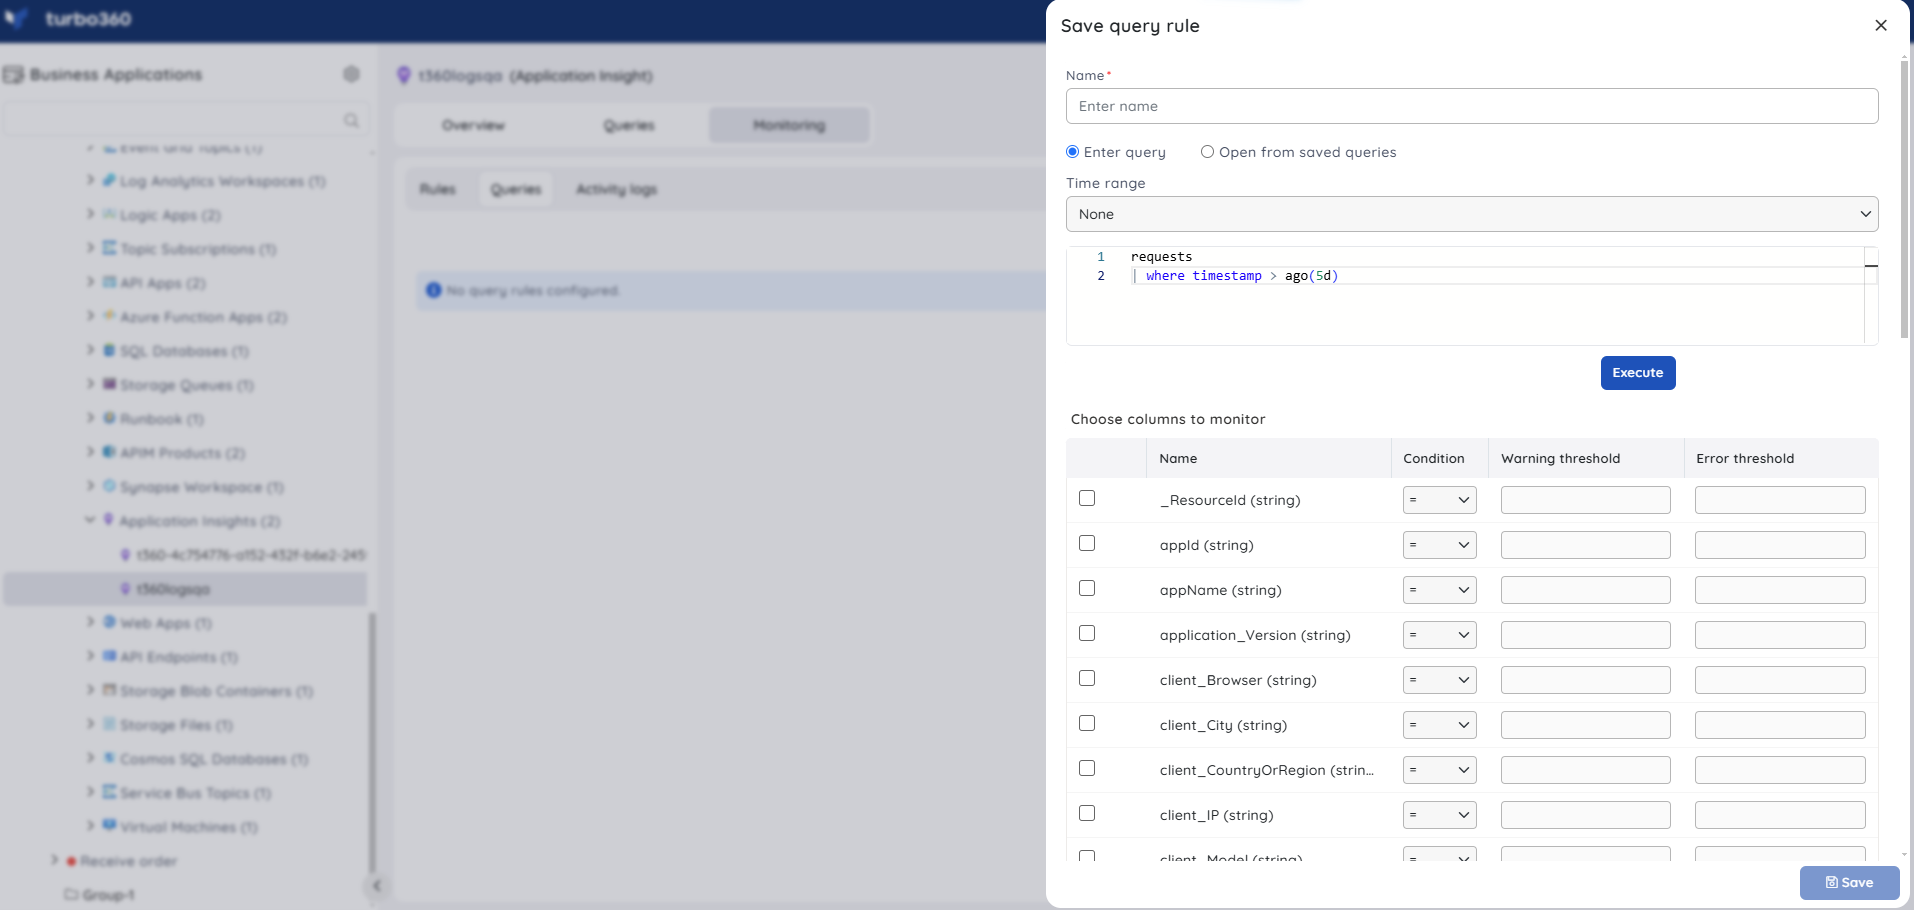
- Switch to the Queries tab to configure rules for query monitoring
- Click Add
- Enter a name to the query rule
- You can enter the desired query by choosing Enter query (or) select one from the list of saved queries by choosing Open from saved queries
- Select the preferred time range
- Click Execute to run the query
- Select the required query columns and configure the threshold values
- You can include any query link along with the query violation alert by enabling the Add query link in alert checkbox and selecting any saved queries
- You can also include any query result along with the query violation alert by enabling the Add query result in alert checkbox and executing or selecting a saved query. Also, choose the required query columns for which the result is to be displayed
- Click Save
Application insights allow both scalar and non-scalar queries for query monitoring.
Query monitoring will be initiated once the rules are saved, and the query monitoring state will be reflected after every monitoring cycle.

