Turbo360 Dashboard
- 05 Feb 2025
- 4 Minutes to read
- Print
- DarkLight
- PDF
Turbo360 Dashboard
- Updated on 05 Feb 2025
- 4 Minutes to read
- Print
- DarkLight
- PDF
Article summary
Did you find this summary helpful?
Thank you for your feedback!
Introduction
The dashboard available in the Turbo360 homepage provides a centralized view of key metrics and data, offering quick access to essential data and features within Turbo360 through widgets. It includes real-time updates, data visualizations, and actionable insights, improving user efficiency.
It can also be customized as per individual preferences which helps users monitor performance, track trends, and take informed actions with ease.
Widget configuration
Turbo360 dashboard requires the initial configuration of all modules to enable widget setup for each module.
- Click the Add widgets button under the Widgets section in the Turbo360 homepage to begin with widget configuration.
- Choose the required module to configure widgets for the same.
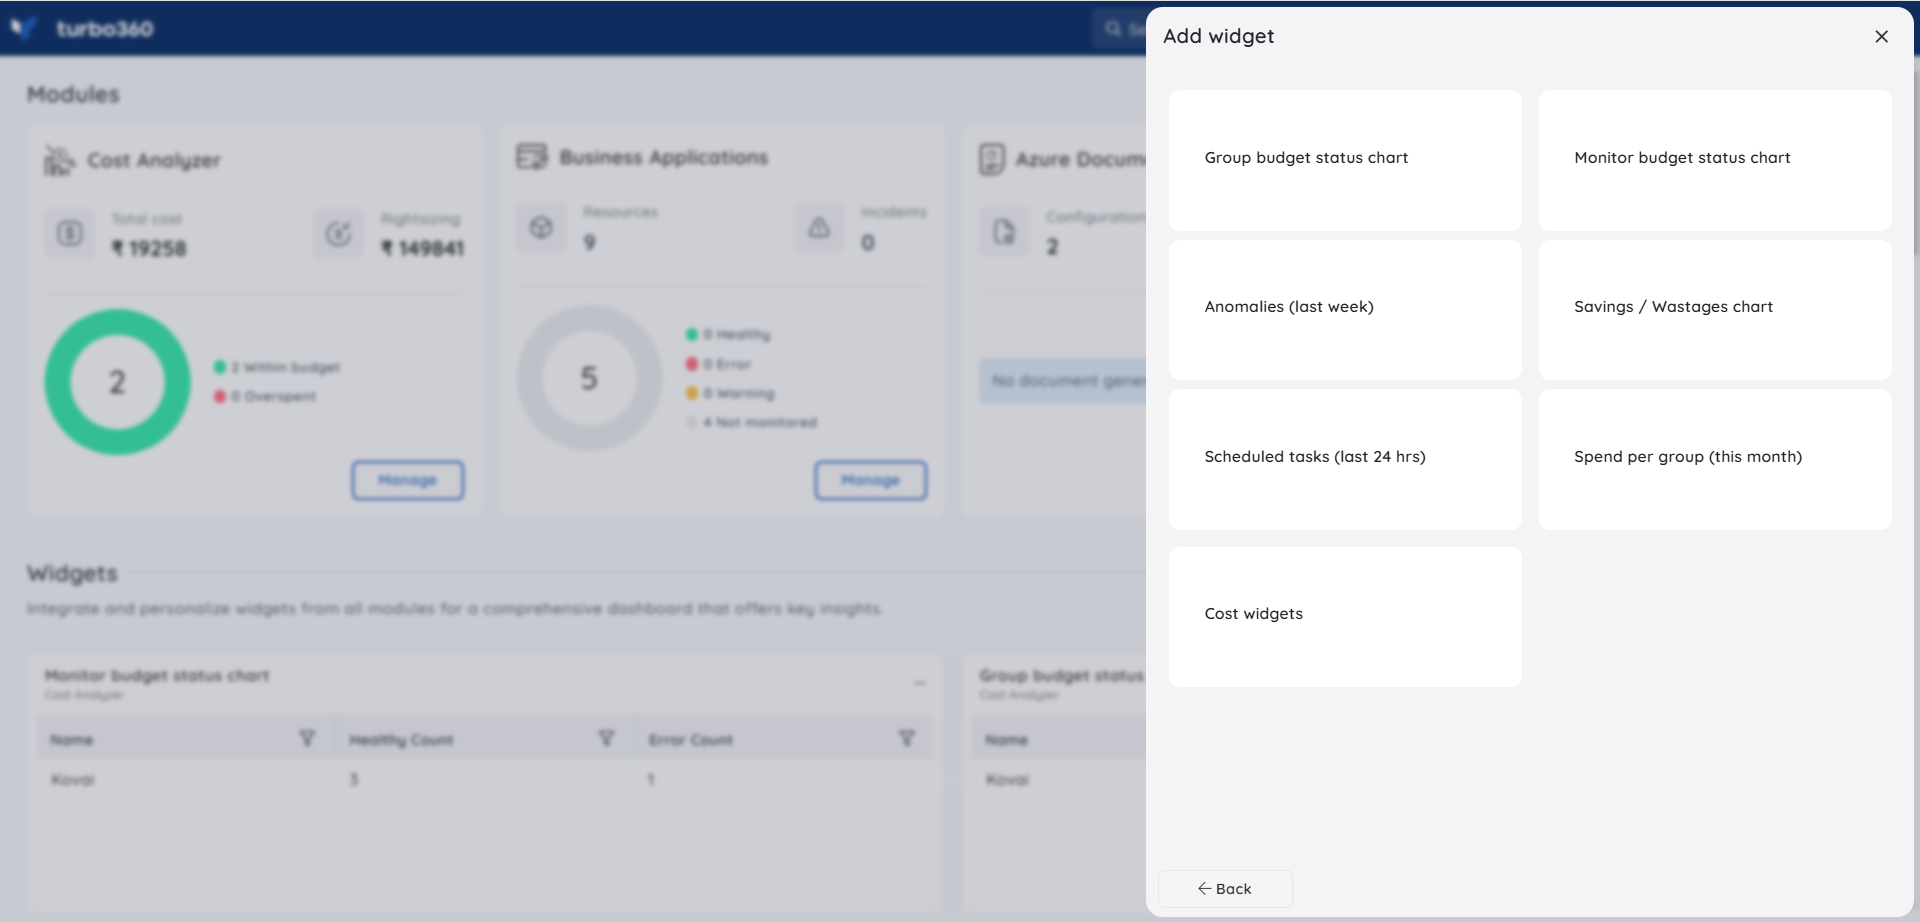
Cost Analyzer Widgets
Choosing Cost Analyser will have widgets for the following key features:
Group Budget Status Chart – Displays the status of the group budget in either a table or column chart format, for the cost management group(s) selected during widget configuration.
Monitor budget status chart - Displays the status of the monitor budget in either a table or column chart format, based on the cost management group(s) selected during widget configuration.
Anomalies (last week) - Displays anomalies detected over the past week in a line chart format, based on the cost management group(s) selected during widget configuration.
Savings/ Wastages chart - Displays detected savings or wastages in a table, bar, or donut chart format, based on the cost management group(s) selected during widget configuration.
Scheduled tasks(last 24 hrs) - Displays count of completed scheduled tasks for the last 24 hours in a table or bar chart format, based on the cost management group(s) selected during widget configuration.
Spend per group(this month) - Displays the current month spend in a table, bar, or donut chart format, based on the cost management group(s) selected during widget configuration.
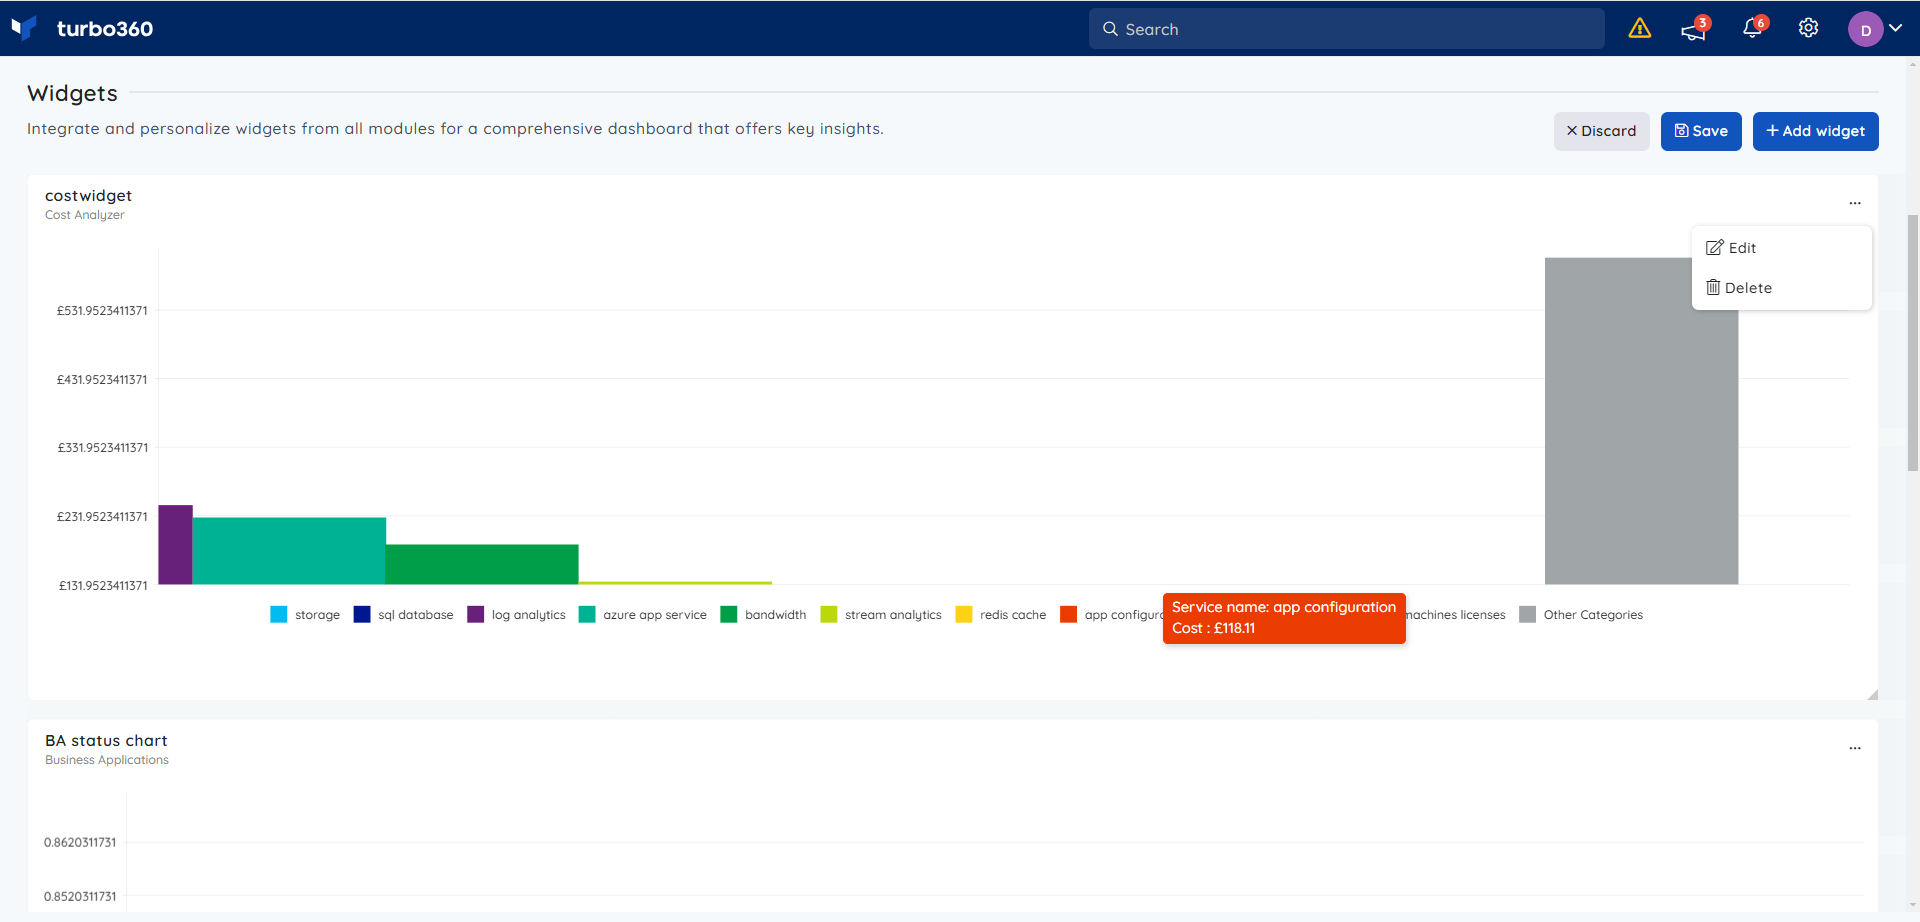
Cost widgets - Displays a cost chart based on Resource, Resource Group, Location, etc., in column, table, donut, or line chart format, depending on the subscriptions, metrics, and filters applied during widget configuration.
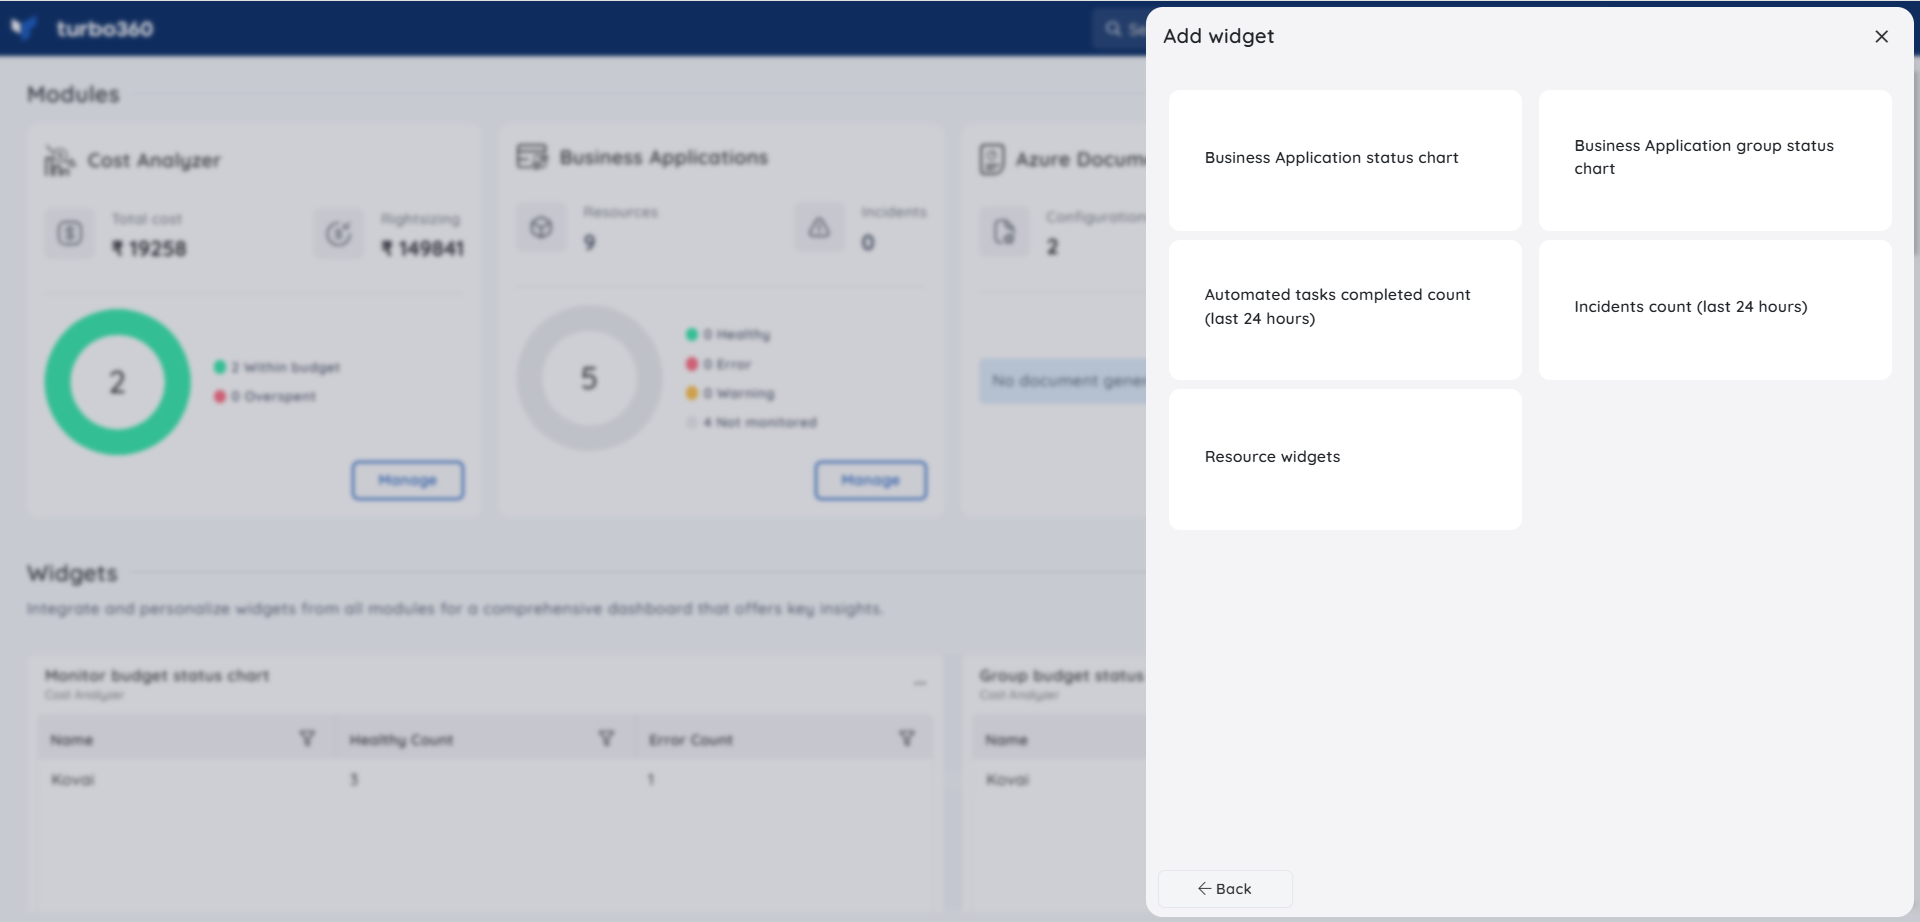
Business Application Widgets
Choosing Business Application will have widgets for the following key features:
Business Application status chart - Displays the monitoring status of Business Applications in column or table chart format, based on the Business Application group(s) selected during widget configuration.
Business Application group status chart - Displays the monitoring status of Business Application groups in column or table chart format, based on the Business Application group(s) selected during widget configuration.
Automated tasks completed count (last 24 hours) - Displays automated tasks completed count for the past 24 hours in table, bar or donut chart format, for the Business Application group(s) selected during widget configuration.
Incidents count (last 24 hours) - Displays Incidents count for the past 24 hours in table or donut chart format, for the Business Application group(s) selected during widget configuration.
Resource widgets - Displays chart for each resource based on time range and granularity in table, bar, donut, count, area or line chart format, depending on the resource type chosen during widget configuration.
Azure Documenter Widgets
Choosing Azure Documenter will have widgets for the following key features:
Generation count - Displays the document generated count for the past 24 hours or current month in table, bar or donut chart format, for the document group(s) selected during widget configuration.
Failed generations - Displays the count of failed document generations for the past 24 hours or current month in table, bar, or donut chart format, based on the document group(s) selected during widget configuration.

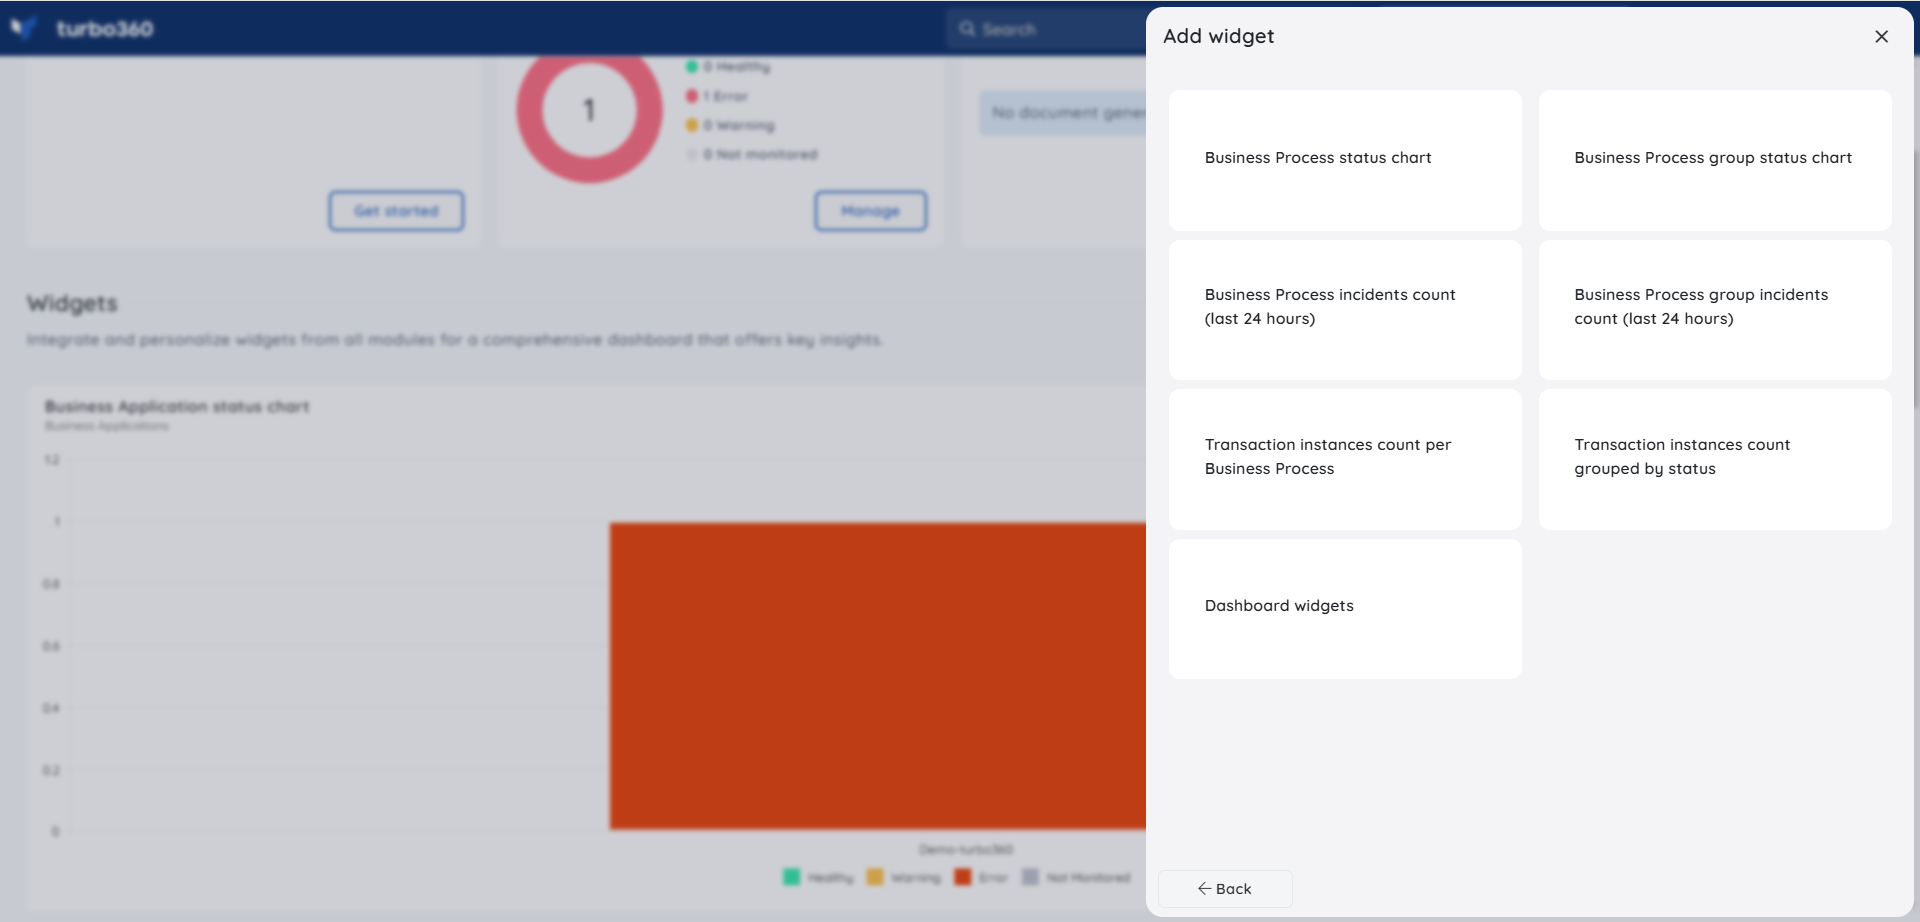
Business Activity Monitoring Widgets
Choosing Business Activity Monitoring will have widgets for the following key features:
Business Process status chart - Displays the monitoring status of Business Process in column or table chart format, based on the Business Process group(s) selected during widget configuration.
Business Process group status chart - Displays the monitoring status of Business Process groups in column or table chart format, based on the Business Process group(s) selected during widget configuration.
Business Process incidents count (last 24 hours) - Displays the incident count for the business process over the past 24 hours in table or donut chart format, based on the Business Process group(s) selected during widget configuration.
Business Process group incidents count (last 24 hours) - Displays the incident count for the business process group over the past 24 hours in table or donut chart format, based on the Business Process group(s) selected during widget configuration.
Transaction instances count per Business Process - Displays the transaction instances count per Business Process over the past 24 hours or current month in table, bar or donut chart format, based on the Business Process group(s) selected during widget configuration.
Transaction instances count grouped by status - Displays the transaction instances count grouped by status over the past 24 hours or current month in table or column chart format, based on the Business Process group(s) selected during widget configuration.
Assigned Transactions - Displays the assigned transactions count in table, bar or donut chart format, based on the Business Process group(s) selected during widget configuration.
Dashboard widgets - Displays essential data for querying and custom logging, tailored to the query type (transaction or staging) and report type, displayed in line, bar, or column chart formats.
Editing the widgets
Widget configurations can be updated anytime using the Edit option to accommodate on-demand needs.
Ordering the widgets
The user may simply drag the widget to the desired location and resize it to fit in the layout.
Zoom in - Zoom out
Scrolling through the Turbo360 widgets offers a better understanding of the data points.
Was this article helpful?