

Analyze cost drivers
- 05 Aug 2026
- 7 Minutes to read
- Print
- DarkLight
- Download PDF
Analyze cost drivers
- Updated on 05 Aug 2026
- 7 Minutes to read
- Print
- DarkLight
- Download PDF
Article summary
Did you find this summary helpful?
Thank you for your feedback!
Overview
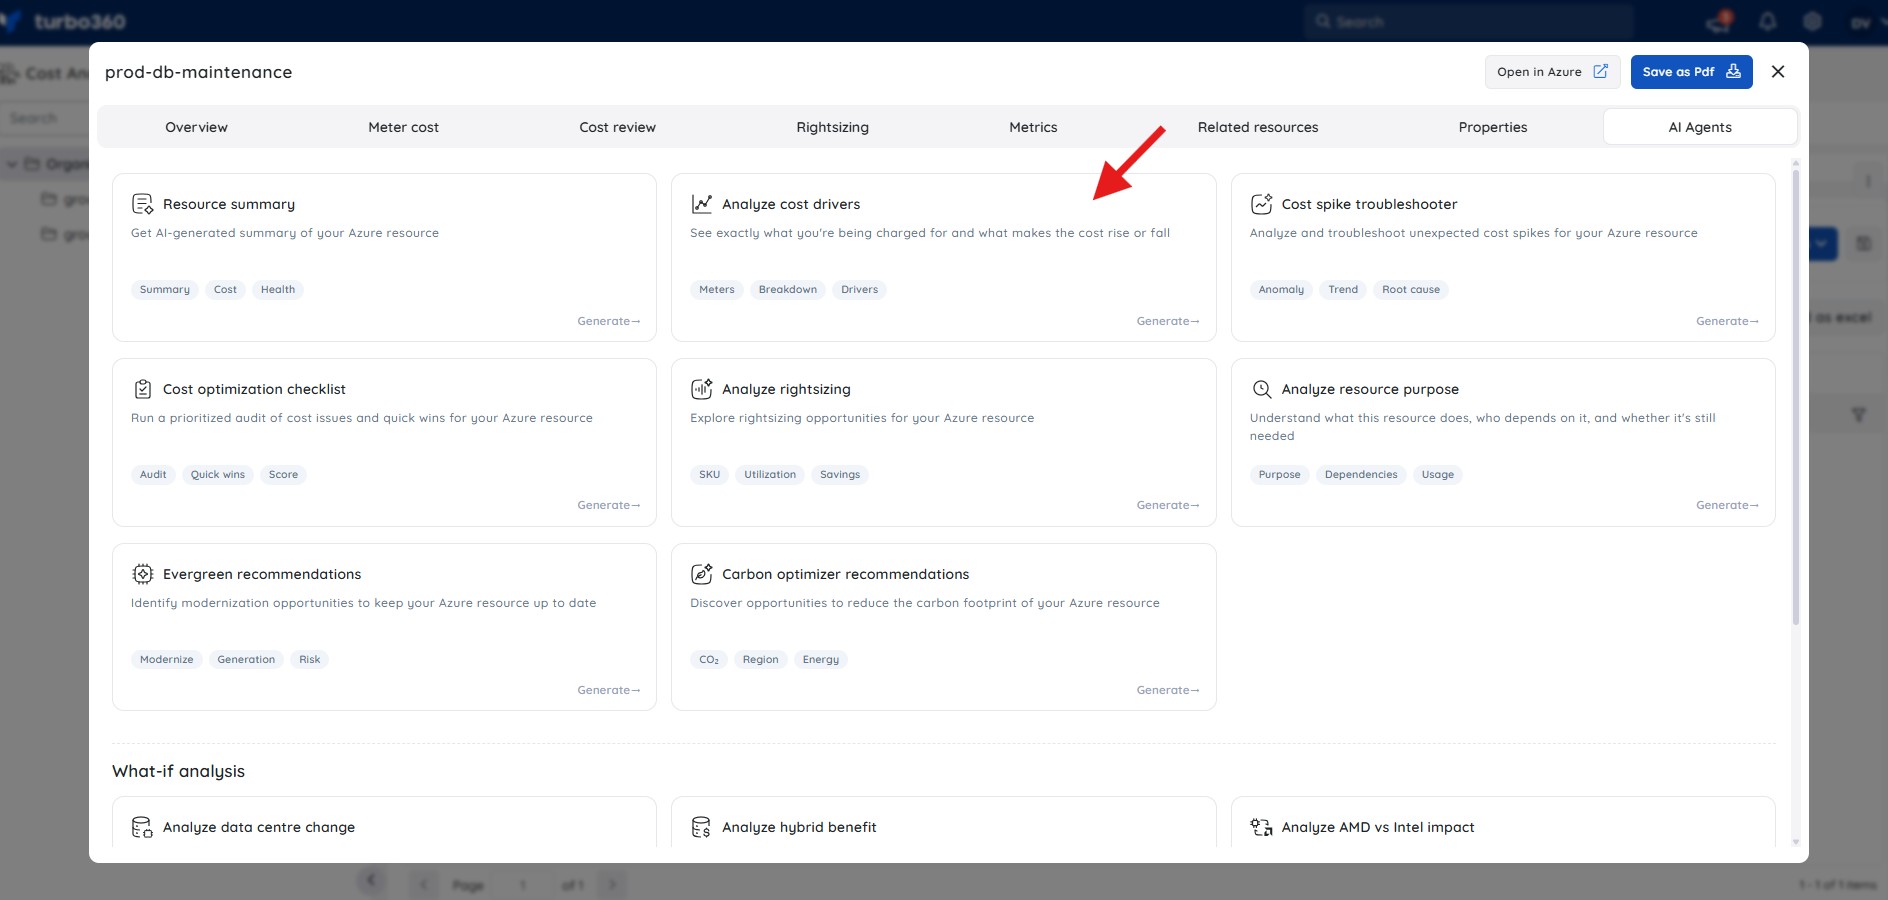
The Cost intelligence view for resources in Cost Analyzer includes a built-in AI capability, Analyze cost drivers, available under AI Agents, that breaks down what is driving the cost of an Azure resource — showing which meters contribute the most, how the bill is structured, and what actions are most likely to reduce spend.
Business value
Analyze cost drivers replaces manual bill inspection with a ready-made breakdown of what is actually driving a resource's cost. It helps teams quickly spot which meters, pricing model, or usage pattern are responsible for spend, so they can act on the highest-impact reduction opportunity instead of reviewing every line item on the invoice.
Prerequisites
Required permissions
Access requires both the AI Agents feature to be enabled for the role and Read access to the Analysis feature, since Analyze cost drivers is surfaced from the resource-level Cost intelligence view within Analysis.
| Role | Permission level | Access |
|---|---|---|
| Account Owner / Owner / Contributor | Full access | Can use Analyze cost drivers on any resource |
| Custom role | AI Agents — Enable, Analysis — Read (or Manage) | When AI Agents is set to Enable and Analysis is toggled on with at least Read access, the user can view Analyze cost drivers insights for resources within their assigned scope; if either is missing, the option is not available |
.jpg)
How it works
What the AI Agent analyzes
- Resource type, SKU, and pricing tier
- Active billing meters and their usage rates
- Cost behavior — fixed, variable, and volatile charges
- Pricing model in use (Pay-As-You-Go, Reserved, Spot)
- Hidden or easily overlooked cost items
Insight breakdown
- Anatomy of the bill — lists all active billable meters with their rate, usage, monthly cost, and percentage of the total.
- Top cost drivers — ranks the meters contributing the most to the cost, with an explanation of why each is high and what would cause it to rise or fall.
- Cost behavior — categorizes charges into Fixed, Variable, and Volatile costs, helping users understand which parts of the bill are predictable and which carry risk.
- Why your bill might change next month — lists specific scenarios that would increase or decrease the cost, such as resizing the VM, changing uptime, or switching pricing models.
- Pricing model decoder — explains the current pricing model and compares alternatives — Reserved Instance, Azure Hybrid Benefit, and Spot pricing — with estimated savings for each.
- Hidden costs to watch — surfaces charges that are easy to overlook, such as secondary compute meters or always-on billing patterns.
Steps
To run an Analyze cost drivers analysis, navigate to Cost Analyzer > Analysis, open a Cost management group, and select a resource from the analysis view to open its Cost intelligence panel.
- In the Cost intelligence panel for a resource, select the Analyze cost drivers tab.
- Review the anatomy of the bill, which lists every active billable meter with its rate, usage calculation, monthly cost, and percentage of total spend. The bar chart at the top visualizes the meter mix at a glance.
- Review the top cost drivers section — each driver is numbered by its share of the bill, names the specific meter, states the monthly cost, and explains what is causing the charge and what the main levers are.
- Review the cost behavior panel, which categorizes all charges into Fixed (predictable, tied to provisioned capacity), Variable (scales with usage), and Volatile (subject to spikes or resize events).
- Review the why your bill might change next month section — the increase and decrease panels list specific triggers (e.g. moving to a larger size, keeping the VM running a full month, stopping when idle, rightsizing to a smaller SKU) with estimated cost impact.
- Review the pricing model decoder to understand the current model and evaluate alternatives — Reserved Instance, Azure Hybrid Benefit, and Spot pricing — each showing eligibility status and estimated percentage saving.
- Review the hidden costs to watch section for secondary meters and always-on billing patterns that are easy to miss on the raw invoice.
Example scenario
The example below is based on a Windows Virtual Machine (Standard_DC2ads_v5 in eastus) with an amortized cost of ₹2,211.96/month on Pay-As-You-Go pricing. The resource is part of a confidential VM workload.
Anatomy of the bill — two billable meters are active across 2 billable meters total. The primary meter (Dc16ads V5) accounts for 95.4% of the bill at ₹2,109.13/month (rate: ₹1.44 per vCPU-hr × 1,460 vCPU-hrs = 2 vCPUs running continuously at 730 hrs/month). The secondary meter (Dc2ads V5) accounts for 4.6% at ₹102.83/month at a lower rate per vCPU-hr.
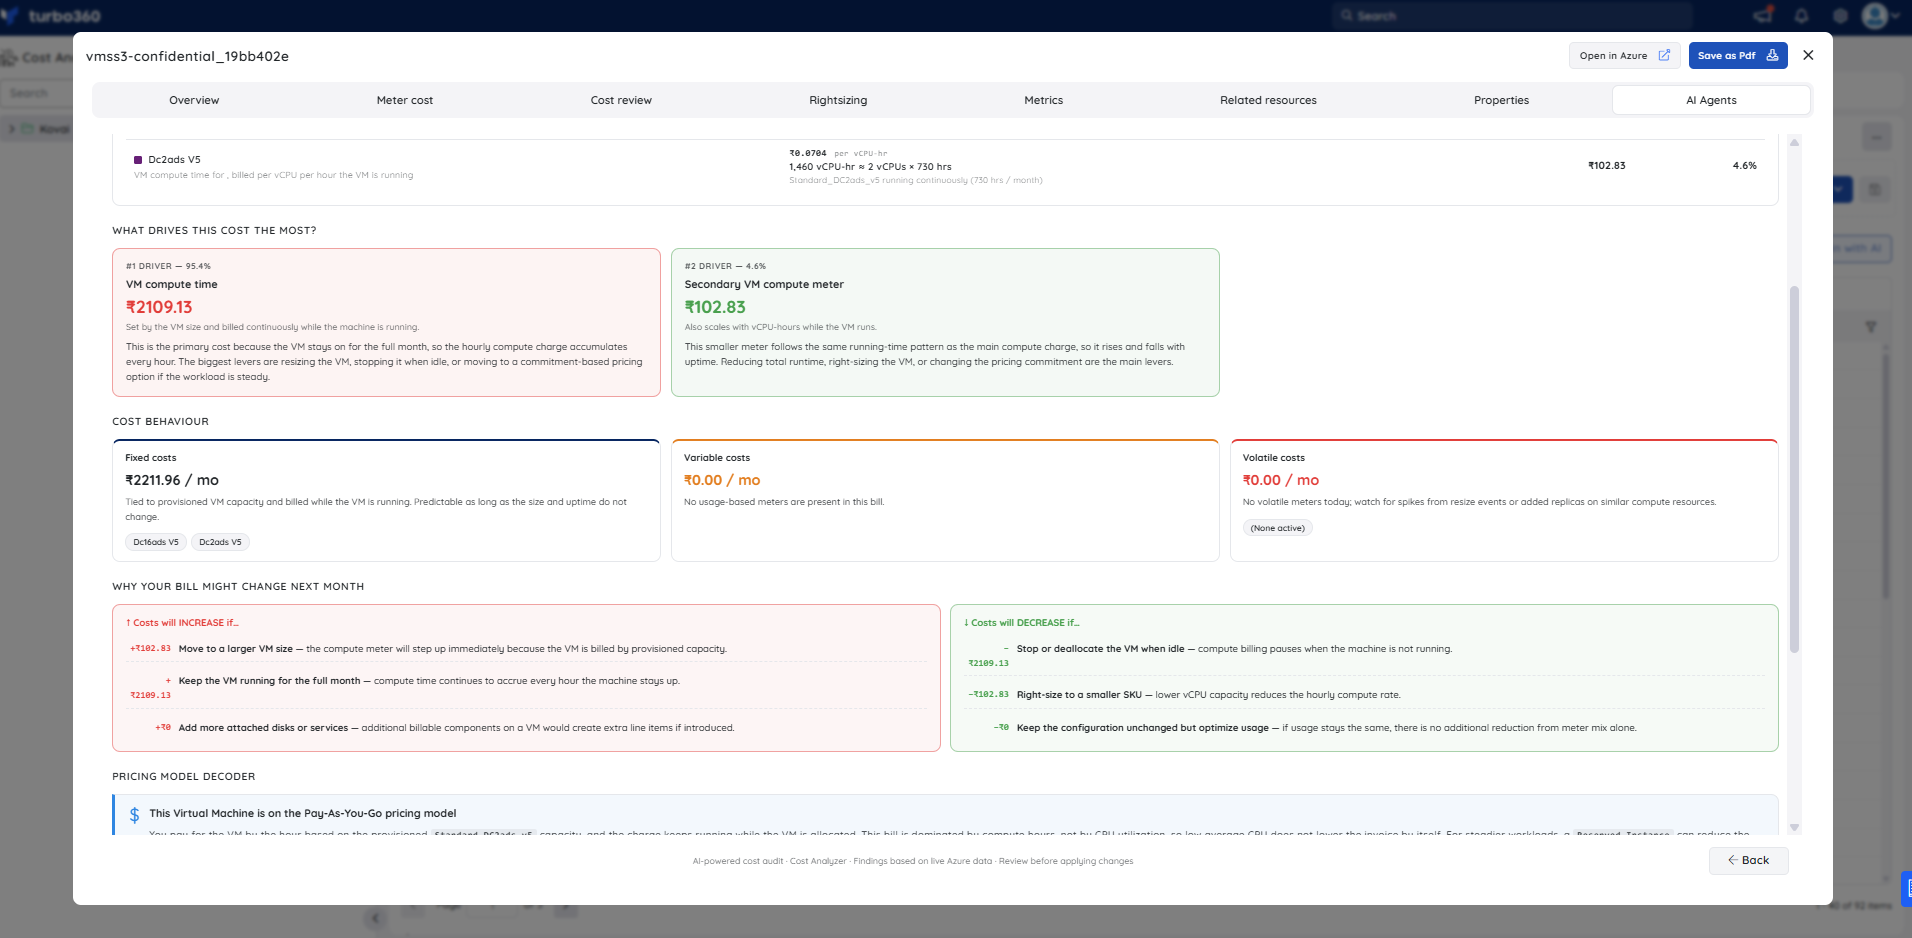
Top cost drivers — Driver #1 (95.4%, ₹2,109.13) is VM compute time: set by the VM size and billed continuously while the machine is running. The agent explains that because the VM stays on for the full month, the hourly compute charge accumulates every hour, and the biggest levers are resizing the VM, stopping it when idle, or moving to a commitment-based pricing option if the workload is steady. Driver #2 (4.6%, ₹102.83) is the secondary VM compute meter, which follows the same runtime pattern as the main compute charge; reducing total runtime, rightsizing, or changing the pricing commitment are the main levers.
Cost behavior — Fixed costs: ₹2,211.96/month, tied to provisioned VM capacity and billed while the VM is running, predictable as long as size and uptime do not change (tagged to Dc16ads V5 and Dc2ads V5 meters). Variable costs: ₹0/month — no usage-based meters present in this bill. Volatile costs: ₹0/month — no volatile meters today, but the agent notes to watch for spikes from resize events or added replicas on similar compute resources.
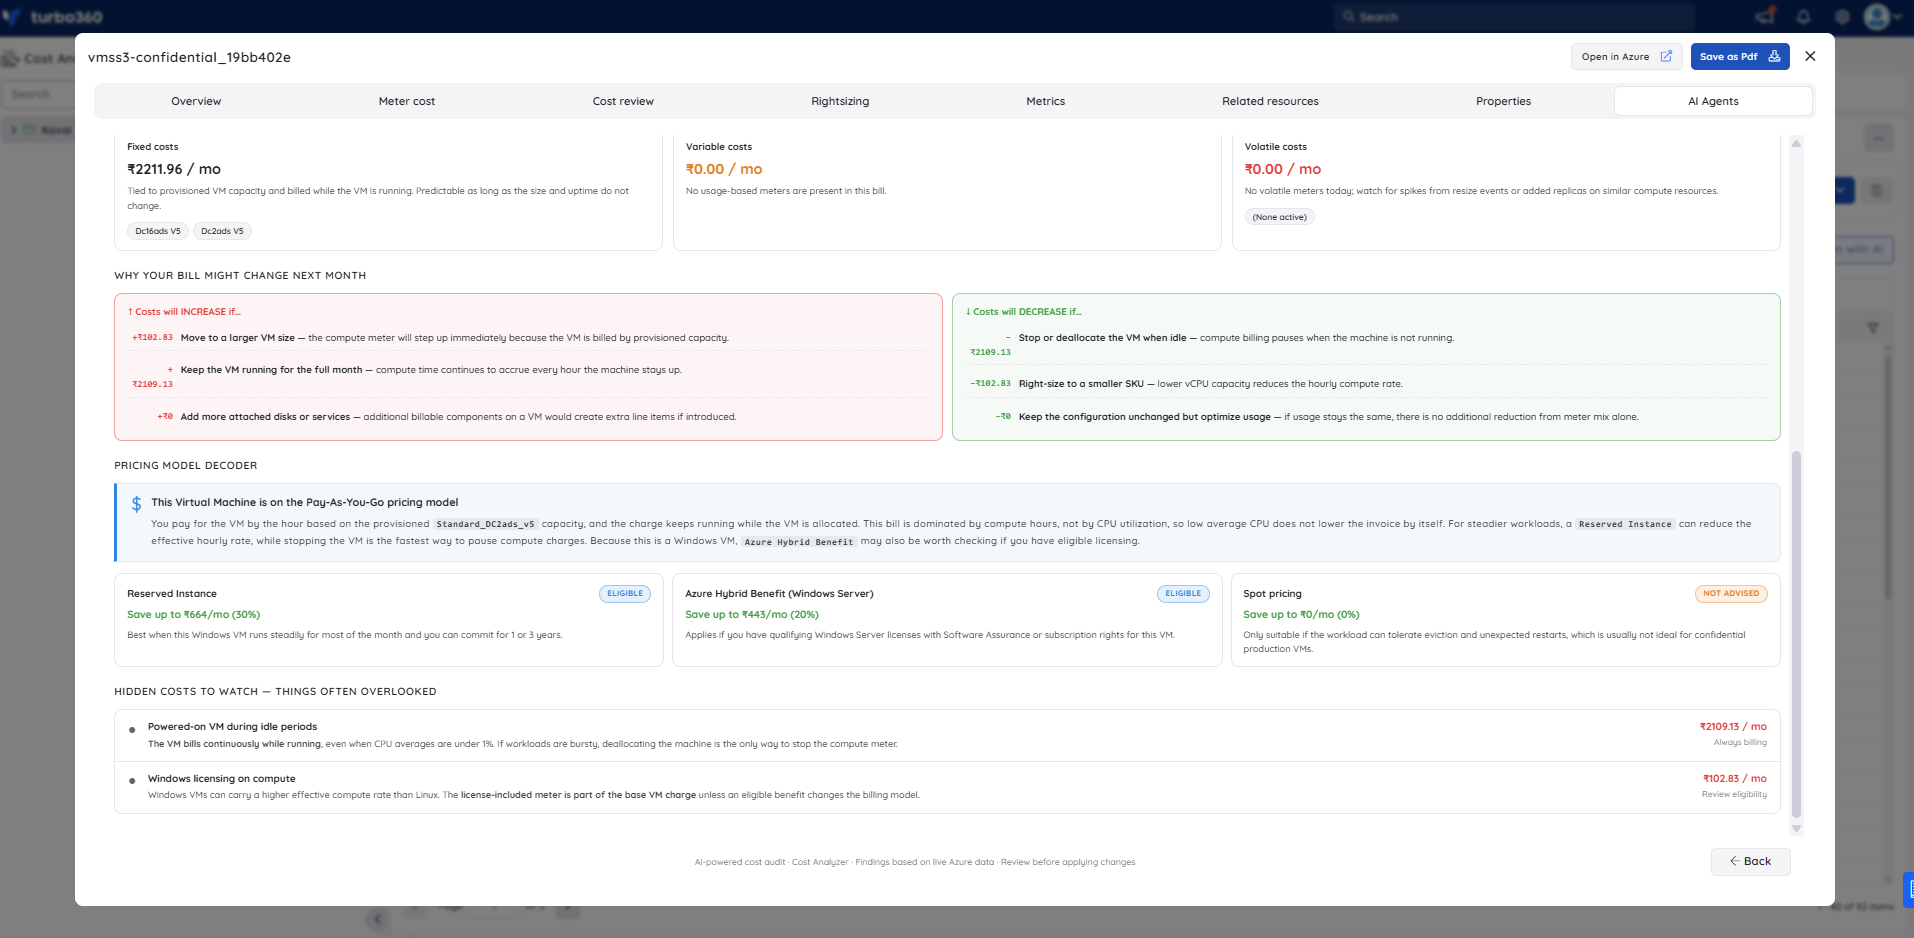
Why your bill might change next month — costs will increase if: moving to a larger VM size (+₹102.83); keeping the VM running for the full month (+₹2,109.13); adding more attached disks or services (+₹0 estimated). Costs will decrease if: stopping or deallocating the VM when idle (−₹2,109.13); rightsizing to a smaller SKU (−₹102.83); keeping the configuration unchanged but optimizing usage (−₹0, since meter mix alone does not reduce the invoice).
Pricing model decoder — the VM is on Pay-As-You-Go. Three alternatives are evaluated: Reserved Instance (Eligible — save up to ₹664/month, 30%, best when this Windows VM runs steadily for most of the month and a 1 or 3-year commitment is feasible); Azure Hybrid Benefit (Eligible — save up to ₹443/month, 20%, applies if qualifying Windows Server licenses with Software Assurance or subscription rights are available); Spot pricing (Not Advised — saves up to ₹0/month, 0%, only suitable if the workload can tolerate eviction and unexpected restarts, which is not ideal for confidential production VMs).
Hidden costs to watch — two items are flagged. Powered-on VM during idle periods (₹2,109.13/month, always billing): the VM bills continuously while running, even when CPU averages are under 1%; if workloads are bursty, deallocating the machine is the only way to stop the compute meter. Windows licensing on compute (₹102.83/month, review eligibility): Windows VMs carry a higher effective compute rate than Linux; the license-included meter is part of the base VM charge unless an eligible benefit changes the billing model.
Troubleshooting
- Analyze cost drivers tab is not visible for a resource
Cause: The user's Custom role does not have the AI Agents feature permission enabled, or the Analysis feature is not toggled on for the role.
Fix: Go to User management > Roles, edit the relevant Custom role, and enable the AI Agents toggle and the Analysis permission under Specify feature permissions. - The insight breakdown shows no meter data
Cause: The resource may not have billing data yet — for example, a newly provisioned resource with no recorded charges.
Fix: Wait until the resource has at least one billing cycle of cost data, then re-run Analyze cost drivers. - Pricing model decoder shows no alternative options
Cause: The resource type or SKU may not be eligible for Reserved Instance, Azure Hybrid Benefit, or Spot pricing.
Fix: Review the resource's eligibility through the Azure portal. Not all resource types or regions support all pricing alternatives.
FAQs
- How current is the billing data used in the analysis?
The analysis uses the billing meter data available at the time Analyze cost drivers is triggered. Billing data typically has a 24–48 hour processing delay in Azure. - Does the agent apply any of its recommendations automatically?
No. Analyze cost drivers provides insights and recommendations only; you review and execute any actions manually.
Related articles
Was this article helpful?