

Analyze resource purpose
- 05 Aug 2026
- 7 Minutes to read
- Print
- DarkLight
- Download PDF
Analyze resource purpose
- Updated on 05 Aug 2026
- 7 Minutes to read
- Print
- DarkLight
- Download PDF
Article summary
Did you find this summary helpful?
Thank you for your feedback!
Overview
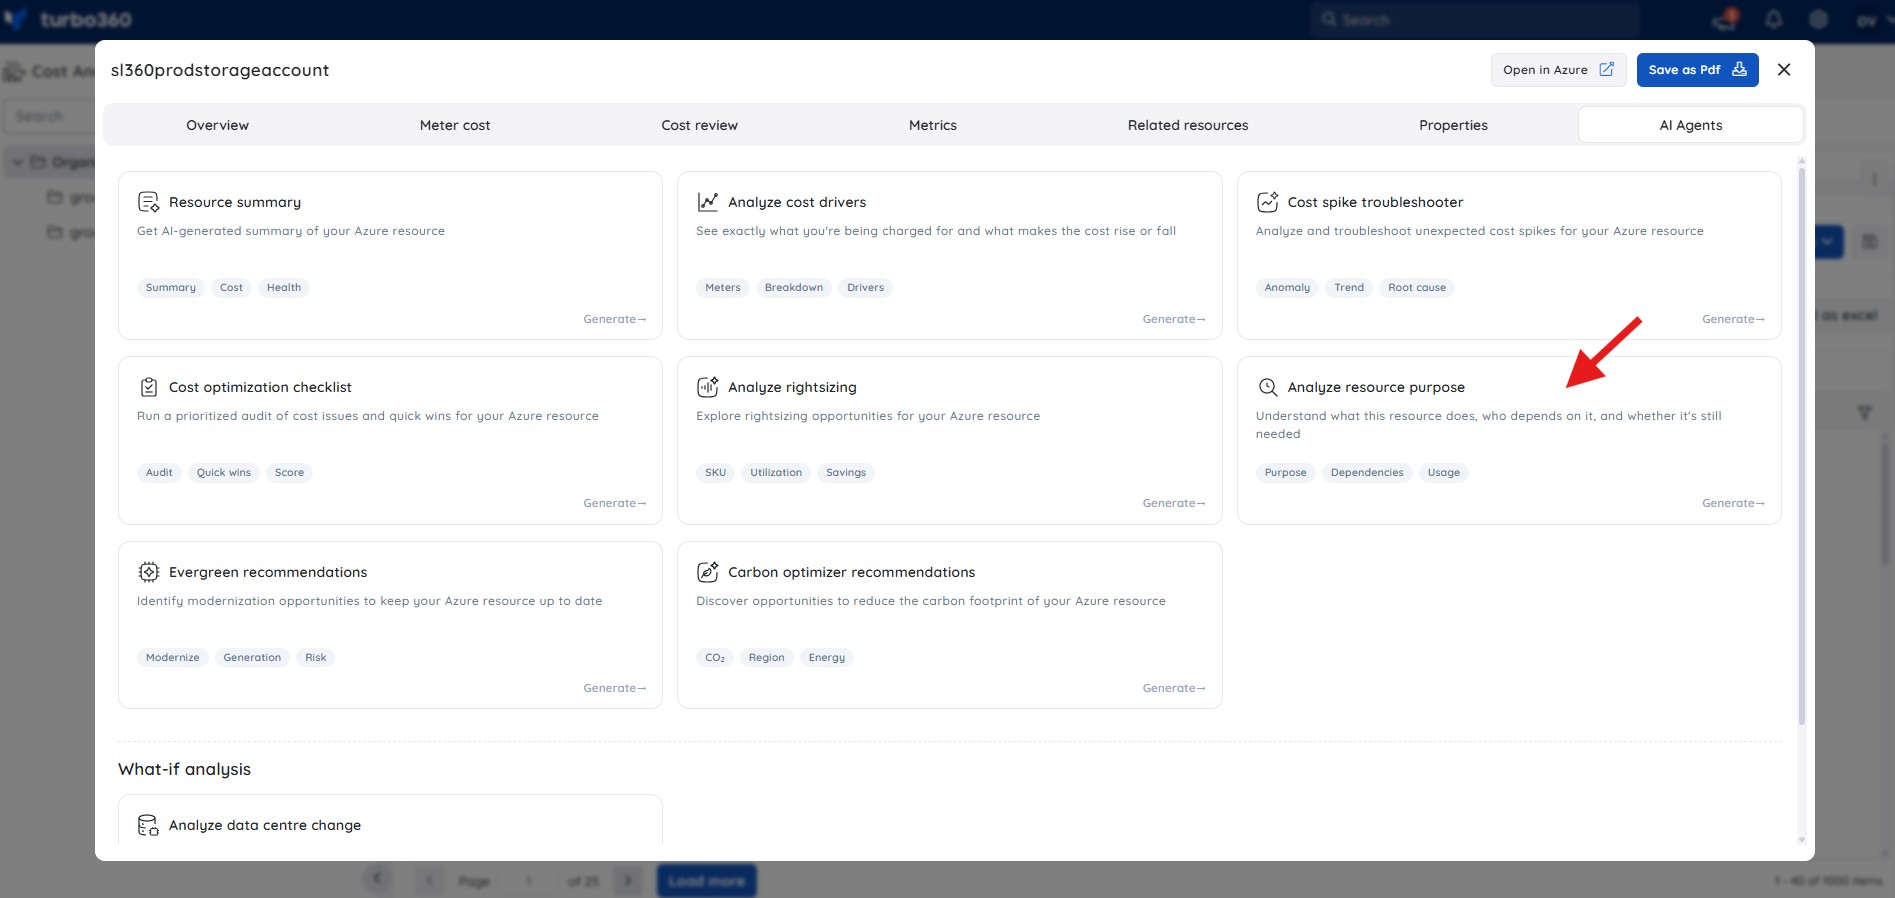
The Cost intelligence view for resources in Cost Analyzer includes a built-in AI capability, Analyze resource purpose, available under AI Agents, that helps you understand what an Azure resource does, who depends on it, and whether it is still actively needed.
Business value
Analyze resource purpose replaces manual dependency-tracing with a ready-made picture of what a resource does and who relies on it. It helps teams confidently decide whether a resource is safe to decommission, instead of risking downtime from removing something still in use.
Prerequisites
Required permissions
Access requires both the AI Agents feature to be enabled for the role and Read access to the Analysis feature, since Analyze resource purpose is surfaced from the resource-level Cost intelligence view within Analysis.
| Role | Permission level | Access |
|---|---|---|
| Account Owner / Owner / Contributor | Full access | Can use Analyze resource purpose on any resource |
| Custom role | AI Agents — Enable, Analysis — Read (or Manage) | When AI Agents is set to Enable and Analysis is toggled on with at least Read access, the user can view Analyze resource purpose insights for resources within their assigned scope; if either is missing, the option is not available |
.jpg)
How it works
What the AI Agent analyzes
- Resource type, SKU, region, and provisioning state
- Resource tags and their implied purpose
- Activity signals — last activity, data size, and orphan risk
- Resource-specific configuration and security settings
- Usage patterns inferred from metrics and logs
Insight breakdown
The output is organized across two tabs — Technical and Business — so engineers and non-technical stakeholders can both work from the same analysis.
Technical tab:
- Resource status and cost summary — displays the current status, age of the resource, and amortized cost for the last 30 days.
- What is this resource? — describes the resource type, configuration, and inferred role, along with the tags applied to it.
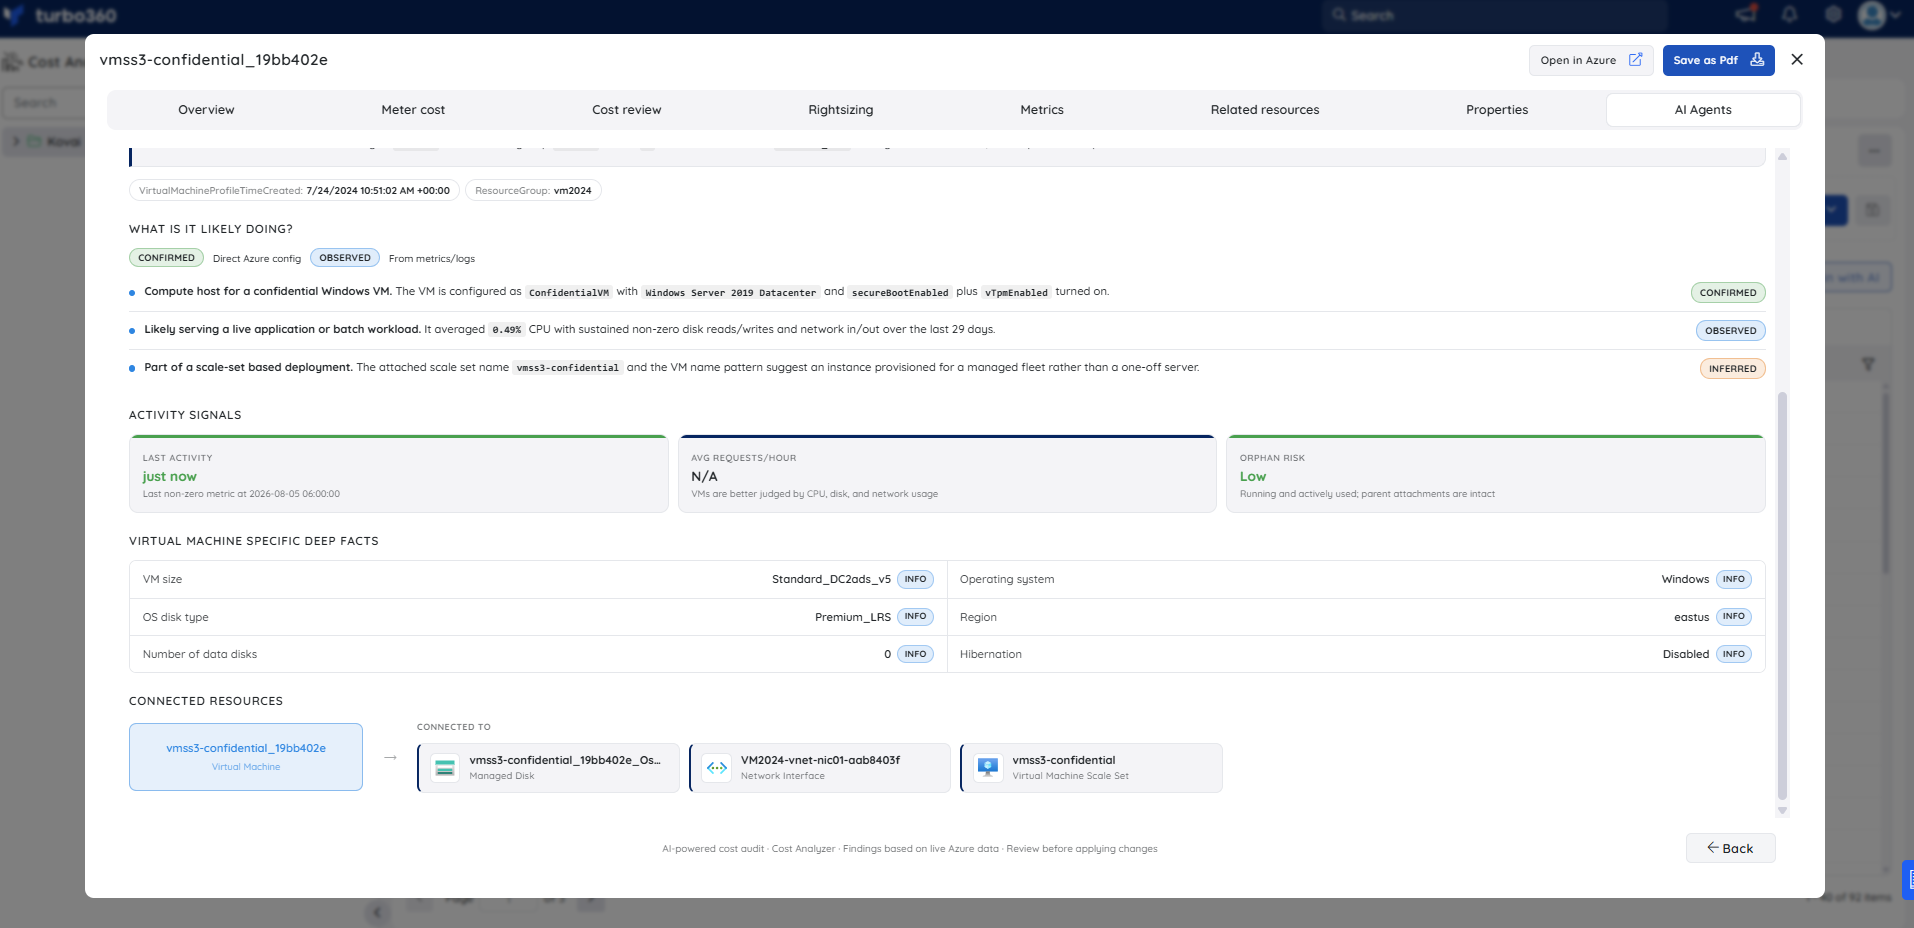
- What is it likely doing? — lists the probable functions of the resource, each labeled as Confirmed, Observed, or Inferred based on the source of evidence.
- Activity signals — summarizes last activity, average requests per hour, and orphan risk to help identify whether the resource is actively in use or potentially idle.
- Resource-specific deep facts — surfaces detailed configuration facts — SKU, region, OS disk type, hibernation, and data disk count — with expandable info labels for each.
- Connected resources — shows the managed disks, network interfaces, scale sets, or other resources attached to this resource.
Business tab:
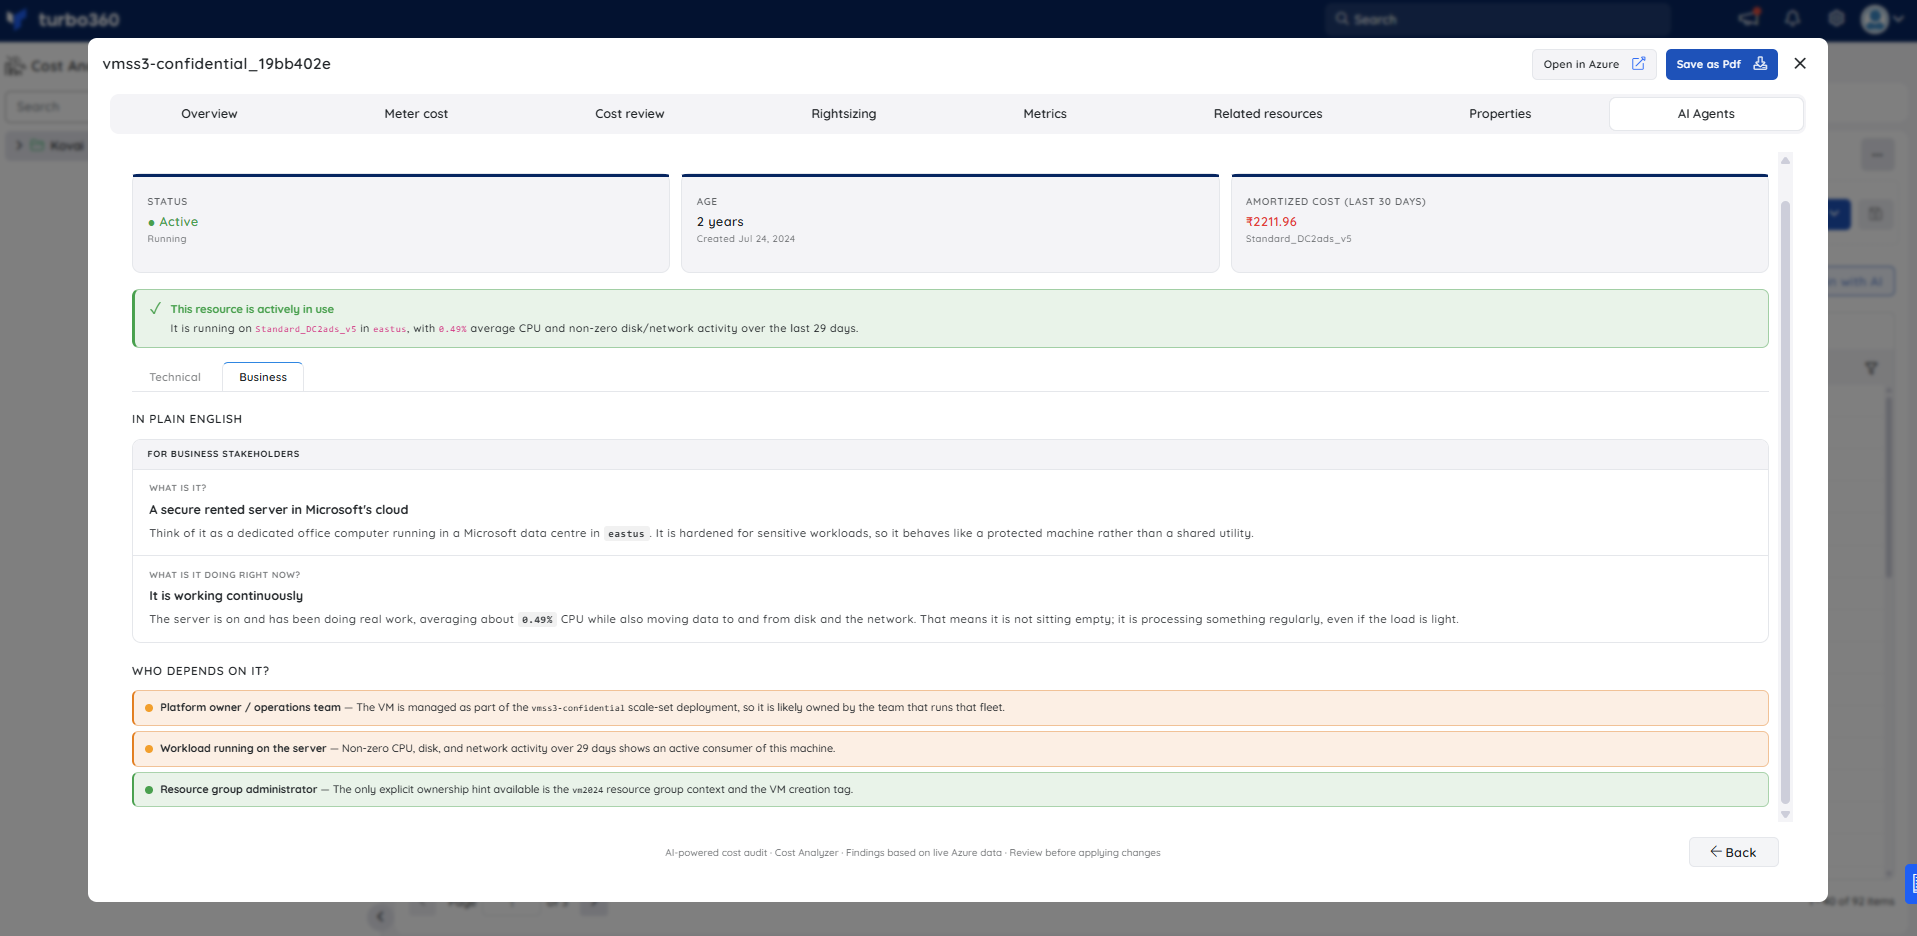
- In plain English — translates the technical findings into non-technical language for business stakeholders. It presents two sub-sections: "What is it?" (a plain-English description of what the resource is and what it is designed for) and "What is it doing right now?" (a plain-English summary of the resource's current activity level and what that implies for operations).
- Who depends on it? — lists the teams, workloads, and platform services that rely on this resource, each with a brief explanation of why. Entries are color-coded by confidence level to help triage ownership questions.
Steps
To run an Analyze resource purpose analysis, navigate to Cost Analyzer > Analysis, open a Cost management group, and select a resource from the analysis view to open its Cost intelligence panel.
- In the Cost intelligence panel for a resource, select the Analyze resource purpose tab.
- Review the resource status and cost summary — it shows the current status (Active/Inactive), the resource's age and creation date, and the amortized cost for the last 30 days.
- Review the activity summary banner, which gives an immediate signal on whether the resource is actively in use, along with average CPU and disk/network activity context.
- On the Technical tab, review "What is this resource?" for resource type, OS, storage tier, and resource group context.
- Review "What is it likely doing?" — each finding is labeled Confirmed (from direct Azure config), Observed (from metrics or logs), or Inferred (deduced from resource type and naming), so you can calibrate confidence in each statement.
- Review the activity signals panel — last activity timestamp, average requests/hour, and orphan risk rating.
- Review the resource-specific deep facts table and the connected resources panel to understand attached infrastructure before making any decommission or resize decision.
- Switch to the Business tab to review the "In plain English" section, which presents a jargon-free description of what the resource is and what it is currently doing — useful for sharing with non-technical stakeholders.
- Review "Who depends on it?" — each entry names a team, workload, or platform service that relies on this resource, with an explanation of the dependency and a confidence color coding.
Example scenario
The example below is based on a Windows Virtual Machine (Standard_DC2ads_v5 in eastus, resource group vm2024) that is 2 years old with a current amortized cost of ₹2,211.96/month.
Resource status and cost summary — status is Active (Running), created on 24 Jul 2024 (2 years old), amortized cost ₹2,211.96/month on Standard_DC2ads_v5.
Activity summary banner — the agent shows a green "This resource is actively in use" confirmation. It is running on Standard_DC2ads_v5 in eastus with 0.49% average CPU and non-zero disk/network activity over the last 29 days.
What is this resource? (Technical tab) — a Windows server running in eastus for resource group vm2024. It has 1 data disk and uses Premium_LRS storage for the OS disk, pointing to a performance-oriented workload. Resource profile created 24 Jul 2024 at 10:51 AM UTC.
What is it likely doing? — three findings are listed. First (Confirmed — Direct Azure config): Compute host for a confidential Windows VM — the VM is configured as ConfidentialVM with Windows Server 2019 Datacenter, secureBootEnabled, and vTpmEnabled turned on. Second (Observed — From metrics/logs): Likely serving a live application or batch workload — it averaged 0.49% CPU with sustained non-zero disk reads/writes and network in/out over the last 29 days. Third (Inferred): Part of a scale-set based deployment — the attached scale set name vmss3-confidential and the VM name pattern suggest an instance provisioned for a managed fleet rather than a one-off server.
Activity signals — last activity shows "just now" (last non-zero metric at 2026-08-05 06:00:00). Average requests/hour shows N/A (VMs are better judged by CPU, disk, and network usage). Orphan risk is Low — running and actively used; parent attachments are intact.
Resource-specific deep facts — VM size: Standard_DC2ads_v5 (INFO); OS disk type: Premium_LRS (INFO); number of data disks: 0 (INFO); operating system: Windows (INFO); region: eastus (INFO); hibernation: Disabled (INFO).
Connected resources — the VM (vmss3-confidential_19bb402e) is connected to three resources: a managed disk (vmss3-confidential_19bb402e_Os...), a network interface (VM2024-vnet-nic01-aab8403f), and a Virtual Machine Scale Set (vmss3-confidential).
In plain English (Business tab) — the agent translates the technical profile for non-technical readers. Under "What is it?", it describes the VM as a secure rented server in Microsoft's cloud — a dedicated office computer running in a Microsoft data centre in eastus, hardened for sensitive workloads and behaving like a protected machine rather than a shared utility. Under "What is it doing right now?", it states the server is on and has been doing real work, averaging about 0.49% CPU while also moving data to and from disk and the network — meaning it is not sitting empty but is processing something regularly, even if the load is light.
Who depends on it? — three dependency entries are listed. Platform owner / operations team (the VM is managed as part of the vmss3-confidential scale-set deployment, so it is likely owned by the team that runs that fleet). Workload running on the server (non-zero CPU, disk, and network activity over 29 days shows an active consumer of this machine). Resource group administrator (the only explicit ownership hint available is the vm2024 resource group context and the VM creation tag).
Troubleshooting
- Analyze resource purpose tab is not visible for a resource
Cause: The user's Custom role does not have the AI Agents feature permission enabled, or the Analysis feature is not toggled on for the role.
Fix: Go to User management > Roles, edit the relevant Custom role, and enable the AI Agents toggle and the Analysis permission under Specify feature permissions. - Activity signals show no last activity data
Cause: The resource may not have emitted any metrics or activity logs within the observable window, or diagnostic settings may not be configured.
Fix: Check whether diagnostic settings are enabled for the resource in the Azure portal. Without activity logs, the agent can only rely on configuration-level signals. - Dependency list appears incomplete or empty
Cause: Dependencies are inferred from tags, configuration, and observable platform signals. Resources with no tags and no detectable integration patterns may show a limited dependency view.
Fix: Review and apply meaningful resource tags in Azure, and verify integration configurations to improve the accuracy of dependency inference.
FAQs
- How does the agent determine whether a resource is Confirmed, Observed, or Inferred?
Confirmed means the evidence is explicit — for example, a tag or a documented configuration. Observed means usage or activity data supports the conclusion. Inferred means the function is deduced from resource type and configuration alone, with no direct evidence. - Can Analyze resource purpose be used to safely decommission a resource?
It provides supporting evidence, but it should not be the sole basis for decommissioning. Always validate dependency findings against your own infrastructure documentation before removing any resource. - Does the agent apply any changes to the resource automatically?
No. It provides analysis only; all actions are taken manually.
Related articles
Was this article helpful?