

Analyzing Azure costs
- 05 Aug 2026
- 3 Minutes to read
- Print
- DarkLight
- Download PDF
Analyzing Azure costs
- Updated on 05 Aug 2026
- 3 Minutes to read
- Print
- DarkLight
- Download PDF
Article summary
Did you find this summary helpful?
Thank you for your feedback!
Overview
The Analysis section in Cost Analyzer is a saved configuration of filters, groupings, and chart settings used to visualize Azure subscription costs. Each view is scoped to a cost management group and can be saved for ongoing monitoring and reporting.
Business value
- Revisit commonly used cost breakdowns without reconfiguring filters each time
- Share consistent cost views across teams within the same cost management group
- Combine multiple filters and groupings for targeted, multi-dimensional cost insights
How it works
Views
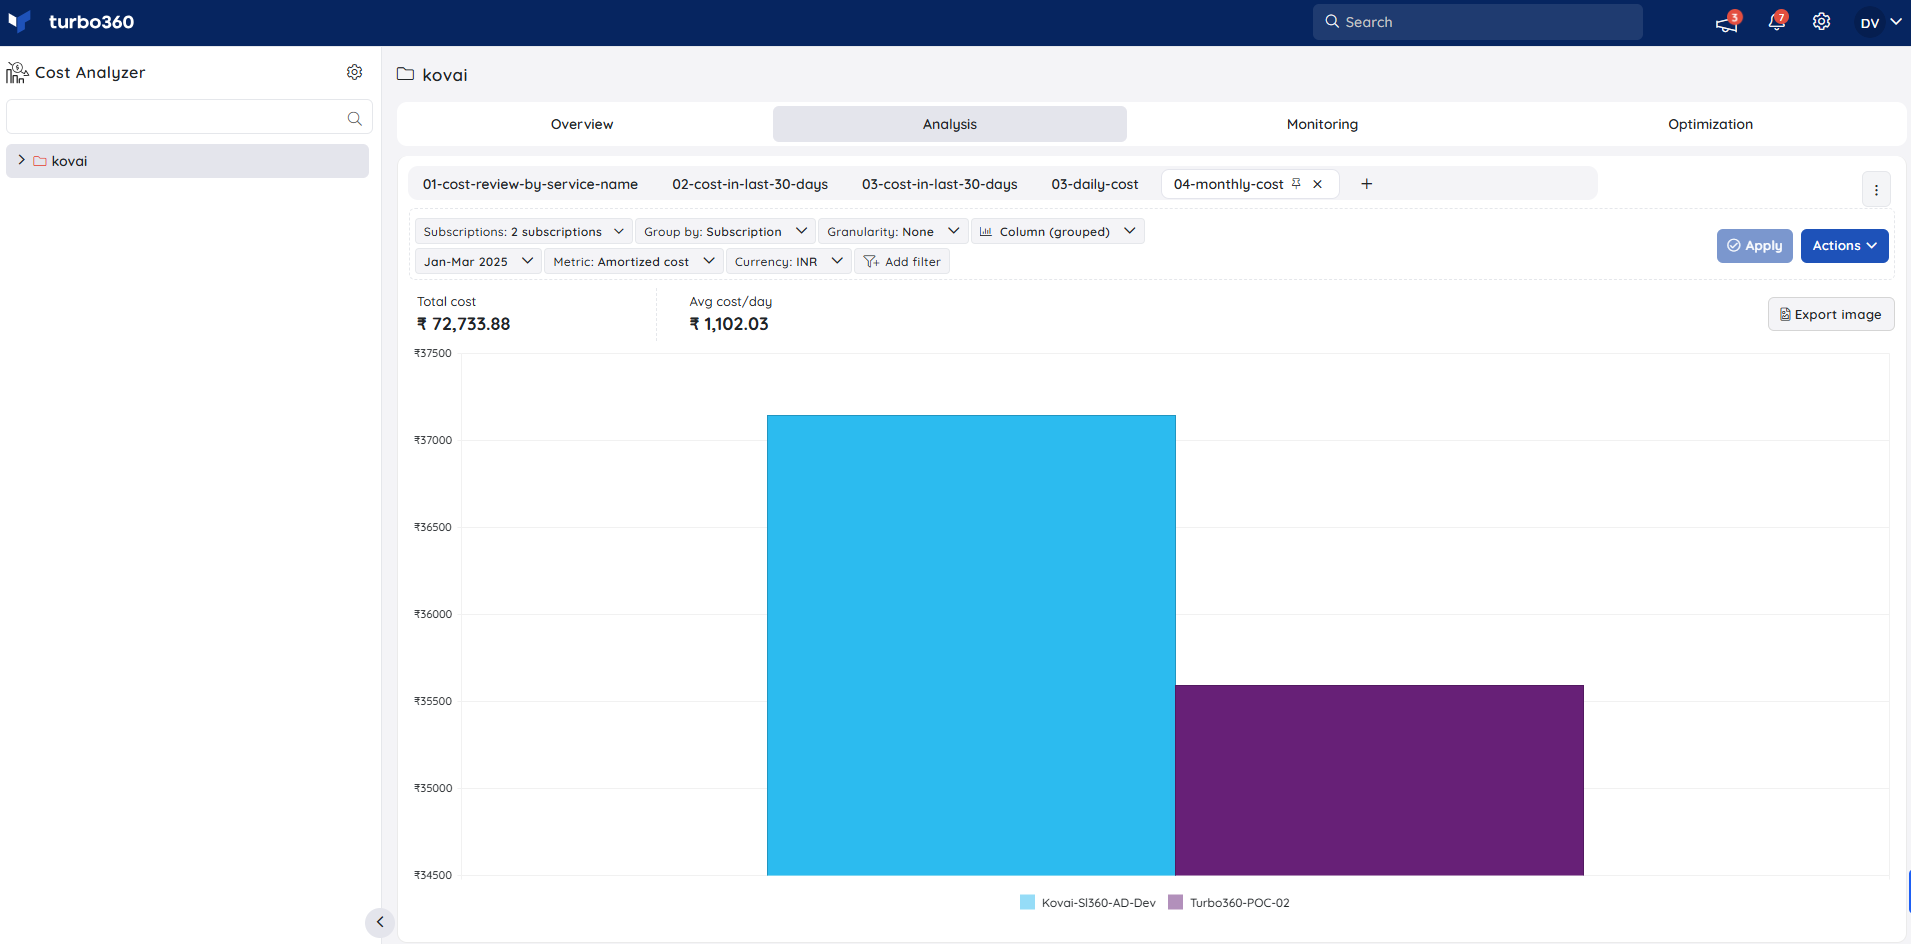
A view defines how cost data is displayed — which subscriptions, time interval, grouping, and chart type. Views are saved under a cost management group and accessible from the left panel. Each view shows total cost and daily average cost for the selected subscriptions.
Filters
Every analysis view is shaped by a set of built-in filters:
| Filter | Purpose |
|---|---|
| Subscriptions | Select which Azure subscriptions to include |
| Time interval | Choose a preset or custom date range (max 1 year) |
| Granularity | Accumulated, Daily, Monthly, or None |
| Currency | Select the display currency for cost data |
| Group by | Break down costs by a cost dimension (see below) |
| Metric | Actual cost or Amortized cost |
.jpg)
Cost dimensions
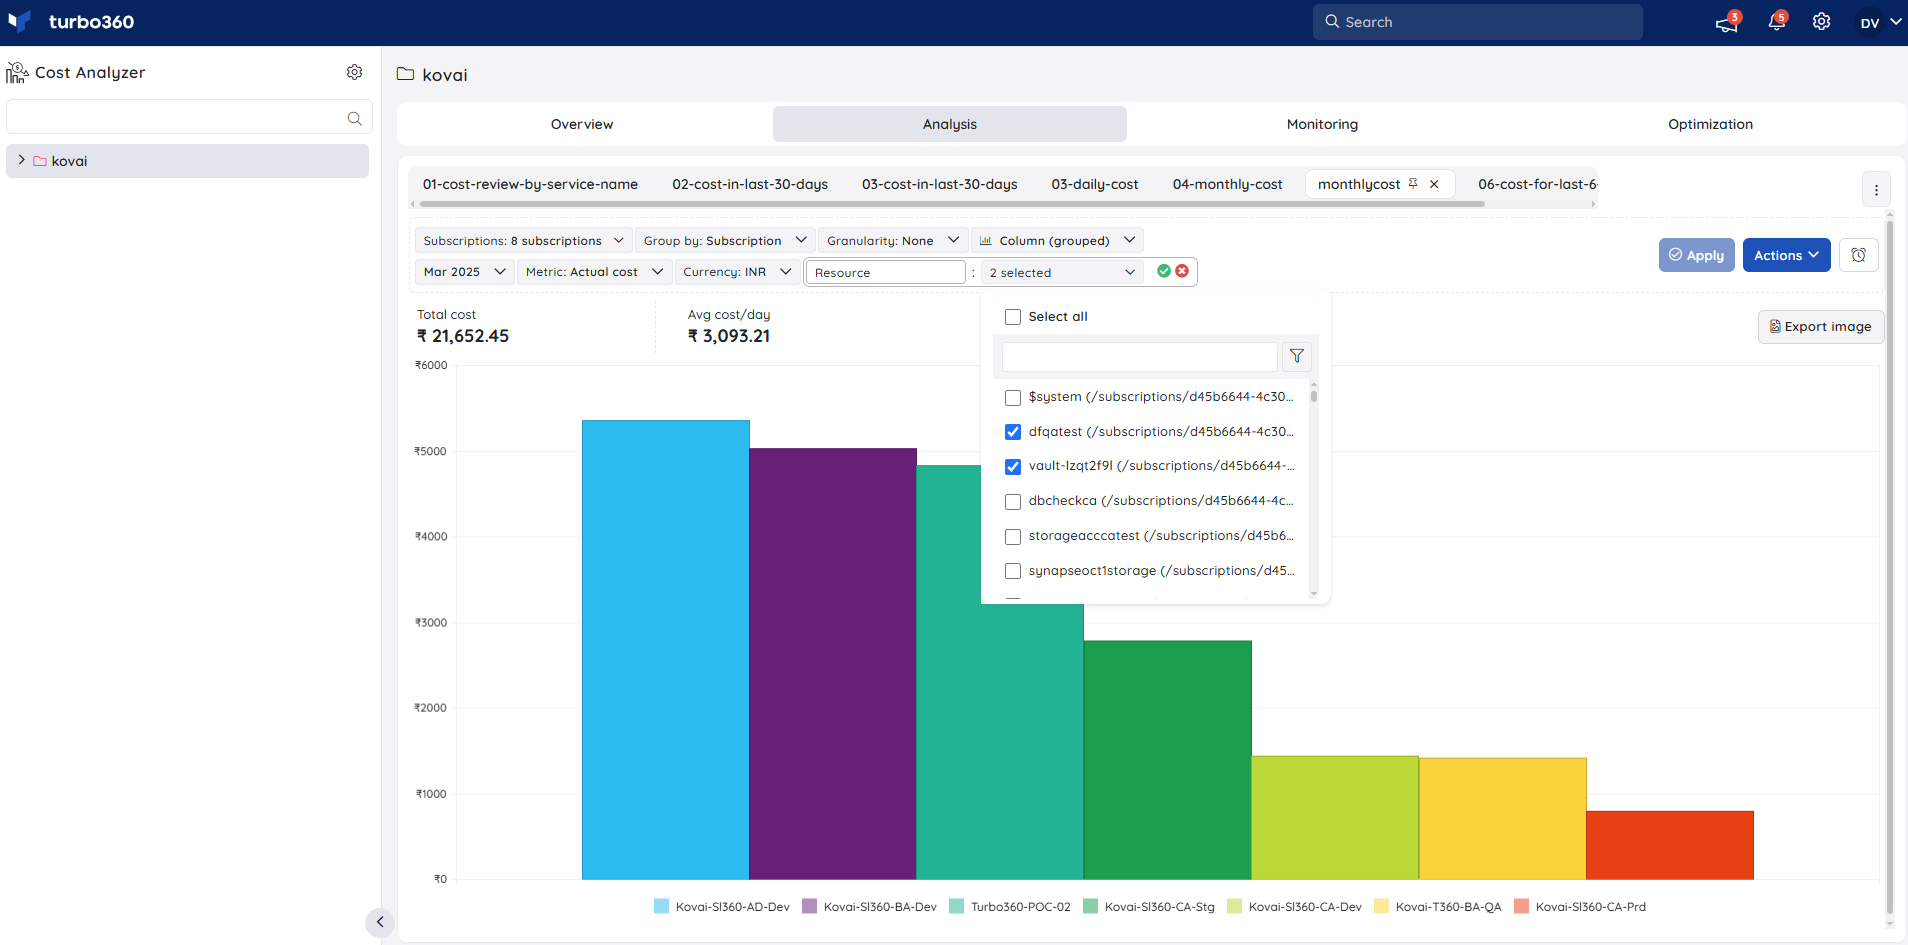
Cost dimensions are the attributes used in Group by and Filter options to slice cost data into meaningful segments. They are sourced directly from Azure Cost Management for your connected subscriptions.
Resource dimensions
| Dimension | Description |
|---|---|
| Resource | Individual Azure resource — e.g. a specific VM or storage account |
| Resource group | The resource group containing the resource |
| Resource type | The type of Azure resource — e.g. microsoft.compute/virtualmachines |
| Subscription | The Azure subscription the resource belongs to |
| Location | The Azure region where the resource is deployed |
Service and billing dimensions
| Dimension | Description |
|---|---|
| Service name | The Azure service — e.g. Virtual Machines, Storage, SQL Database |
| Meter | The specific billing meter used to measure usage |
| Meter subcategory | A more granular classification within a meter |
| Pricing model | On-Demand, Reservation, or Savings Plan |
| Charge type | Usage, purchase, refund, or adjustment |
| Reservation | Costs associated with Azure Reservations |
| Benefit | Applied Azure benefits — e.g. Hybrid Benefits, Savings Plans |
| Publisher name | Microsoft or a third-party Marketplace vendor |
| Publisher type | Microsoft or Marketplace |

Tag dimensions
Tags are key-value pairs applied to Azure resources. Use tag dimensions to group or filter costs by any tag — such as environment, team, or cost-center. Selecting Untagged surfaces costs for resources with no tags applied.
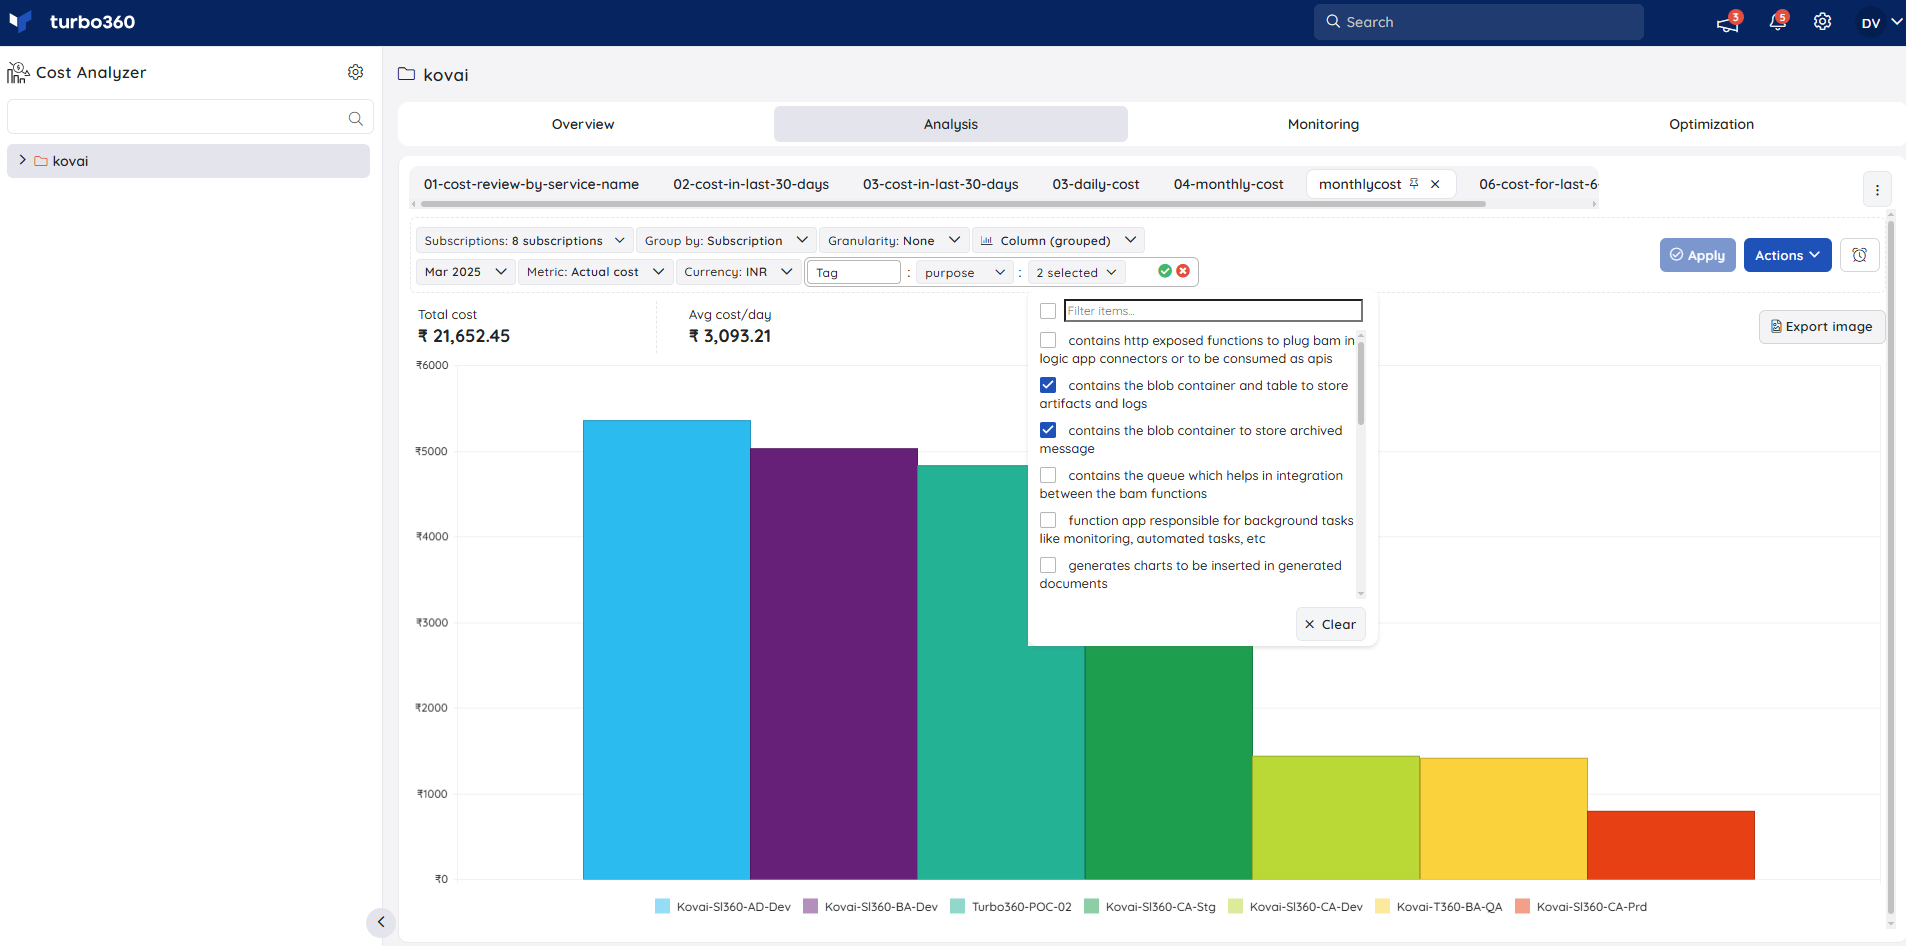
Chart types
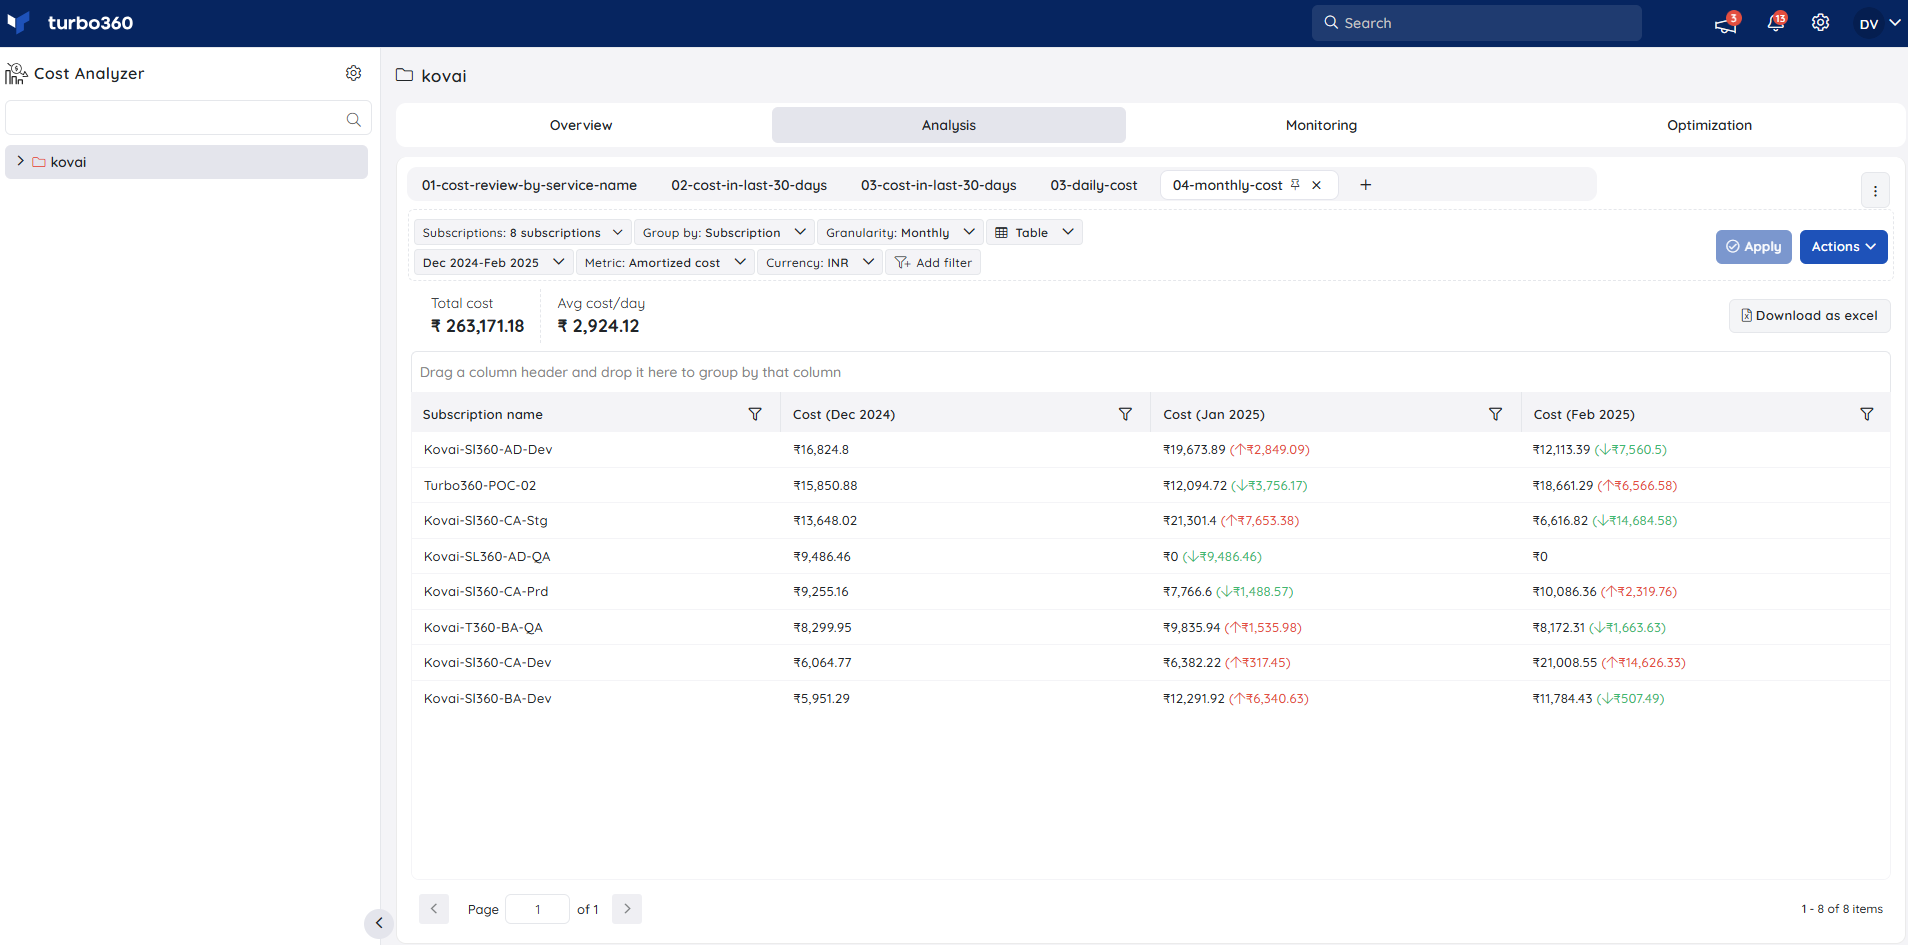
Five chart types are supported: Area, Column (stacked), Column (grouped), Line, Bar(stacked), Bar(grouped) and Table. The Area chart is unavailable when Granularity is set to None.
When the chart is Table, the Include columns option adds applied filter types as extra columns for multi-dimensional visibility.
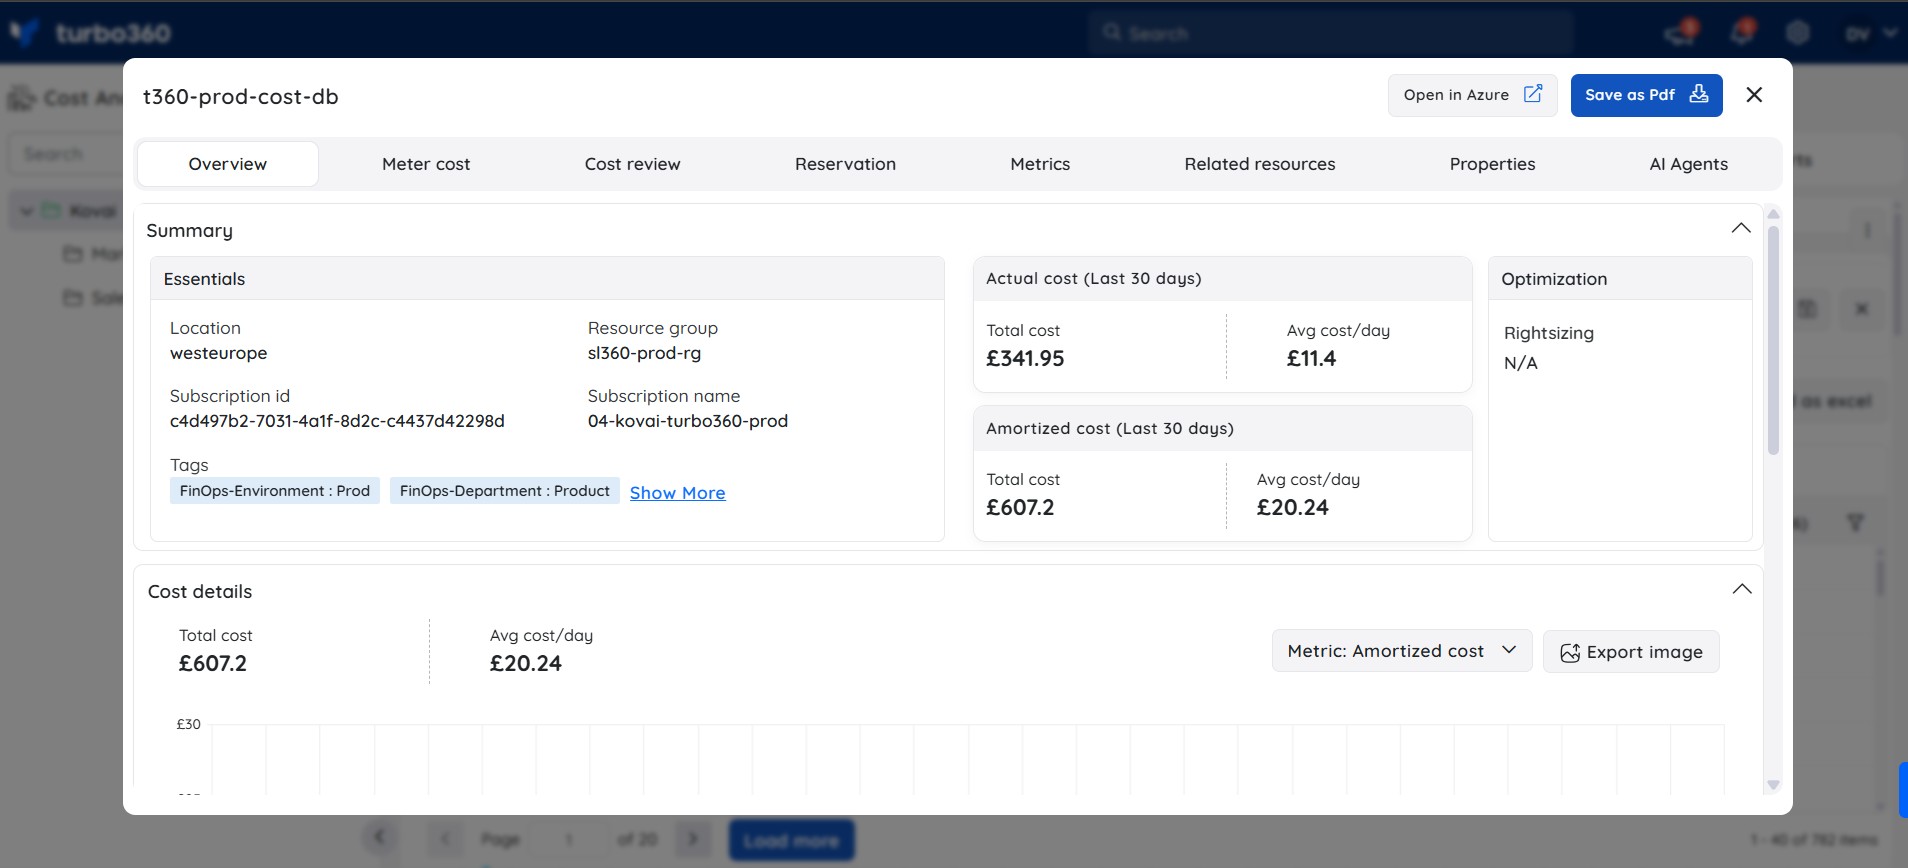
Cost intelligence view
Provides a detailed, resource-level analysis of Azure costs. It combines cost distribution with optimization insights, including rightsizing recommendations, reservation opportunities, related resources, cost review, and AI-powered recommendations.
Available when Group by is set to Resource and the chart type is Table. Select a resource row to open the view.
Forecasting
Estimates future spend based on current resource and service usage. Available for time intervals that include today or a future date, with any granularity other than None and any chart type other than Table. Purchases are excluded from forecasts; usage changes may take up to one week to reflect.
.gif)
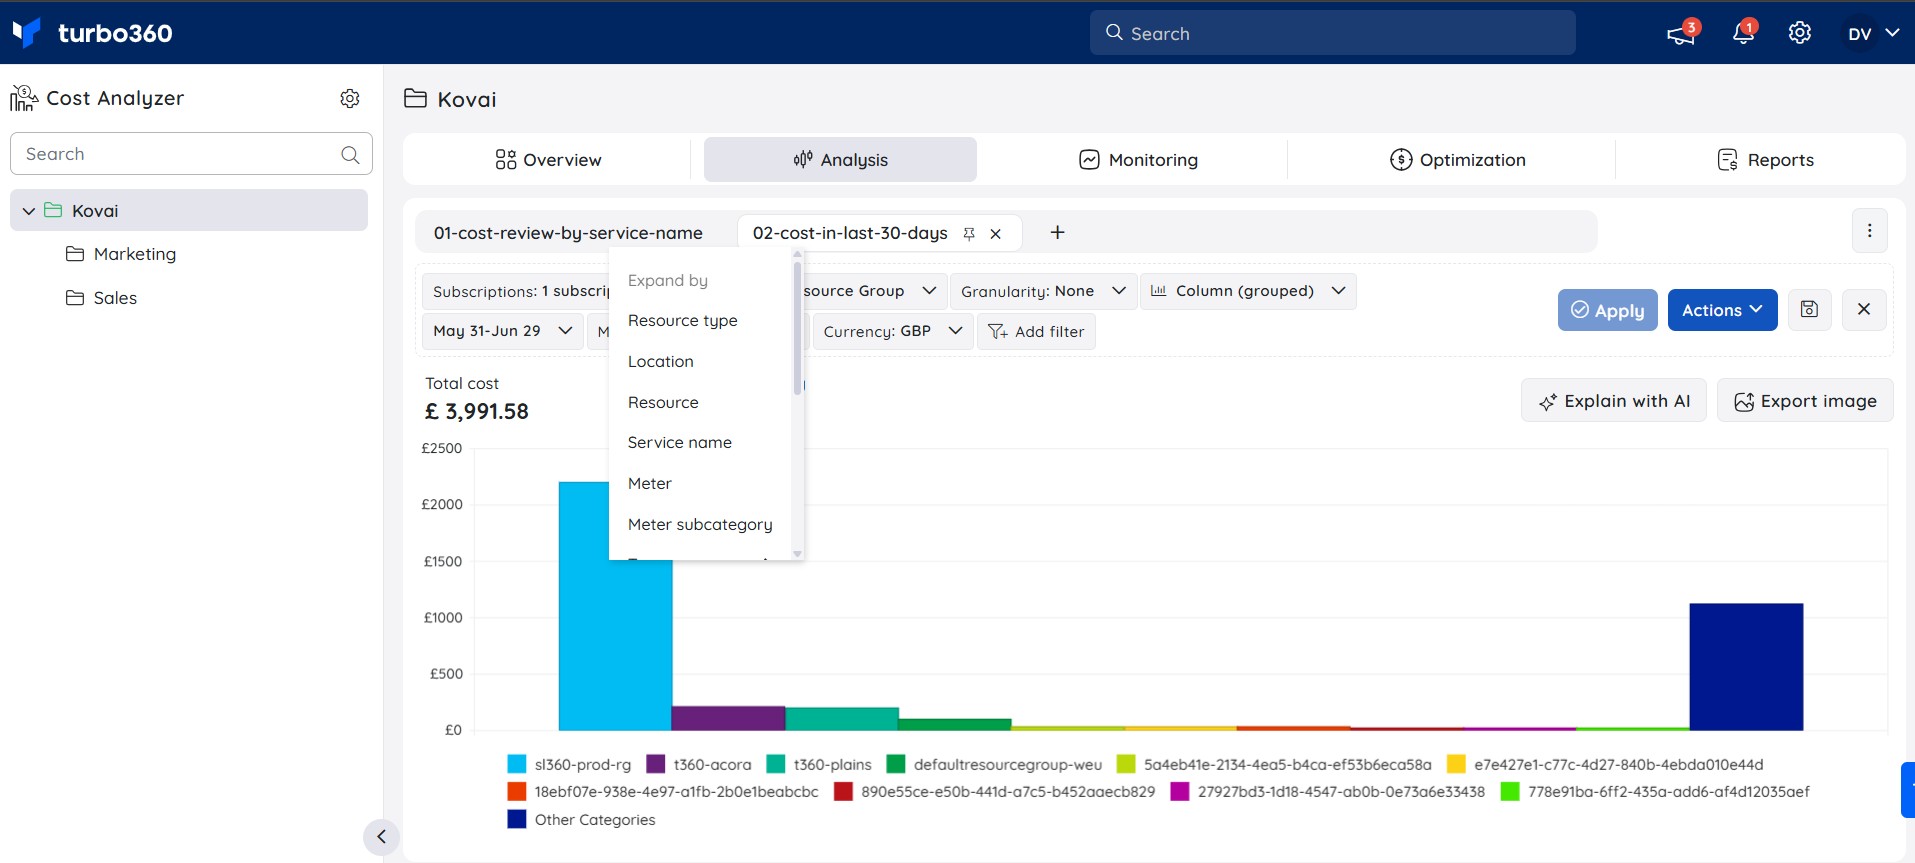
Expand cost
Click any chart data point to drill into that category for a filtered breakdown. Click further data points to continue drilling down.
FAQs
How is an analysis view different from a cost management group?
A cost management group defines what cost data is included by specifying the Azure subscriptions to analyze. An Analysis view defines how that cost data is presented, allowing you to customize filters, groupings, chart types, and time intervals without changing the underlying cost management group.What is the Cost intelligence view?
Cost intelligence view is a resource-level analysis view that can be accessed by selecting a resource when an Analysis view is displayed in Table view. It enriches cost data with actionable insights, including rightsizing recommendations, reservation opportunities, related resource information, and AI-powered insights to help optimize Azure costs.How do I refresh stale cost data?
Go to Actions > Reset cached data within the saved view. Cost Analyzer also performs a daily automatic cache reset.
Related articles
Was this article helpful?