

API App
- 05 Aug 2026
- 5 Minutes to read
- Print
- DarkLight
- Download PDF
API App
- Updated on 05 Aug 2026
- 5 Minutes to read
- Print
- DarkLight
- Download PDF
Article summary
Did you find this summary helpful?
Thank you for your feedback!
Overview
Azure API Apps provide a platform for building, hosting, and deploying APIs for both cloud and on-premises infrastructure. Within Turbo360's Business Applications module, API App resources are monitored and managed alongside other Azure resources in your business application.
Business value
Monitoring API App resources in Turbo360 gives you visibility into API availability and performance without switching between the Azure portal and your operational tooling. You can detect degradation, track usage metrics, and respond to state changes from a single interface.
How it works
Turbo360 surfaces API App resources within the Business Applications module. For each API App resource, you can perform lifecycle operations (Start, Stop, Restart), view a pre-built resource dashboard, and configure monitoring rules for availability, state, and custom metrics.
Monitoring rules are evaluated on every monitoring cycle. When a threshold is met, the monitoring state for that metric updates accordingly.
Permissions
Access to API App resources is controlled by the API App resource permission in your Business Applications role.
| Permission | Access granted |
|---|---|
| Read | View the API App resource, resource dashboard, and monitoring state |
| Manage | Perform Start, Stop, and Restart operations; configure monitoring rules |
The following system-defined roles include API App permissions by default:
| Role | API App permission |
|---|---|
| Owner | Read + Manage |
| Contributor | Read + Manage |
| Reader | Read |
Operations
Turbo360 lets you control the running state of API App resources directly from within your Business Application, without switching to the Azure portal. Use these operations to respond to incidents, perform planned maintenance, or recover a stopped app.
Start, Stop, and Restart
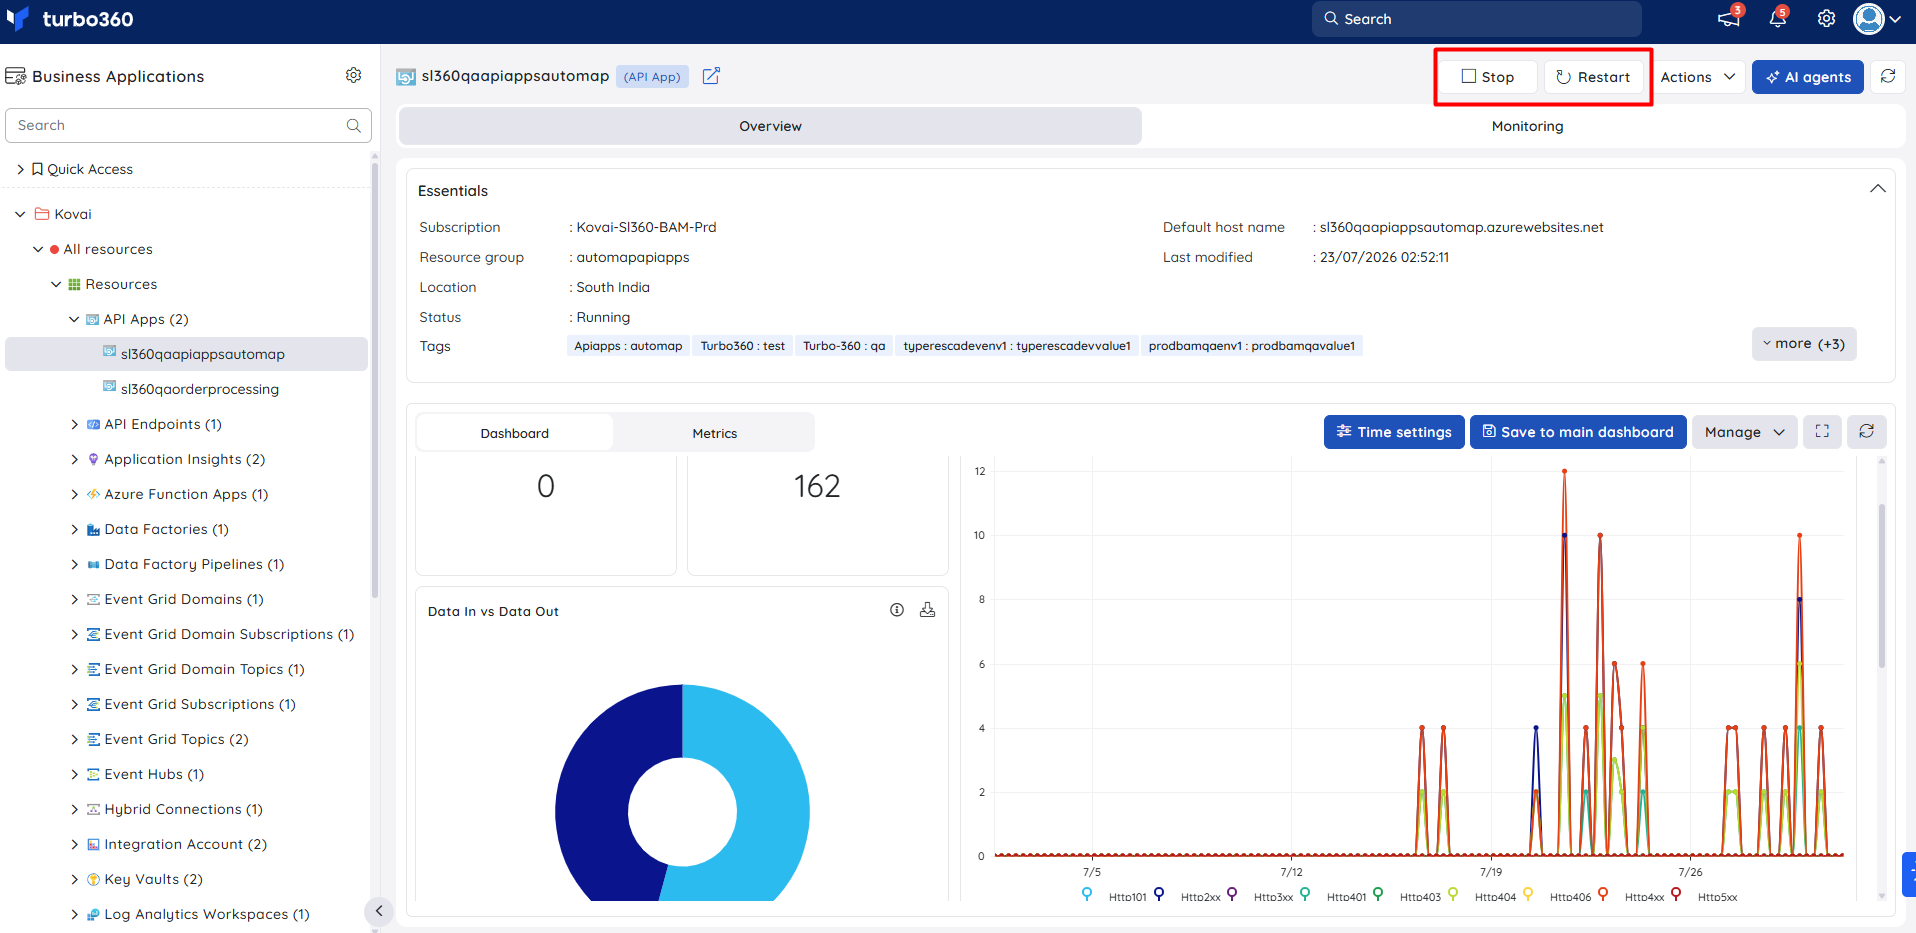
- Start — brings a stopped API App back into service. Use this after maintenance or when recovering from an unexpected stop.
- Stop — gracefully shuts down the API App. Use this for planned maintenance windows or when isolating a misbehaving app.
- Restart — stops and immediately restarts the app. Use this to clear transient errors, apply configuration changes, or recover from a hung state without manually stopping and starting.
- Navigate to the API App resource in your business application.
- Click Start, Stop, or Restart as required.
Bulk operations
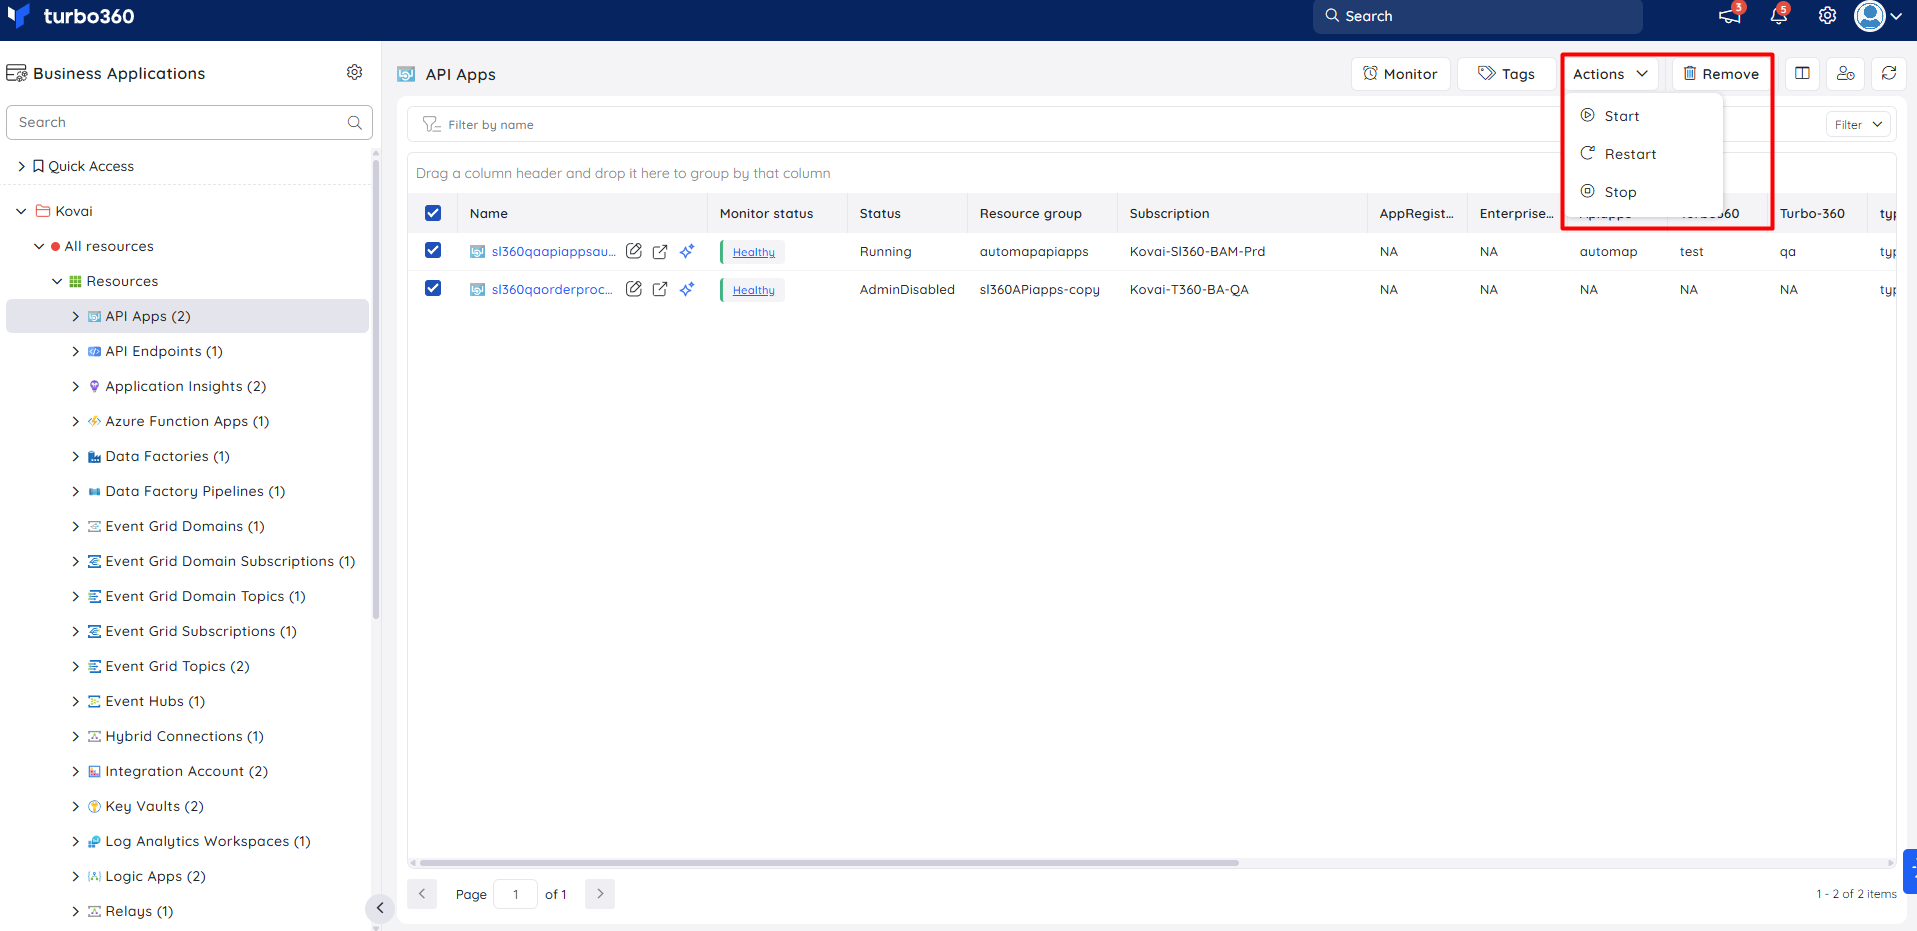
When you need to apply the same operation across multiple API App resources simultaneously — for example, restarting all API Apps in a business application after a configuration change — you can act on them in a single step from the resource section.
- Go to the API App resource section.
- Select the API App resources you want to act on.
- Choose the desired operation from the Actions dropdown
Resource dashboard
The API App resource dashboard gives you a real-time view of connection activity, request throughput, error rates, and I/O behaviour — the key signals for assessing whether an API App is healthy and performing within expected bounds.
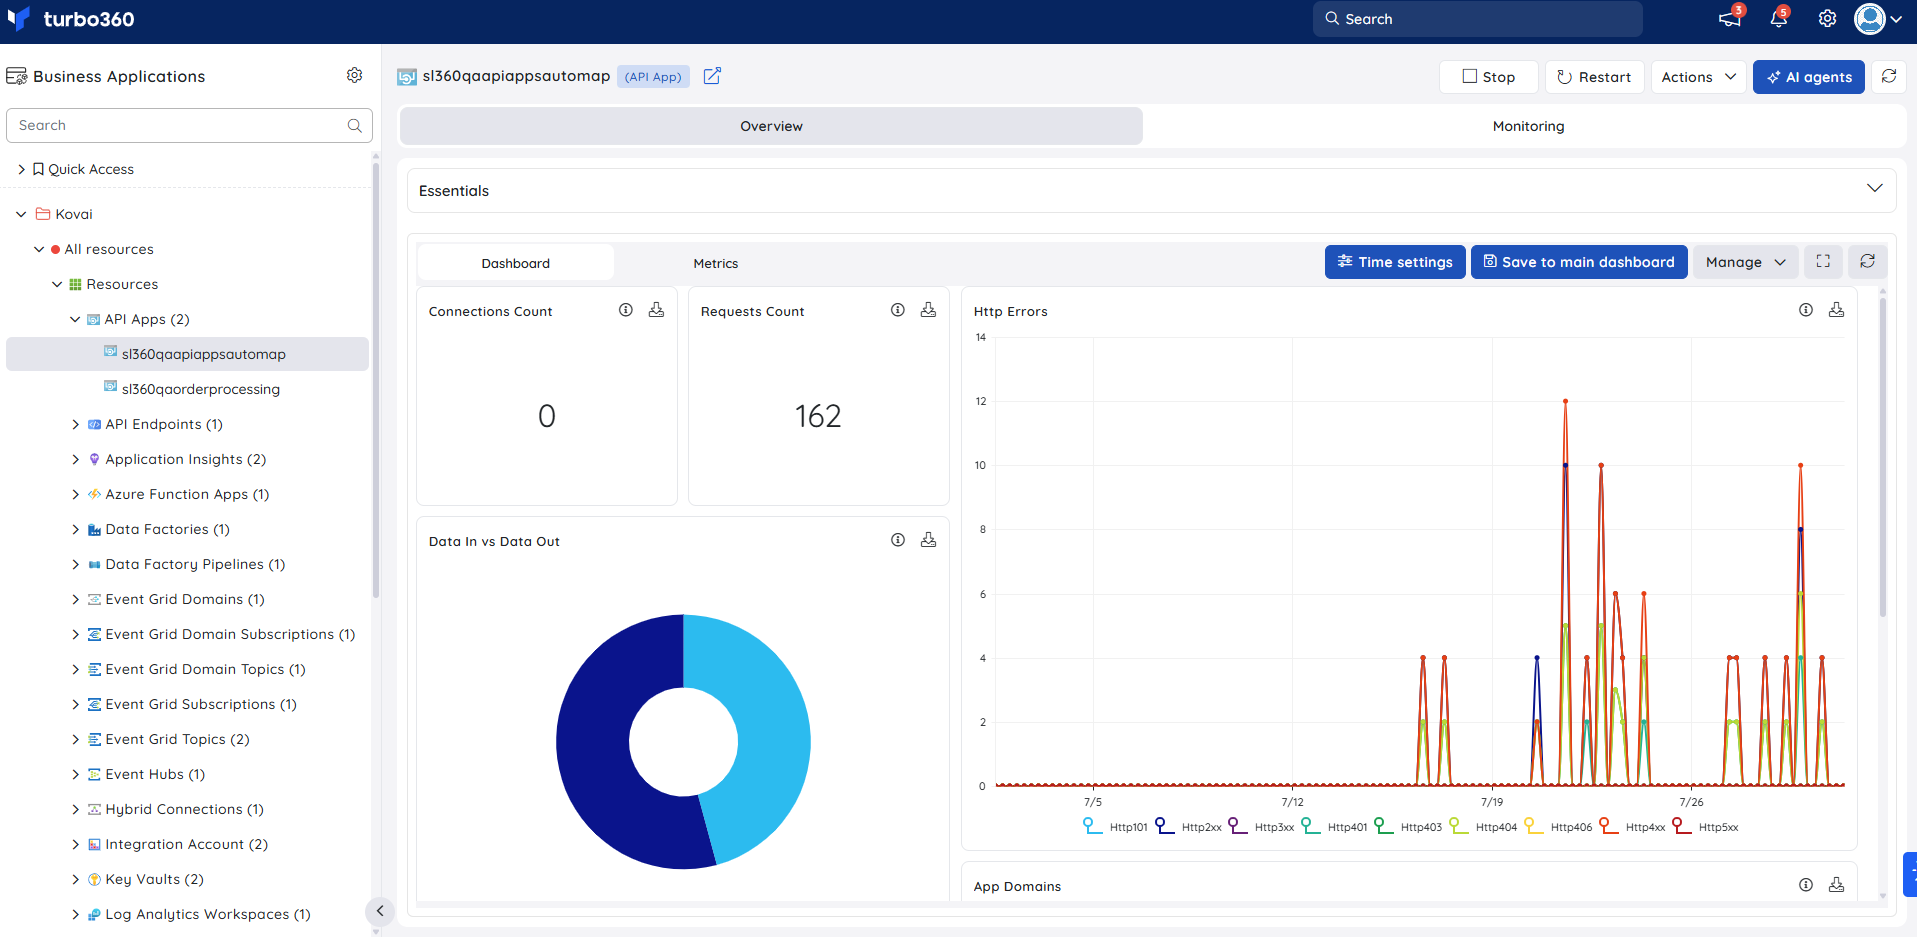
The following widgets are available by default:
| Widget | What it shows |
|---|---|
| Connections Count | Number of active connections to the API App at the current point in time |
| Requests Count | Total number of HTTP requests received by the API App |
| Http Errors | Count of HTTP error responses (4xx and 5xx) returned by the API App |
| Data In vs Data Out | Volume of inbound and outbound data traffic, useful for detecting unusual payload sizes or transfer spikes |
| App Domains | Number of application domains loaded in the API App process |
| IO Read vs IO Write | Rate of read and write I/O operations, useful for identifying disk-intensive workloads or storage bottlenecks |
You can add, remove, or reconfigure widgets to focus on the metrics most relevant to your support scenario.
Metrics
The Metrics tab lets you chart any Azure metric for your API App directly in Turbo360, without switching to the Azure portal. Use it to investigate request volume trends, HTTP error spikes, and response latency patterns over a custom time window — particularly useful when correlating performance changes with deployments or traffic events.
Use the following controls to build your chart:
| Control | Description |
|---|---|
| Select metric | Choose the Azure metric to visualize (e.g. Requests, Http Errors, Response Time, Data In, Data Out). |
| Aggregation | Set the aggregation method: Average, Min, Max, Total, or Count. |
| Time range | Set the time window for the data (e.g. Last 24 hours, Last 7 days). |
| Granularity | Set the data point resolution (e.g. 1 minute, 1 hour). |
| Chart type | Choose the visualization type: Line or Bar. |
Click Apply to render the chart.
.png)
Monitoring
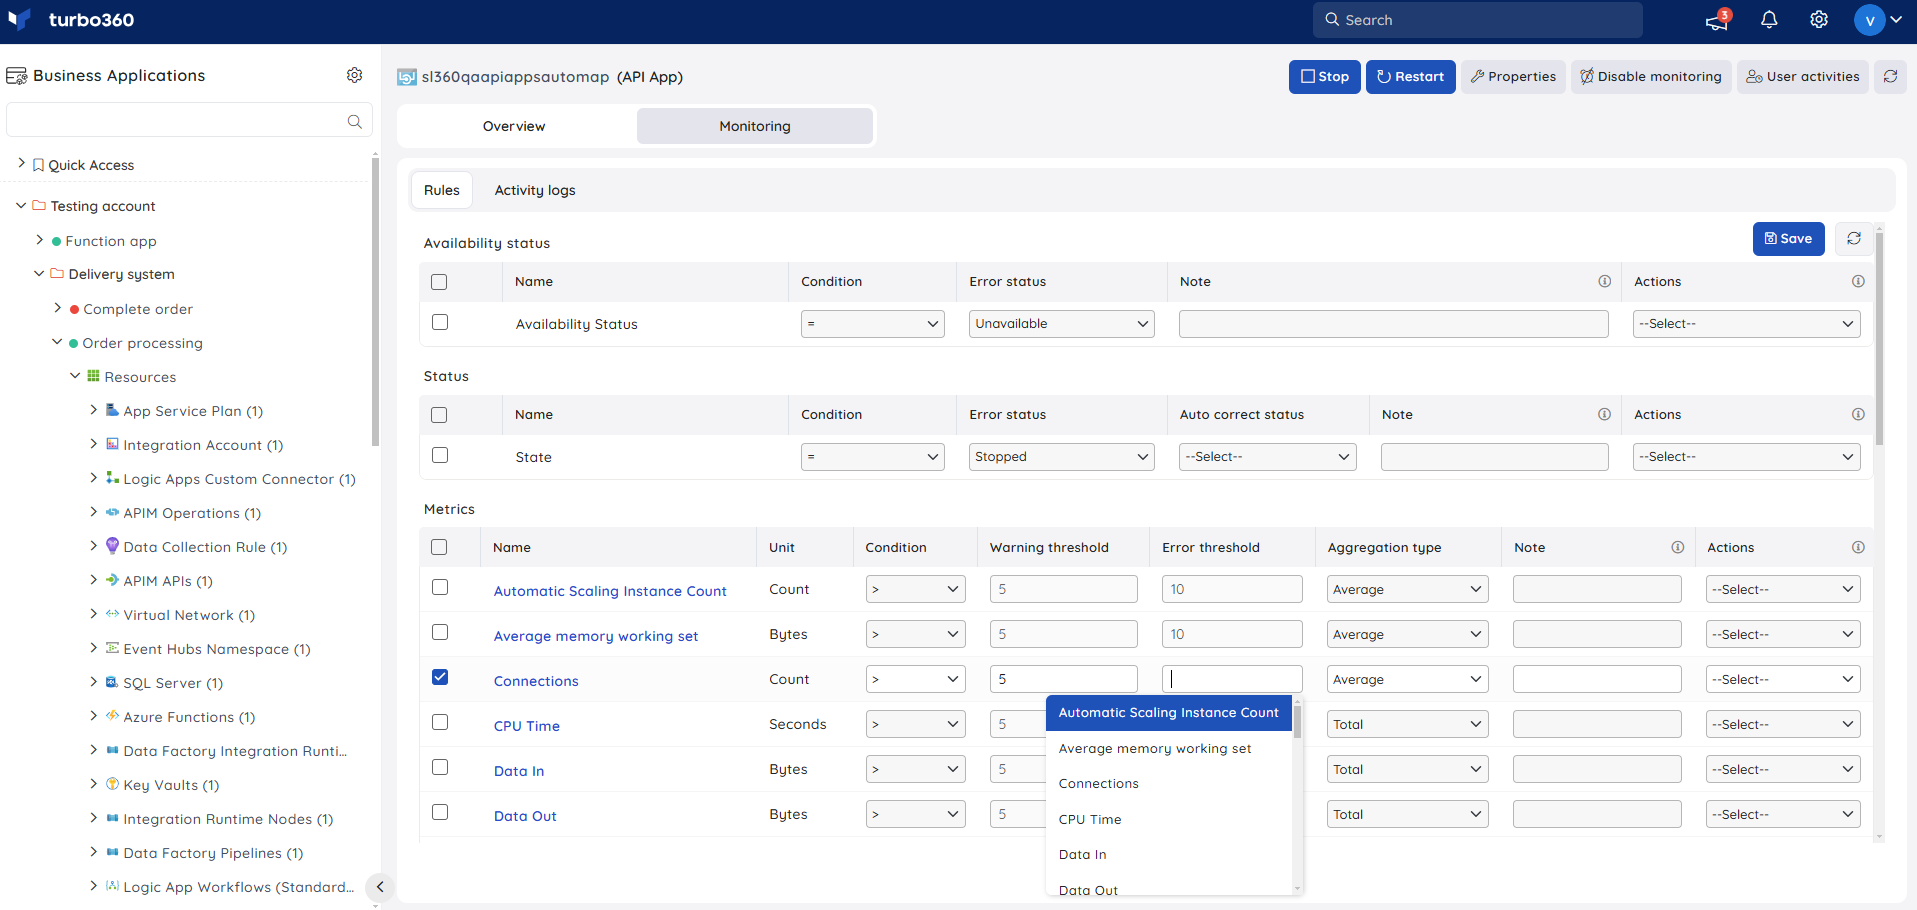
API App supports availability status, state, and metric monitoring rules. Navigate to API App > Monitoring to configure rules.
Note:
Monitoring rules are saved per API App. The monitoring state updates after every monitoring cycle.
Availability status monitoring
Availability status monitoring tracks the resource health reported by Azure for your API App. Use this rule to get alerted when the API App becomes degraded or unavailable — for example, when an underlying platform issue takes the app out of service before your users report errors.
- Configure the Availability status rule with the desired threshold.
- Click Save.
State monitoring
State monitoring tracks the current running state of your API App (Running, Stopped, and so on). Use this rule to detect when an API App has been stopped unexpectedly — for example, after a deployment or an accidental manual stop — so you can restart it before downstream consumers are affected.
- Configure the State rule under the Status category with the desired threshold.
- Click Save.
Metric monitoring
Metric monitoring lets you track specific Azure performance metrics for your API App, such as request counts, HTTP error rates, and data throughput. Use metric rules to catch gradual degradation — for example, alert when HTTP errors exceed a threshold over a sustained period, indicating a backend issue that availability status alone would not surface.
- Select the monitoring metrics you want to track and configure the threshold values.
- Click Save.
You can provide a threshold value for any metric name. The rule triggers when the metric value meets the configured threshold.
Troubleshooting
Start, Stop, or Restart operation does not complete
Cause: The underlying Azure App Service may already be in a transitional state, or the user does not have the Manage permission for API App.
Fix: Wait for the current state transition to finish before retrying, and confirm the user's Turbo360 role includes Manage for API App.Monitoring rule not triggering as expected
Cause: The threshold may be configured incorrectly, or a monitoring cycle has not yet completed.
Fix: Verify the threshold under API App > Monitoring and wait for the next monitoring cycle for the state to update.Resource dashboard widgets not loading
Cause: The API App resource may not be associated with the Business Application, or the user does not have the Read permission for API App.
Fix: Confirm the API App is added to your Business Application and that the user's role includes at least Read for API App.Bulk operation applies to only some of the selected resources
Cause: One or more selected API App resources may already be in a state that does not support the requested operation — for example, attempting to stop an app that is already stopped.
Fix: Check the current state of each resource before running a bulk operation, and retry the operation individually for any resource that did not complete.
Related articles
Was this article helpful?