

API Management resources
- 05 Aug 2026
- 15 Minutes to read
- Print
- DarkLight
- Download PDF
API Management resources
- Updated on 05 Aug 2026
- 15 Minutes to read
- Print
- DarkLight
- Download PDF
Article summary
Did you find this summary helpful?
Thank you for your feedback!
Overview
Azure API Management (APIM) is a fully managed platform for publishing, securing, and analyzing APIs. Within Turbo360's Business Applications module, APIM resources — including APIM APIs, APIM Operations, APIM Products, and APIM Services — are available for monitoring and management alongside other Azure resources in your business application.
Business value
Monitoring APIM resources in Turbo360 lets you track API performance, detect reliability issues, and respond to threshold violations across your API management layer without leaving your operational tooling. Dashboard widgets and monitoring rules give you continuous visibility into request success rates, response times, and error patterns.
How it works
Turbo360 surfaces four APIM resource types within the Business Applications module:
- APIM API — represents a set of operations available to developers, backed by a backend service
- APIM Operation — corresponds to individual backend operations, with customizable URL mapping, parameter handling, caching, and policy enforcement
- APIM Product — groups one or more APIs with access controls; products can be open or subscription-protected
- APIM Service — the top-level APIM instance used to publish APIs to internal, partner, and external developers
Each resource type has a pre-built resource dashboard and supports metric and query monitoring rules. Monitoring rules are evaluated on every monitoring cycle; threshold violations update the monitoring state for the affected metric.
For APIM API, APIM Operation, and APIM Service resources, dashboard widgets can use either metric or query data. Any Application Insights resource can be connected to generate query data for dashboard visualization.
Permissions
Access to APIM resources is controlled by individual resource permissions in your Business Applications role. Each APIM resource type has its own permission entry.
| Resource | Permission | Access granted |
|---|---|---|
| APIM API | Read | View the resource, resource dashboard, and monitoring state |
| APIM API | Manage | Configure monitoring rules |
| APIM Operation | Read | View the resource, resource dashboard, and monitoring state |
| APIM Operation | Manage | Configure monitoring rules |
| APIM Product | Read | View the resource and resource dashboard |
| APIM Product | Manage | Publish and unpublish products; configure monitoring rules |
| APIM Service | Read | View the resource, resource dashboard, and monitoring state |
| APIM Service | Manage | Configure monitoring rules |
The following system-defined roles include these permissions by default:
| Role | Access |
|---|---|
| Owner | Read + Manage on all resource types |
| Contributor | Read + Manage on all resource types |
| Reader | Read on all resource types |
APIM API
Resource dashboard
The APIM API resource dashboard gives you a real-time view of request success rates, error patterns, response times, and cache behaviour — the key signals for assessing the health and performance of an individual API.
The following widgets are available by default and can be customized to meet your needs:
| Widget | What it shows |
|---|---|
| Unauthorized Requests | Count of requests rejected due to missing or invalid credentials — useful for detecting authentication failures or misconfigured subscription keys |
| Data Transfer | Total volume of data transferred in and out of the API |
| Success Requests | Count of requests that completed successfully (2xx responses) |
| Failed Requests | Count of requests that returned an error response (4xx or 5xx) |
| Request Summary | Aggregate breakdown of total, successful, and failed request counts |
| Response Time Summary | Average, minimum, and maximum end-to-end response times for the API |
| Service Time Summary | Time spent processing requests within the backend service, excluding gateway overhead |
| Response Time Maximum vs Minimum | Comparison of peak and floor response times, useful for identifying latency variability |
| Cache Hit vs Miss | Ratio of requests served from the gateway cache versus forwarded to the backend — useful for evaluating cache policy effectiveness |
| Request Success vs Failure | Side-by-side comparison of successful and failed request volumes over time |
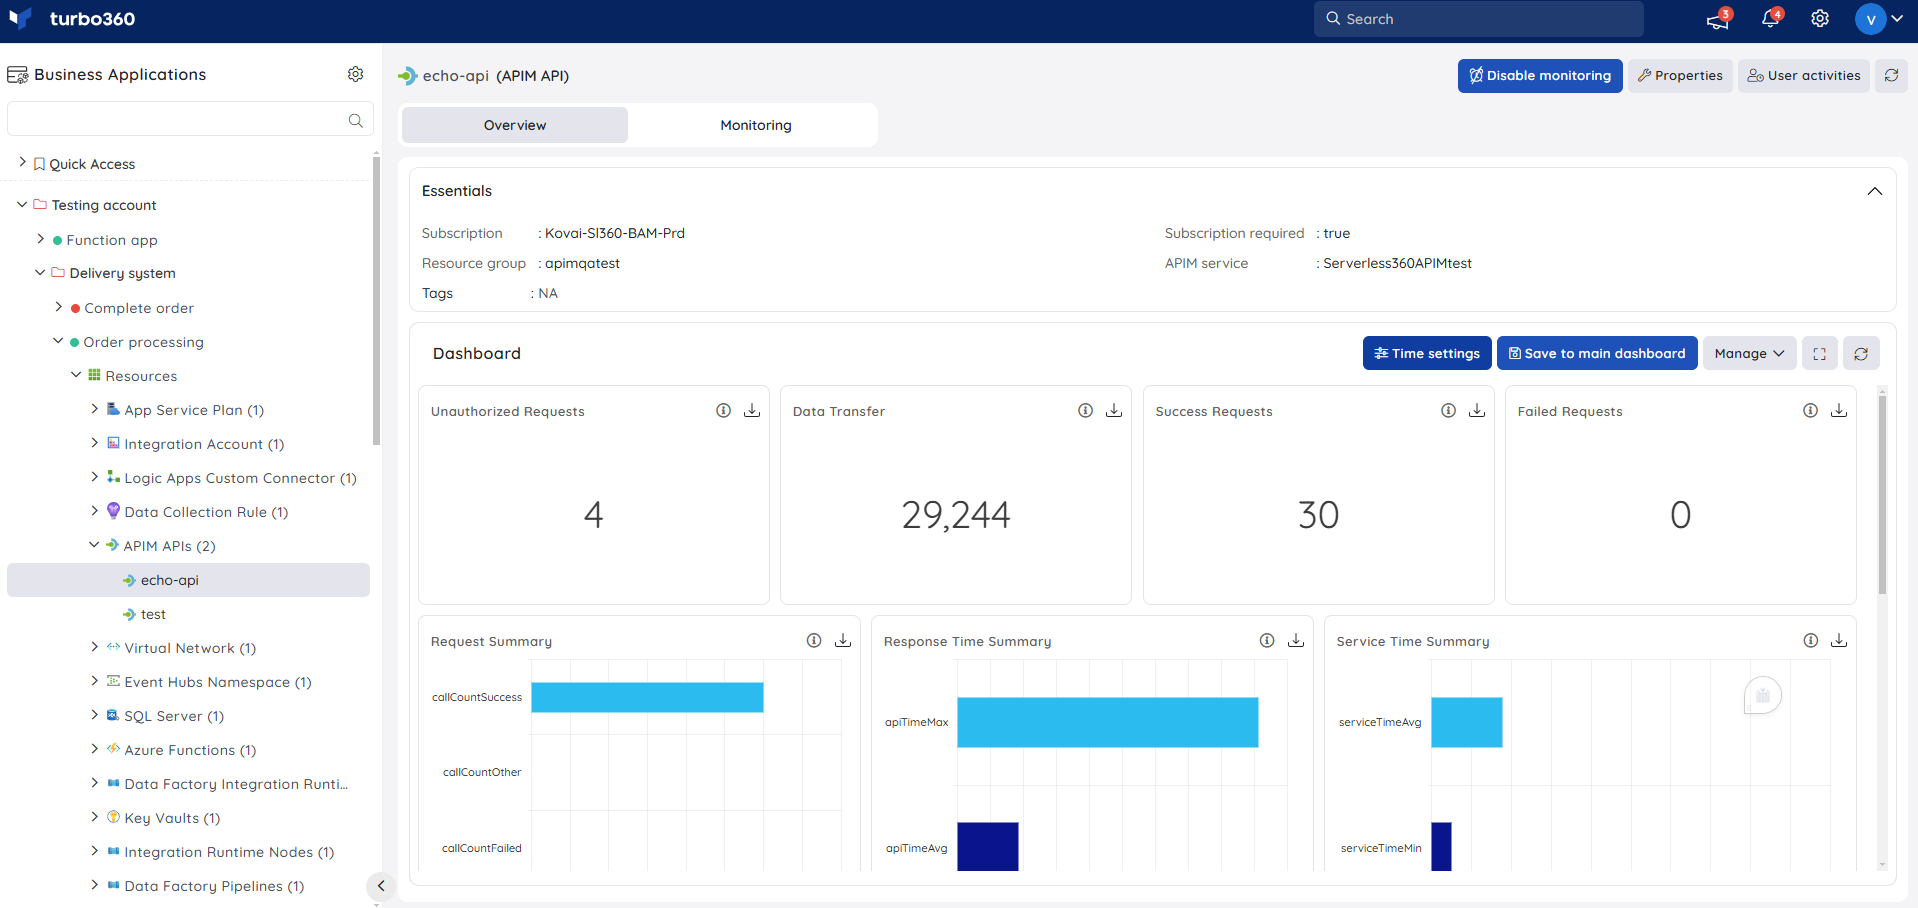
The data source for widgets can be query or metric data for chart types other than Count. A set of default queries is available for query-based widgets using the associated Application Insights resource.
Note:
Any Application Insights resource can be used to generate query data for data visualization in the APIM API resource dashboard.
You can add, remove, or reconfigure widgets to focus on the metrics most relevant to your support scenario.
Metrics
The Metrics tab lets you chart any Azure metric for your APIM API directly in Turbo360, without switching to the Azure portal. Use it to visualize gateway throughput, backend latency trends, and cache hit ratios over time — particularly useful when investigating whether a performance issue originates at the gateway or in the backend service.
Use the following controls to build your chart:
| Control | Description |
|---|---|
| Select metric | Choose the Azure metric to visualize (e.g. Requests, Failed Requests, Duration, Cache Hit Count, Cache Miss Count). |
| Aggregation | Set the aggregation method: Average, Min, Max, Total, or Count. |
| Time range | Set the time window for the data (e.g. Last 24 hours, Last 7 days). |
| Granularity | Set the data point resolution (e.g. 1 minute, 1 hour). |
| Chart type | Choose the visualization type: Line or Bar. |
Click Apply to render the chart.
Monitoring
APIM API supports metric and query monitoring rules. Navigate to APIM API > Monitoring to configure rules.
Note:
Monitoring rules are saved for APIM API. The monitoring state updates after every monitoring cycle.
Metric monitoring
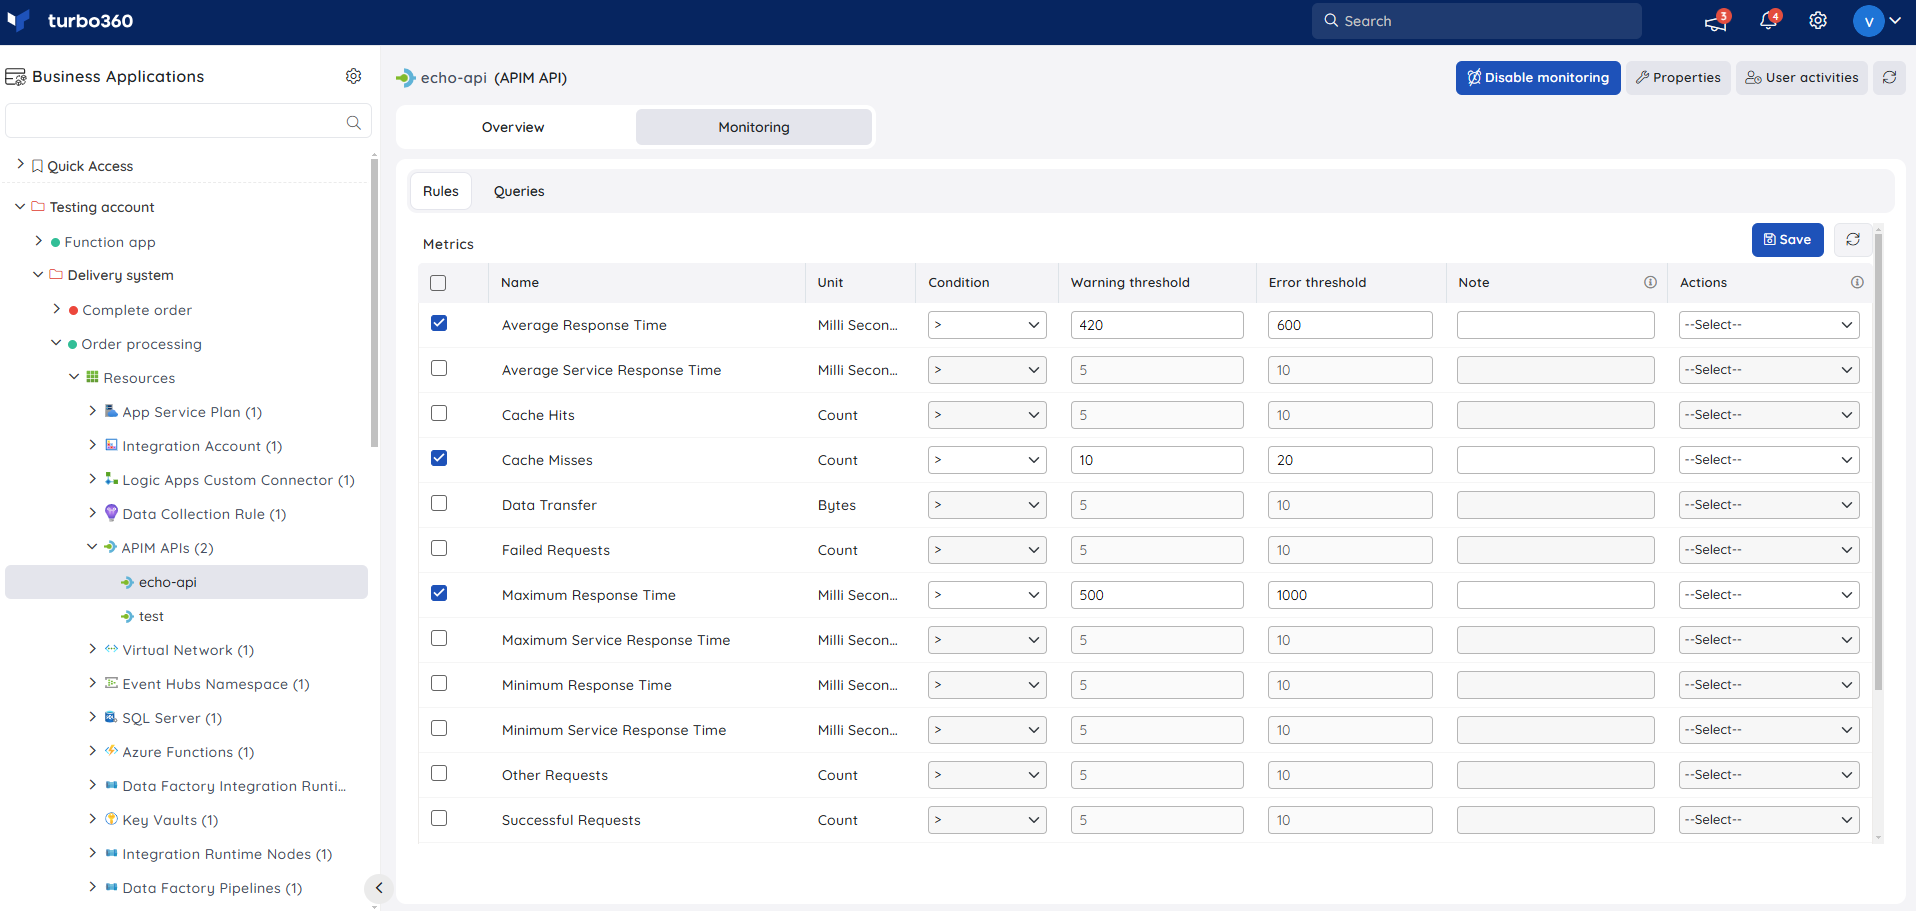
Metric monitoring tracks Azure platform metrics for the APIM API, such as failed requests, response times, and cache performance. Use metric rules to catch elevated failure rates early — for example, alert when failed requests exceed a threshold, indicating a backend service issue or a policy misconfiguration affecting multiple consumers.
- Switch to the Rules tab.
- Select the monitoring metrics and configure the threshold values.
- Click Save.
You can provide threshold values for any metric name. The rule triggers when the metric value meets the configured threshold.
Query monitoring
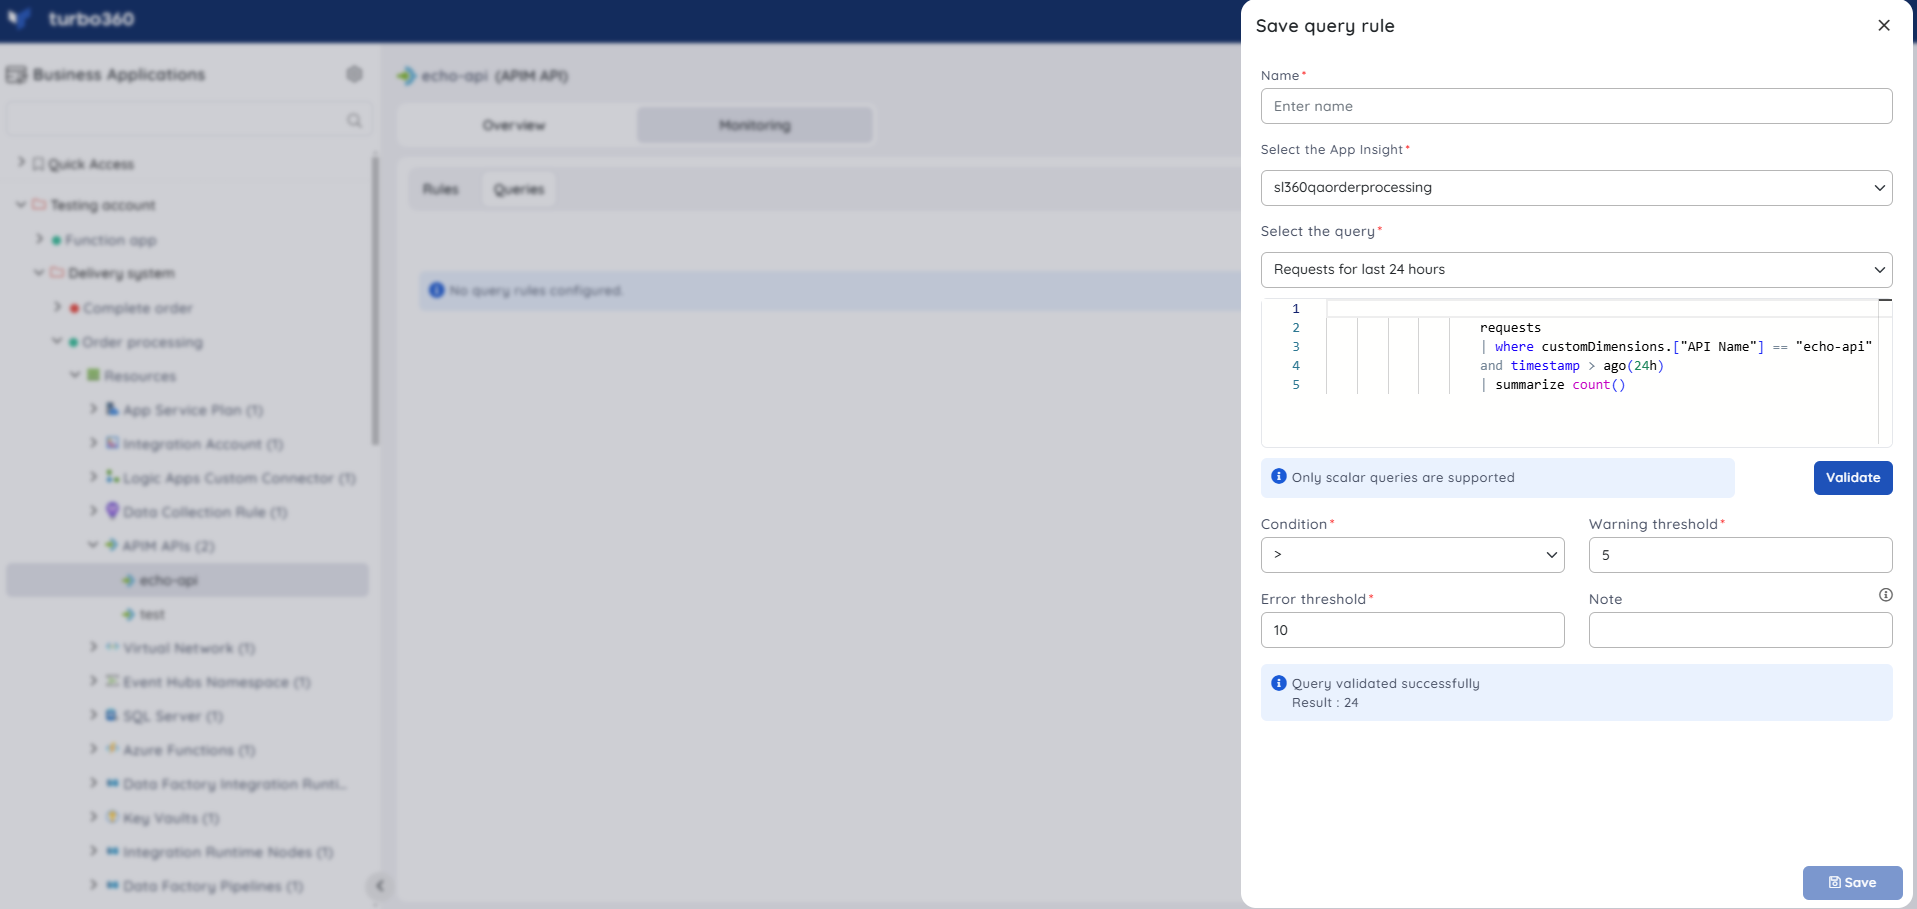
Query monitoring lets you write KQL queries against an Application Insights resource to define custom alert conditions on your APIM API telemetry. Use query rules when metric thresholds are too broad — for example, alert only when p95 response time for a specific operation exceeds 2 seconds, using a targeted query against your Application Insights data.
- Switch to the Queries tab.
- Click Add.
- Enter a name for the query rule.
- Choose an Application Insights resource to fetch query data.
- Enter a query by selecting Enter query, or choose a saved query by selecting Open from saved queries.
- Select the preferred time range.
- Click Execute to run the query.
- Select the required query columns and configure the threshold values.
- Click Save.
Note:
Query monitoring starts once the rules are saved. The query monitoring state updates after every monitoring cycle.
APIM Operation
Resource dashboard
The APIM Operation resource dashboard shows request and response metrics at the individual operation level, letting you identify which specific backend operations are degraded without needing to review all API traffic.
The following widgets are available by default:
| Widget | What it shows |
|---|---|
| Unauthorized Requests | Count of requests to this operation rejected due to missing or invalid credentials |
| Data Transfer | Total data transferred in and out for this operation |
| Success Requests | Count of successful responses (2xx) for this operation |
| Failed Requests | Count of error responses (4xx or 5xx) for this operation |
| Request Summary | Aggregate breakdown of total, successful, and failed request counts |
| Response Time Summary | Average, minimum, and maximum response times for this operation |
| Service Time Summary | Backend processing time for this operation, excluding gateway overhead |
| Response Time Maximum vs Minimum | Comparison of peak and floor response times, useful for detecting latency spikes on a specific operation |
| Cache Hit vs Miss | Cache effectiveness for this operation — a low hit rate may indicate a missing or short-lived cache policy |
| Request Success vs Failure | Side-by-side view of successful and failed request volumes over time for this operation |
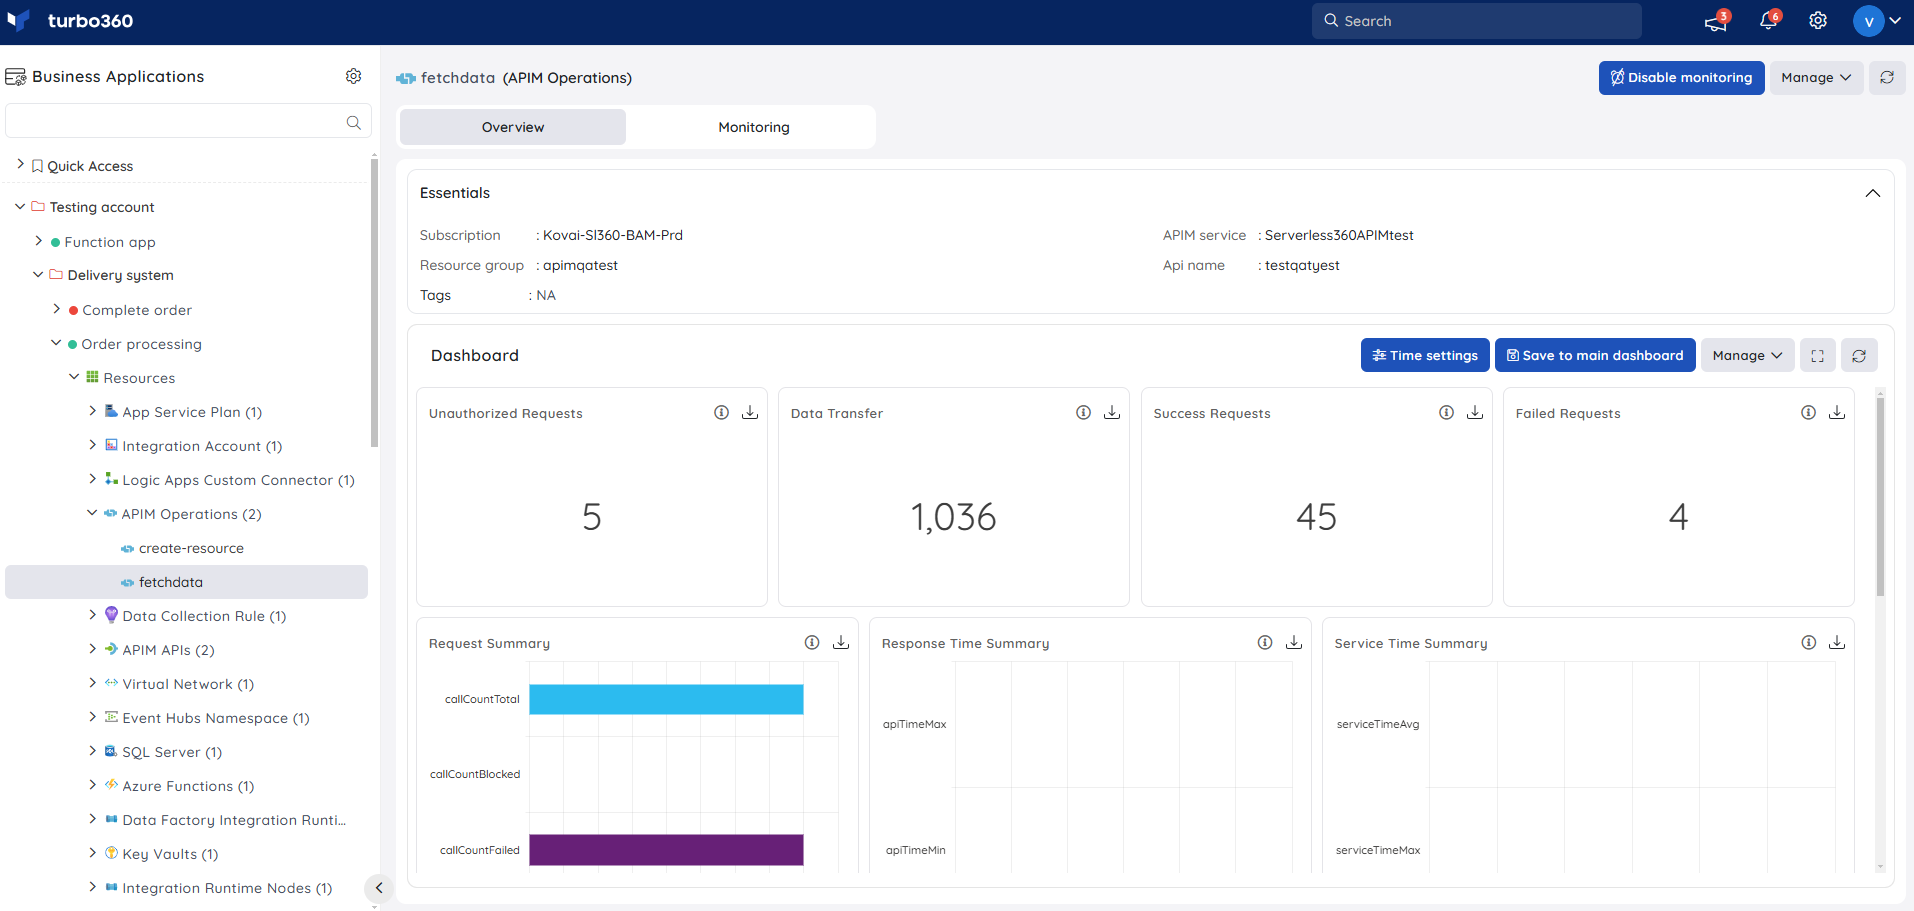
The data source for widgets can be query or metric data for chart types other than Count. A set of default queries is available using the associated Application Insights resource.
Note:
Any Application Insights resource can be used to generate query data for data visualization in the APIM Operation resource dashboard.
You can add, remove, or reconfigure widgets to focus on the metrics most relevant to your support scenario.
Metrics
The Metrics tab lets you chart Azure metrics for this specific APIM Operation directly in Turbo360, without switching to the Azure portal. Use it to isolate latency or error patterns at the individual operation level — for example, comparing response times across a time range to confirm whether a backend deployment improved or degraded that operation's performance.
Use the following controls to build your chart:
| Control | Description |
|---|---|
| Select metric | Choose the Azure metric to visualize (e.g. Requests, Failed Requests, Duration, Cache Hit Count, Cache Miss Count). |
| Aggregation | Set the aggregation method: Average, Min, Max, Total, or Count. |
| Time range | Set the time window for the data (e.g. Last 24 hours, Last 7 days). |
| Granularity | Set the data point resolution (e.g. 1 minute, 1 hour). |
| Chart type | Choose the visualization type: Line or Bar. |
Click Apply to render the chart.
Monitoring
APIM Operation supports metric and query monitoring rules. Navigate to APIM Operation > Monitoring to configure rules.
Note:
Monitoring rules are saved for APIM Operation. The monitoring state updates after every monitoring cycle.
Metric monitoring
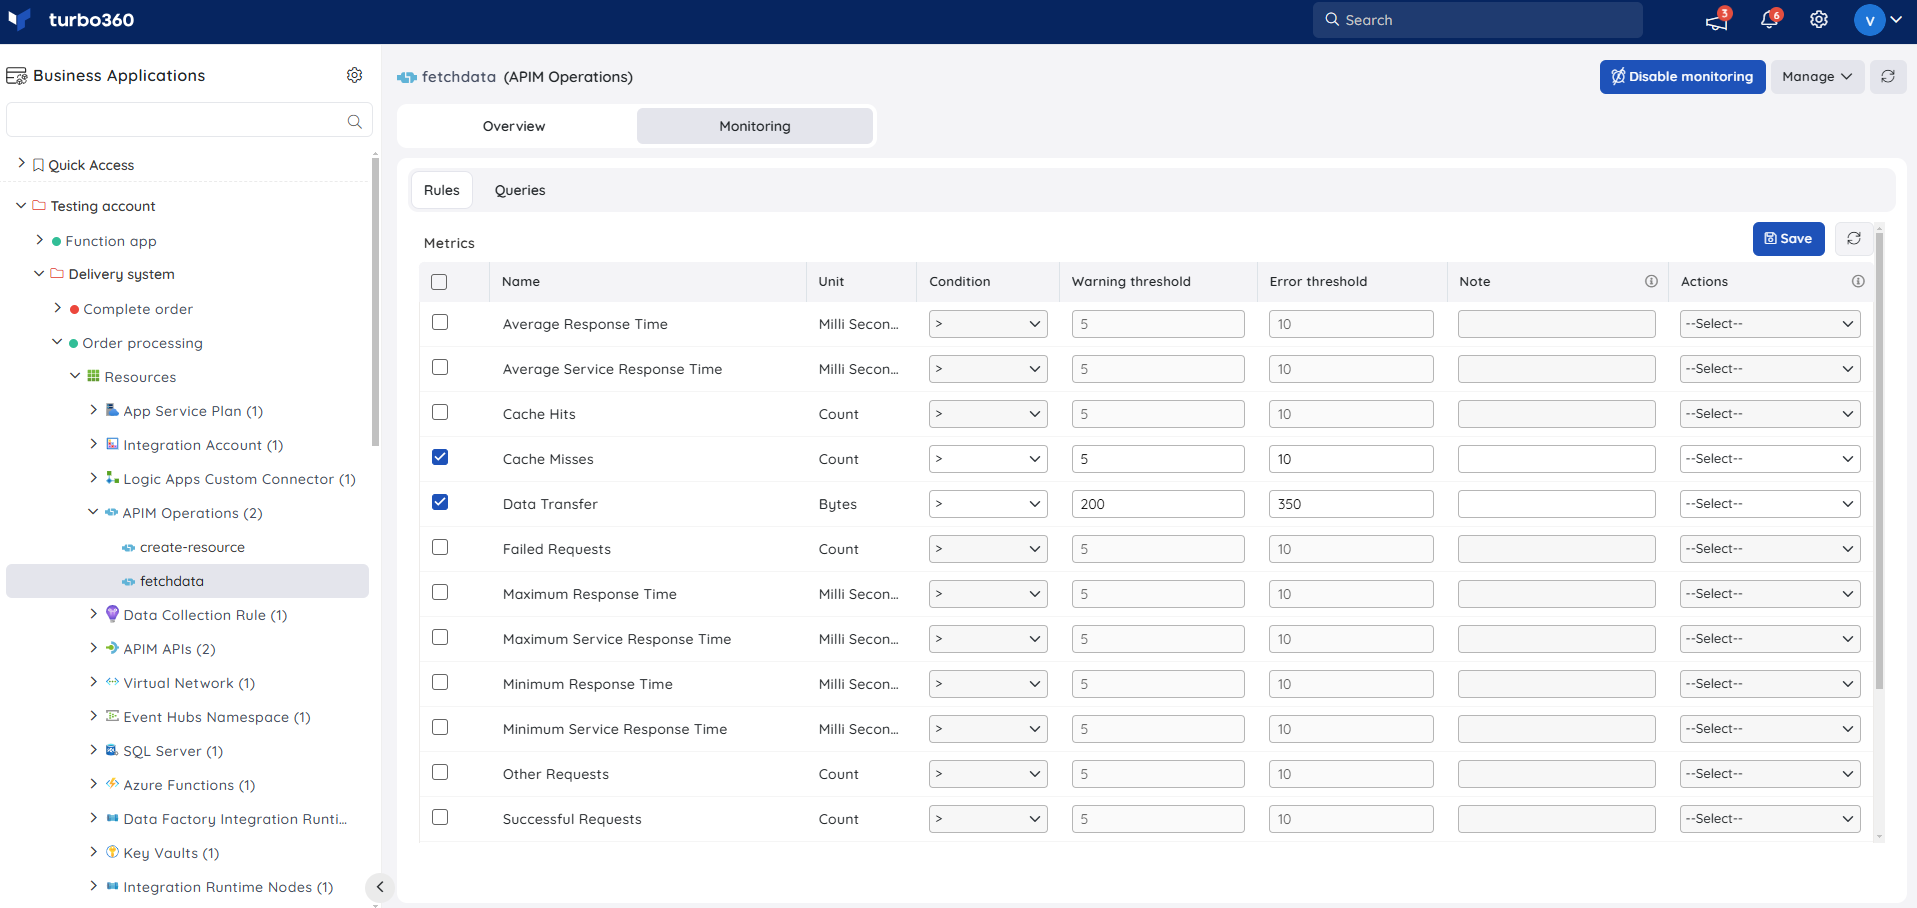
Metric monitoring tracks performance metrics at the individual operation level. Use metric rules to isolate which specific backend operations are degrading — for example, alert when response time for a particular operation spikes, helping you pinpoint the problem without manually reviewing all API traffic.
- Switch to the Rules tab.
- Select the monitoring metrics and configure the threshold values.
- Click Save.
You can provide threshold values for any metric name. The rule triggers when the metric value meets the configured threshold.
Query monitoring
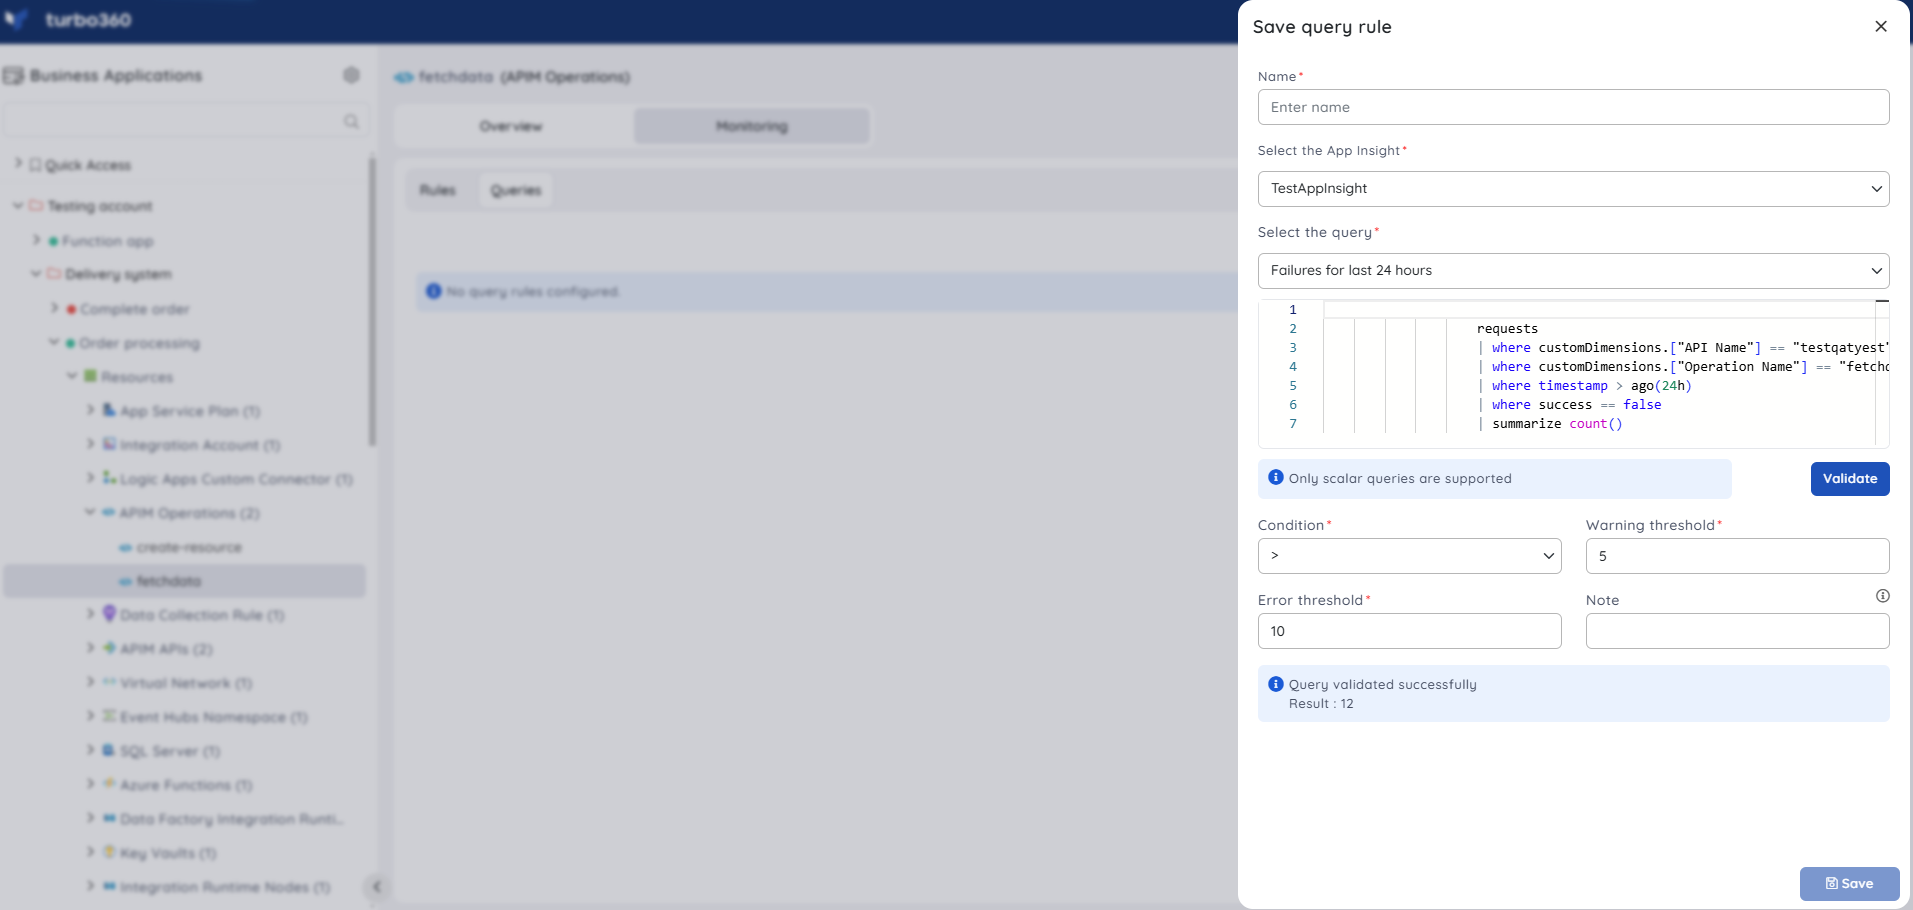
Query monitoring lets you define fine-grained alert conditions against Application Insights telemetry for individual APIM Operations. Use query rules when you need to correlate operation-level metrics with custom dimensions — for example, alert when failure rate for a POST operation from a specific client exceeds a threshold.
- Switch to the Queries tab.
- Click Add.
- Enter a name for the query rule.
- Choose an Application Insights resource to fetch query data.
- Enter a query by selecting Enter query, or choose a saved query by selecting Open from saved queries.
- Select the preferred time range.
- Click Execute to run the query.
- Select the required query columns and configure the threshold values.
- Click Save.
Note:
Query monitoring starts once the rules are saved. The query monitoring state updates after every monitoring cycle.
APIM Product
Operations
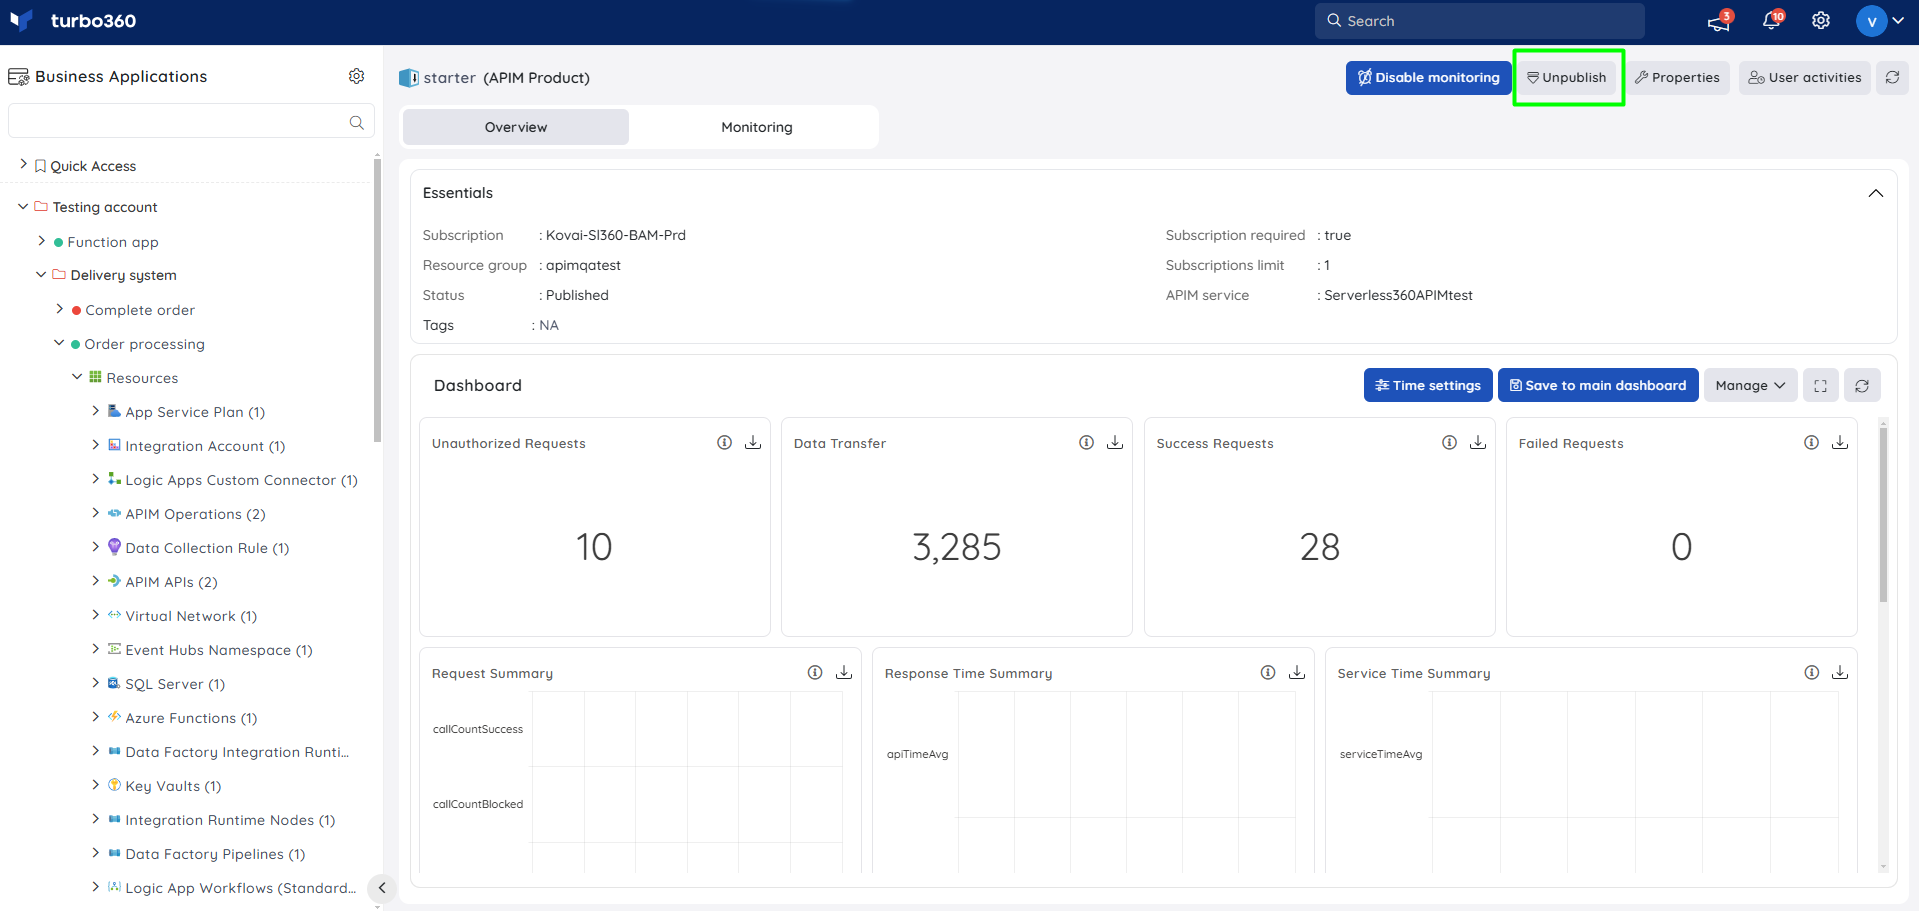
Turbo360 lets you control the visibility of APIM Products to API consumers directly from your Business Application. Publishing a product makes it visible in the developer portal so subscribers can discover and request access to its APIs. Unpublishing removes it from the portal without deleting the product or its subscriptions — existing active subscriptions continue to work, but the product is no longer discoverable.
- Publish — use this when a product and its associated APIs are ready for developer consumption, or when re-enabling a product after a maintenance period.
- Unpublish — use this to temporarily remove a product from the developer portal without affecting active subscribers, for example when deprecating an API version or restricting access while an issue is investigated.
- Navigate to the APIM Product resource in your business application.
- Click Publish or Unpublish as required.
Resource dashboard
The APIM Product resource dashboard shows aggregate request and response metrics across all APIs bundled in the product, giving you a product-level view of consumer activity and reliability.
The following widgets are available by default:
| Widget | What it shows |
|---|---|
| Unauthorized Requests | Count of requests rejected due to missing or invalid subscription keys across all APIs in the product — a spike may indicate expired subscriptions or a misconfigured access policy |
| Data Transfer | Total data transferred across all APIs in the product |
| Success Requests | Count of successful responses (2xx) across all APIs in the product |
| Failed Requests | Count of error responses (4xx or 5xx) across all APIs in the product |
| Request Summary | Aggregate breakdown of total, successful, and failed request counts |
| Response Time Summary | Average, minimum, and maximum response times across all APIs in the product |
| Service Time Summary | Backend processing time across all APIs in the product |
| Response Time Maximum vs Minimum | Comparison of peak and floor response times across the product |
| Cache Hit vs Miss | Overall cache effectiveness for all APIs in the product |
| Request Success vs Failure | Side-by-side view of successful and failed request volumes across the product over time |
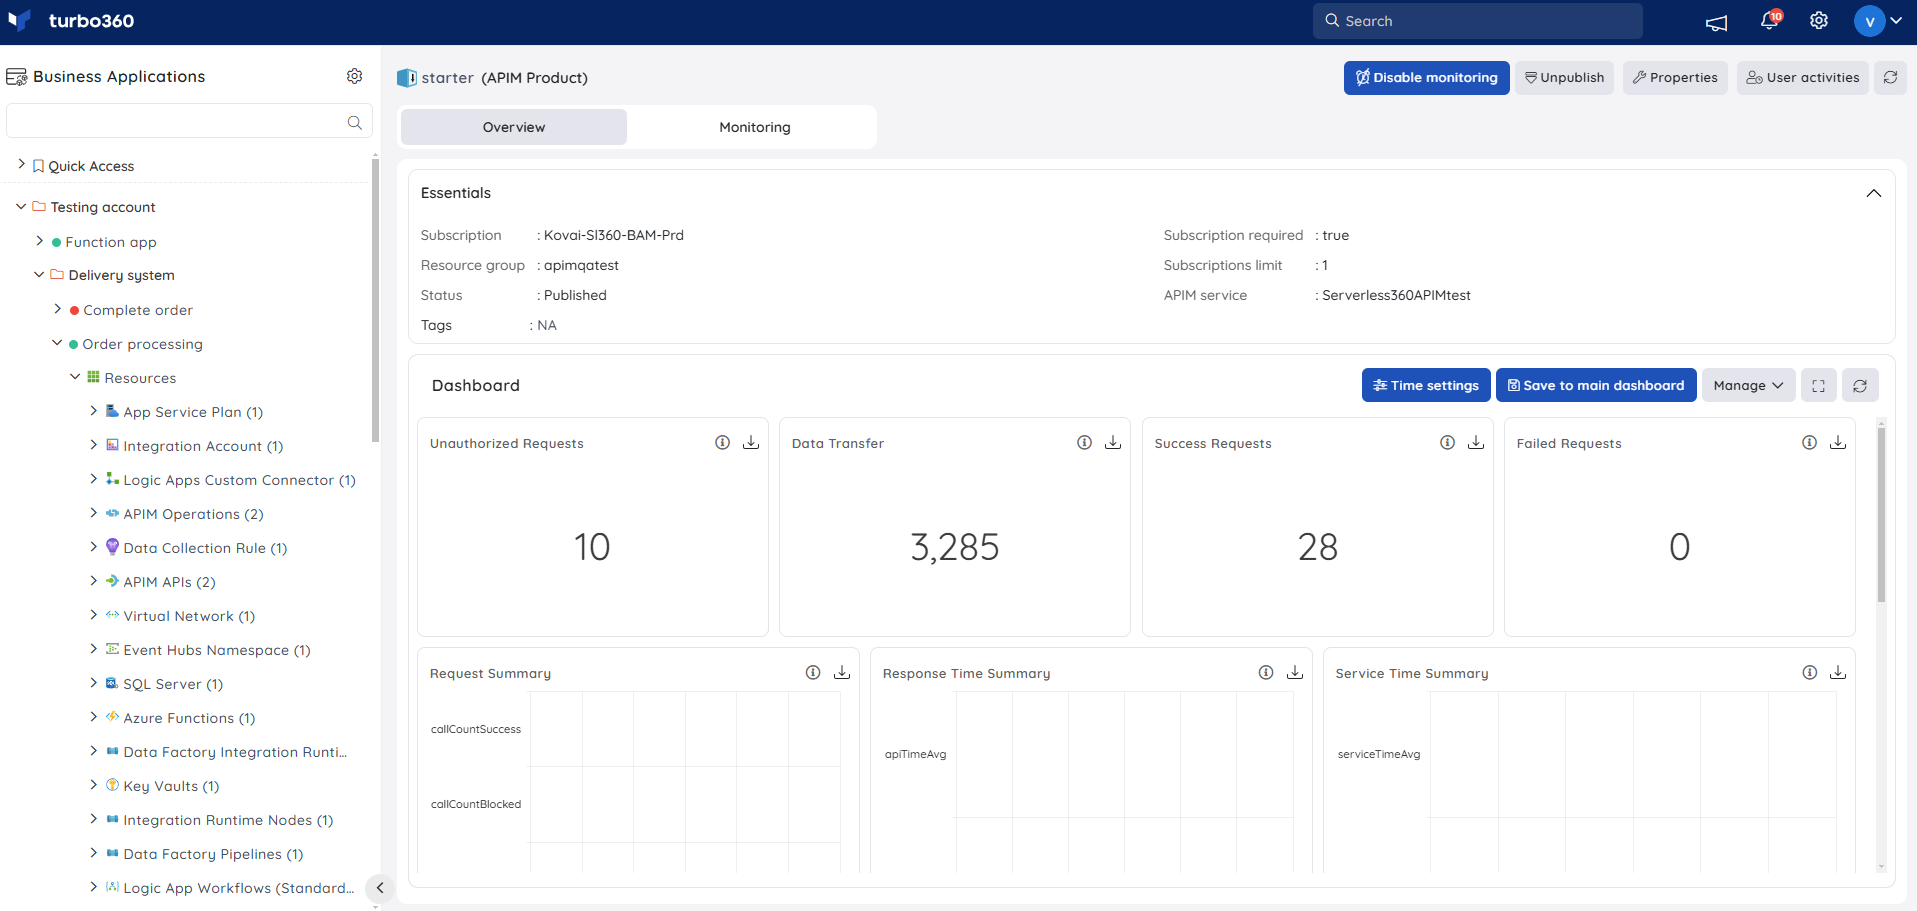
You can add, remove, or reconfigure widgets to focus on the metrics most relevant to your support scenario.
Metrics
The Metrics tab lets you chart any Azure metric for your APIM Product directly in Turbo360, without switching to the Azure portal. Use it to monitor aggregate consumer activity across all APIs in the product — for example, spotting a step change in unauthorized requests that could signal a subscription management issue affecting all product subscribers.
Use the following controls to build your chart:
| Control | Description |
|---|---|
| Select metric | Choose the Azure metric to visualize (e.g. Requests, Failed Requests, Unauthorized Requests, Data Transfer). |
| Aggregation | Set the aggregation method: Average, Min, Max, Total, or Count. |
| Time range | Set the time window for the data (e.g. Last 24 hours, Last 7 days). |
| Granularity | Set the data point resolution (e.g. 1 minute, 1 hour). |
| Chart type | Choose the visualization type: Line or Bar. |
Click Apply to render the chart.
Monitoring
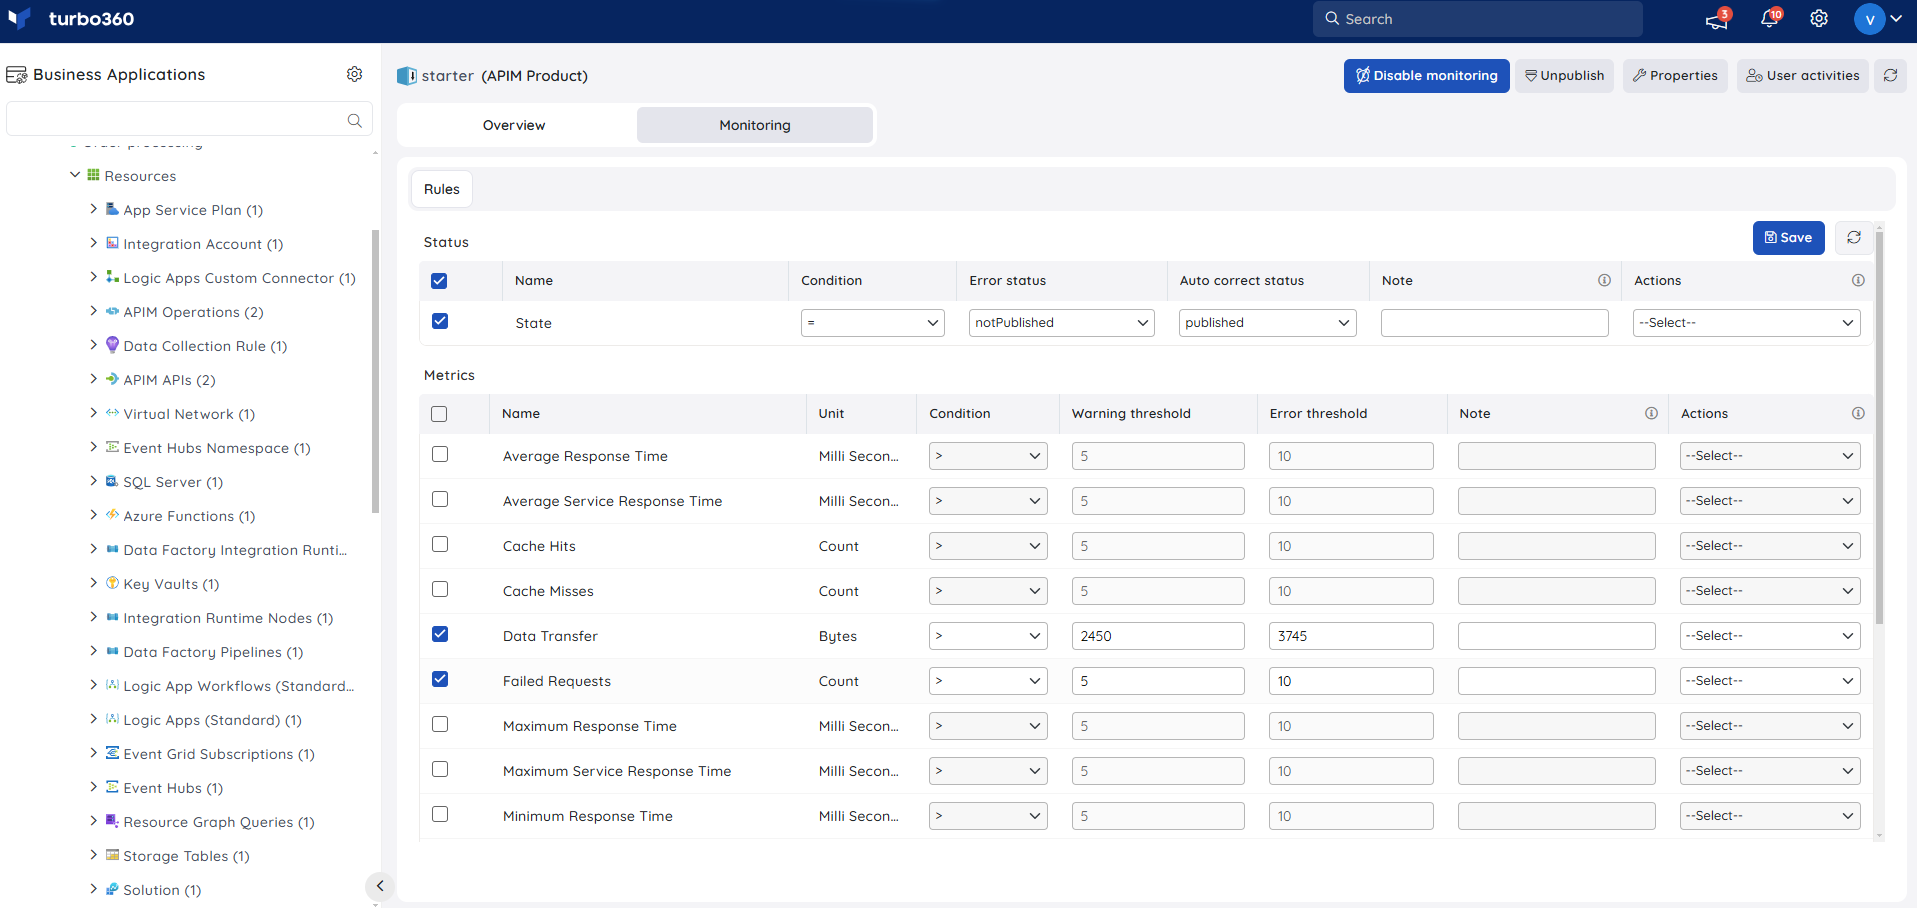
APIM Product supports metric monitoring rules. Navigate to APIM Product > Monitoring to configure rules.
Note:
Monitoring rules are saved for APIM Product. The monitoring state updates after every monitoring cycle.
Metric monitoring
Metric monitoring tracks usage and reliability metrics across all APIs bundled in the product. Use metric rules to detect when a product is experiencing unusual traffic or failures — for example, alert when unauthorized requests spike, which may indicate expired subscriptions or a misconfigured access policy affecting all product consumers.
- Select the monitoring metrics and configure the threshold values.
- Click Save.
You can provide threshold values for any metric name. The rule triggers when the metric value meets the configured threshold.
APIM Service
Resource dashboard
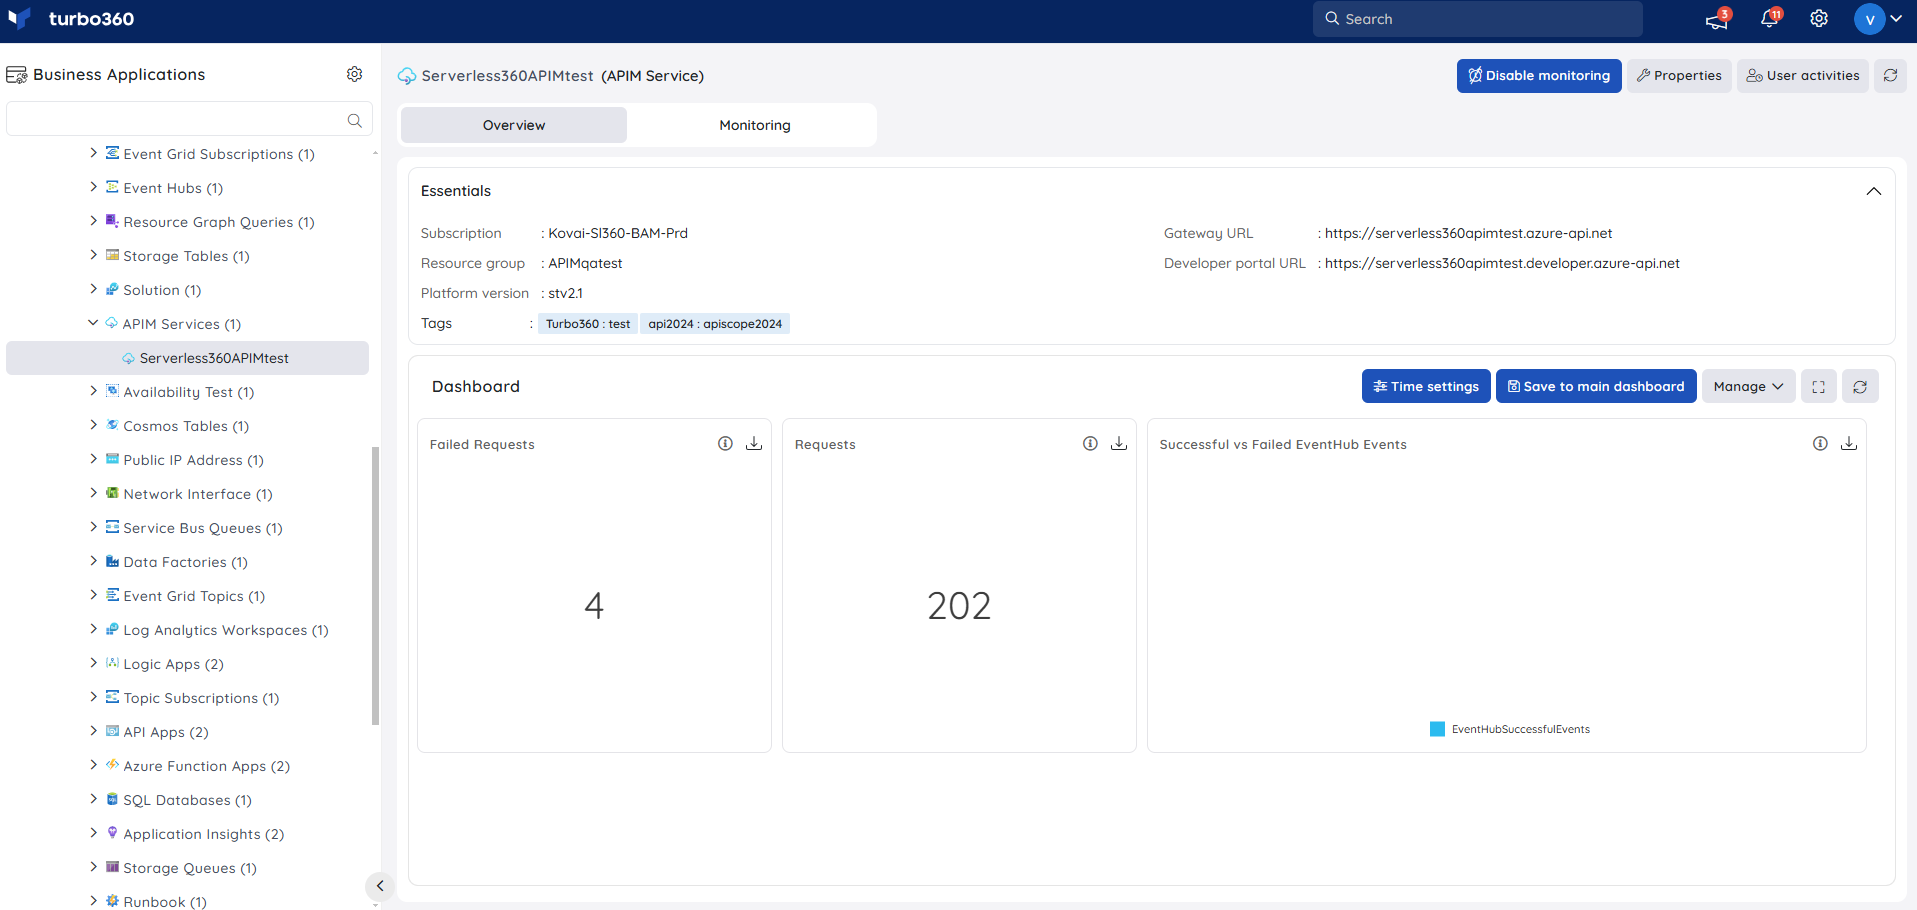
The APIM Service resource dashboard gives you a service-level view of request volume, failures, and event hub activity — the top-level signals for assessing overall APIM instance health.
The following widgets are available by default:
| Widget | What it shows |
|---|---|
| Failed Requests | Count of failed requests across all APIs published through this APIM Service instance |
| Requests | Total request volume across all APIs, useful for understanding overall load on the service |
| Successful vs Failed EventHub Events | Comparison of successfully logged and failed EventHub log events — useful when APIM is integrated with Azure Event Hubs for analytics or audit logging |
Note:
Any Application Insights resource can be used to generate query data for data visualization of the APIM Service.
You can add, remove, or reconfigure widgets to focus on the metrics most relevant to your support scenario.
Metrics
The Metrics tab lets you chart any Azure metric for your APIM Service instance directly in Turbo360, without switching to the Azure portal. Use it to monitor service-wide capacity utilization and request volumes — for example, tracking total requests over time to determine whether your current tier can absorb expected growth before performance degrades for all API consumers.
Use the following controls to build your chart:
| Control | Description |
|---|---|
| Select metric | Choose the Azure metric to visualize (e.g. Total Requests, Failed Requests, Capacity, Gateway Requests, EventHub Total Events). |
| Aggregation | Set the aggregation method: Average, Min, Max, Total, or Count. |
| Time range | Set the time window for the data (e.g. Last 24 hours, Last 7 days). |
| Granularity | Set the data point resolution (e.g. 1 minute, 1 hour). |
| Chart type | Choose the visualization type: Line or Bar. |
Click Apply to render the chart.
Monitoring
APIM Service supports availability status, metric, and query monitoring rules. Navigate to APIM Service > Monitoring to configure rules.
Note:
Monitoring rules are saved for APIM Service. The monitoring state updates after every monitoring cycle.
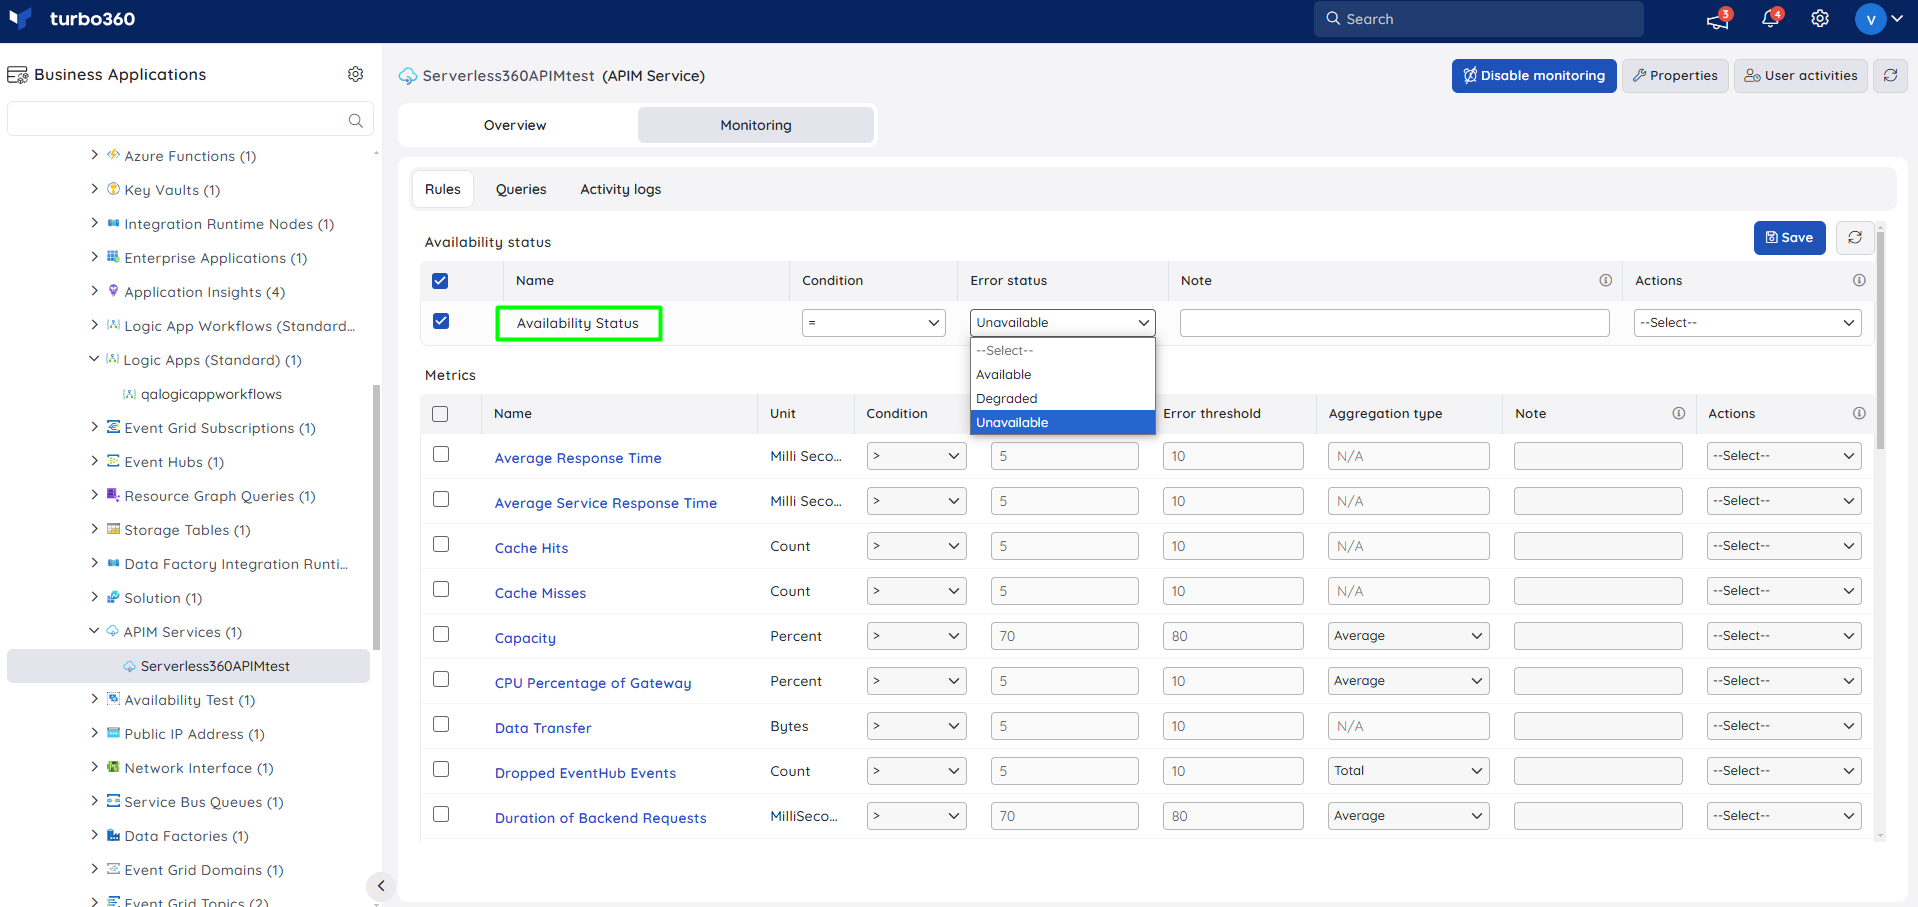
Availability status monitoring
Availability status monitoring tracks the health of the APIM Service instance as reported by Azure. Use this rule as your first line of defense — an APIM Service going unhealthy affects all APIs published through it, so this alert gives you the earliest possible warning of a platform-level issue.
- Configure the Availability status rule with the desired threshold.
- Click Save.
Metric monitoring
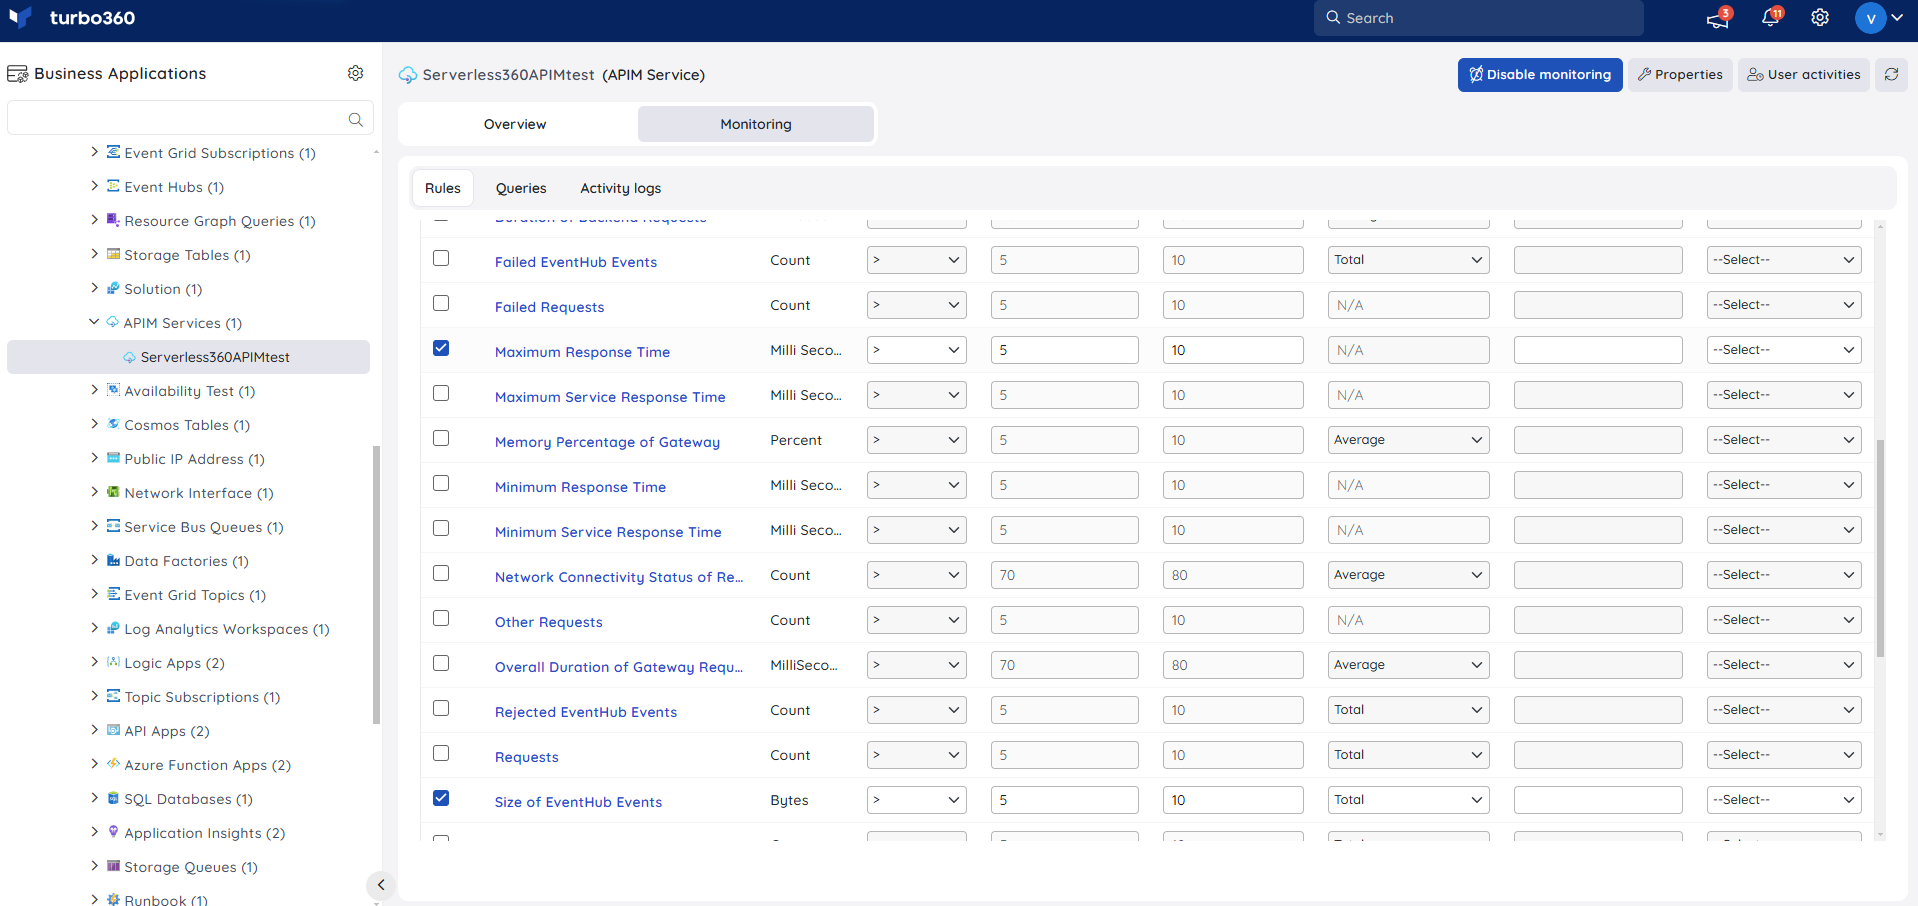
Metric monitoring tracks service-level Azure metrics across all APIs and operations hosted on the APIM instance. Use metric rules to monitor capacity and throughput — for example, alert when total request volume approaches your tier's capacity limits, giving you time to scale up before performance degrades for all consumers.
- Switch to the Rules tab.
- Select the monitoring metrics and configure the threshold values.
- Click Save.
You can provide threshold values for any metric name. The rule triggers when the metric value meets the configured threshold.
Query monitoring
Query monitoring lets you define custom alert conditions against Application Insights telemetry at the service level. Use query rules for cross-cutting concerns — for example, alert when the error rate across all APIs exceeds a threshold during business hours, using a time-scoped query that ignores expected overnight maintenance traffic.
- Switch to the Queries tab.
- Click Add.
- Enter a name for the query rule.
- Choose an Application Insights resource to fetch query data.
- Enter a query by selecting Enter query, or choose a saved query by selecting Open from saved queries.
- Select the preferred time range.
- Click Execute to run the query.
- Select the required query columns and configure the threshold values.
- Click Save.
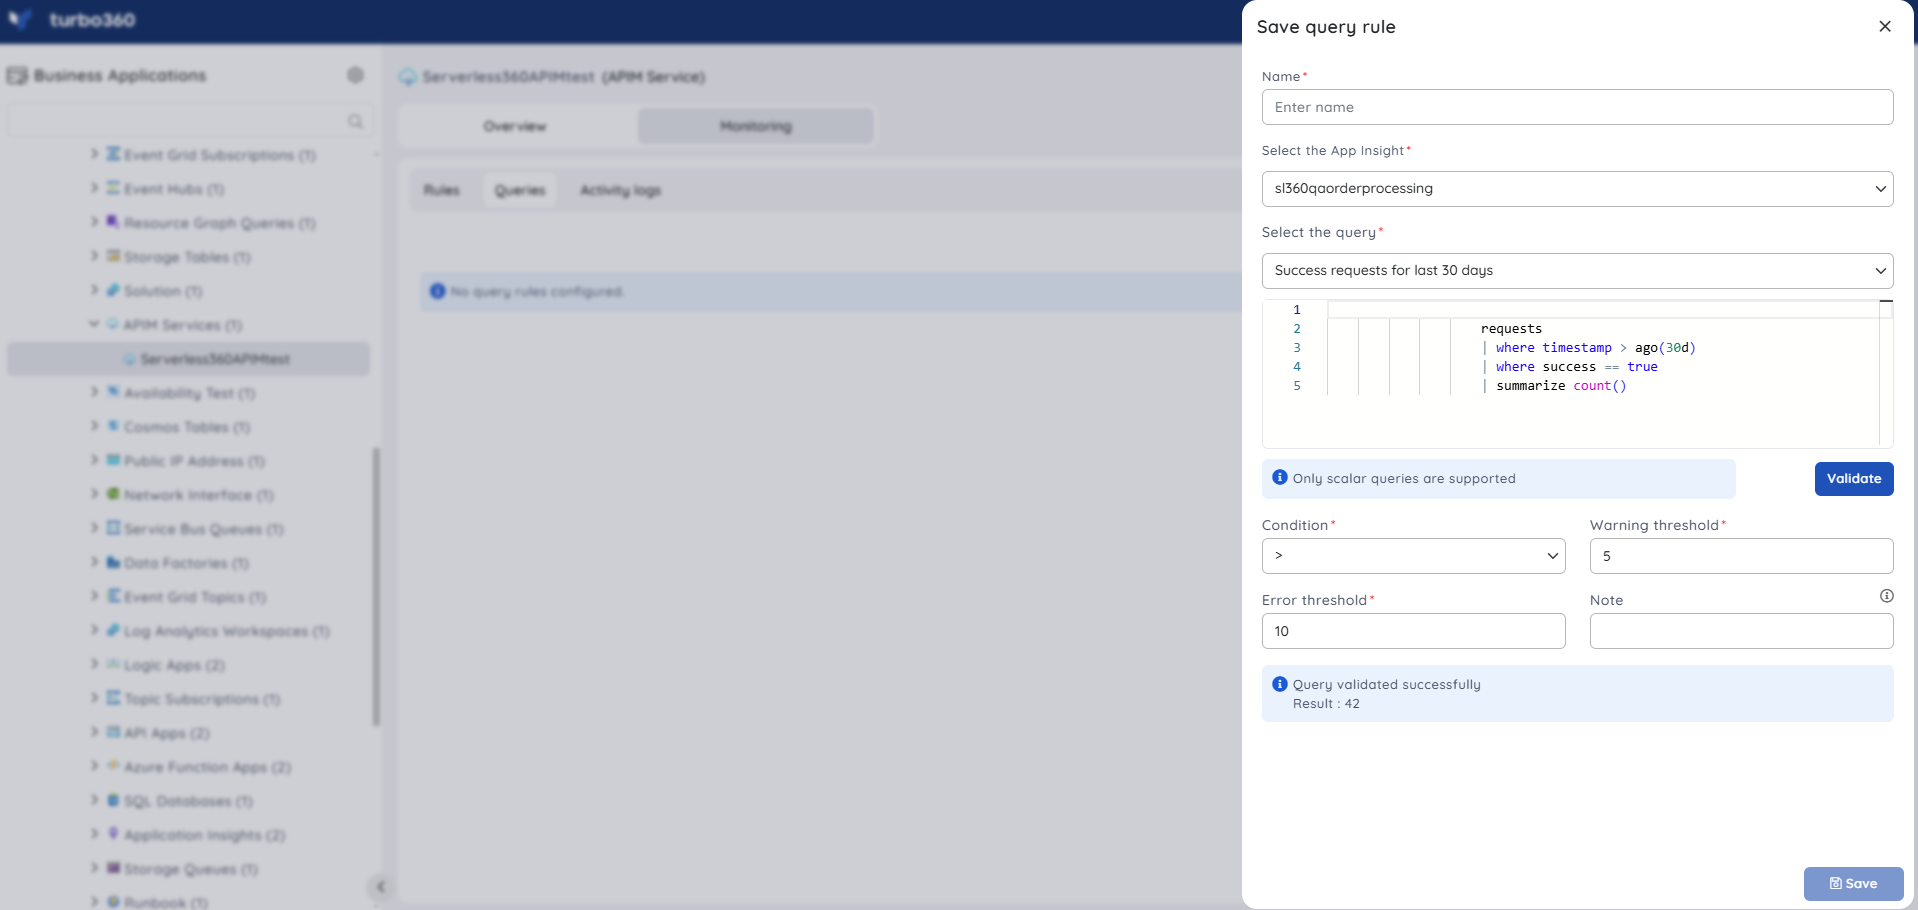
Note:
Query monitoring starts once the rules are saved. The query monitoring state updates after every monitoring cycle.
Troubleshooting
Query monitoring rule fails to execute
Cause: The associated Application Insights resource may not be correctly linked, or the KQL query is invalid.
Fix: Verify the Application Insights resource selection in the rule and test the query manually using Execute before saving.Product publish or unpublish operation does not take effect
Cause: The user may not have the Manage permission for APIM Product, or the change has not propagated to the developer portal yet.
Fix: Confirm the user's role includes Manage for APIM Product, and allow a few minutes for the developer portal to reflect the change.Dashboard widgets show no data for query-based charts
Cause: The Count chart type was selected, which is not supported for query data sources, or no Application Insights resource is associated with the widget.
Fix: Select a chart type other than Count for query-based widgets, and ensure a valid Application Insights resource is linked.Metric monitoring rule not reflecting an updated threshold
Cause: The rule change may not have saved successfully, or the monitoring cycle has not yet completed.
Fix: Re-open the resource's Monitoring tab, confirm the threshold was saved, and wait for the next monitoring cycle for the state to update.
Related articles
Was this article helpful?