

App Service Plan
- 05 Aug 2026
- 5 Minutes to read
- Print
- DarkLight
- Download PDF
App Service Plan
- Updated on 05 Aug 2026
- 5 Minutes to read
- Print
- DarkLight
- Download PDF
Article summary
Did you find this summary helpful?
Thank you for your feedback!
Overview
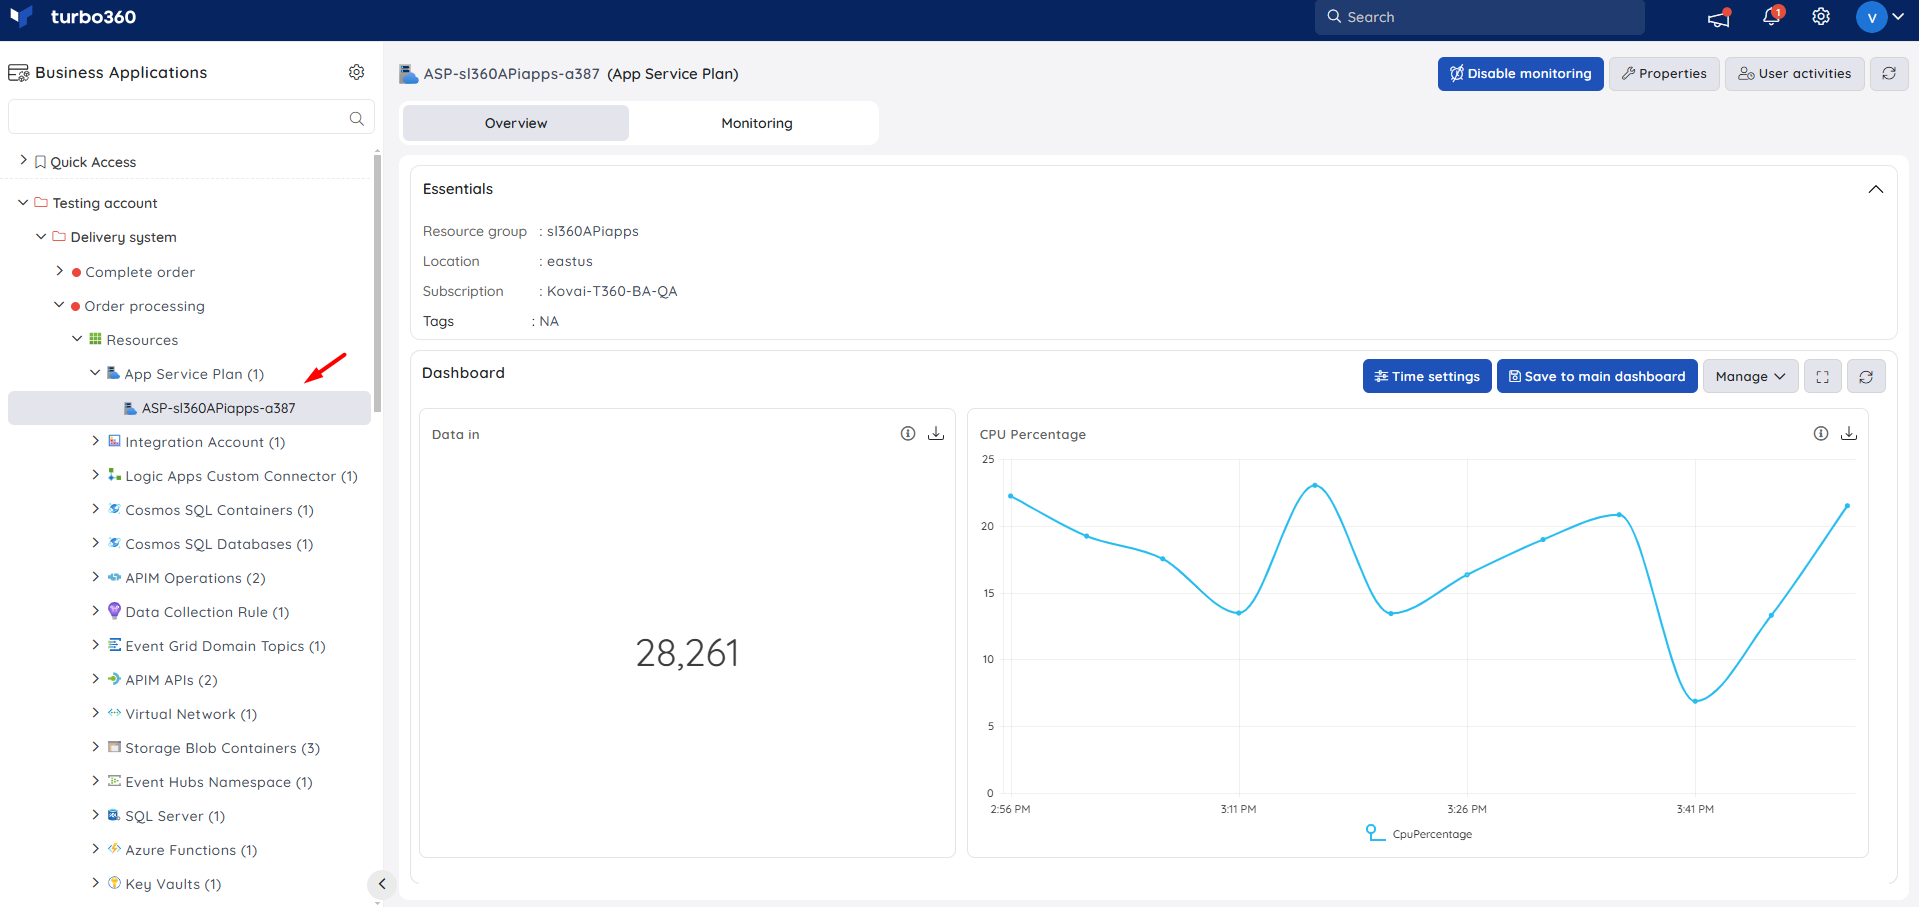
Azure App Service Plan is a PaaS resource that hosts web apps, function apps, and Logic Apps in Azure. In Turbo360, you can add an App Service Plan to your Business Application as a generic resource type. It supports monitoring and resource dashboards built on the Azure metrics API.
Because a single App Service Plan can host multiple apps of different types, you can choose to add it to a Business Application that represents shared infrastructure or to one that represents a specific application. This lets you model the support view that makes the most sense for your team.
Business value
Adding App Service Plan to your Business Application gives your support team visibility into the shared infrastructure that underpins multiple hosted apps. Monitoring infrastructure-level metrics alongside application-level metrics helps you identify whether performance issues originate in a specific app or in the plan it runs on.
How it works
Turbo360 surfaces resource health, instance count, quota utilization, and custom metrics for the App Service Plan through monitoring rules. Rules are evaluated on a regular monitoring cycle, and the monitoring state is updated after each cycle.
You can also add custom dashboards to track the metrics most relevant to your support scenario.
Permissions
Turbo360 uses role-based access control to restrict what users can do with App Service Plan resources. Permissions are assigned per resource type when configuring roles under User management.
| Permission | Access granted |
|---|---|
| Read | View the App Service Plan resource, dashboards, and monitoring configuration |
| Manage | Configure and save monitoring rules and dashboards for the App Service Plan |
Resource dashboard
App Service Plan does not have a fixed set of default widgets. Instead, you build a custom dashboard tailored to your infrastructure support scenario by selecting from the full range of Azure metrics available for the plan.
Recommended widgets to consider:
| Widget | What it shows |
|---|---|
| CPU Percentage | Average CPU utilization across all instances in the plan — the primary signal for compute saturation |
| Memory Percentage | Average memory utilization across all instances — useful for identifying memory pressure from hosted apps |
| HTTP Queue Length | Number of requests waiting in the queue before being processed — a sustained queue indicates the plan is under load and may need scaling |
| Disk Queue Length | Number of pending I/O operations — useful for plans hosting disk-intensive workloads |
| Data In / Data Out | Inbound and outbound network traffic, useful for detecting unusual data transfer patterns |
| Instance Count | Number of compute instances currently allocated — track alongside CPU and memory to understand scaling behaviour |
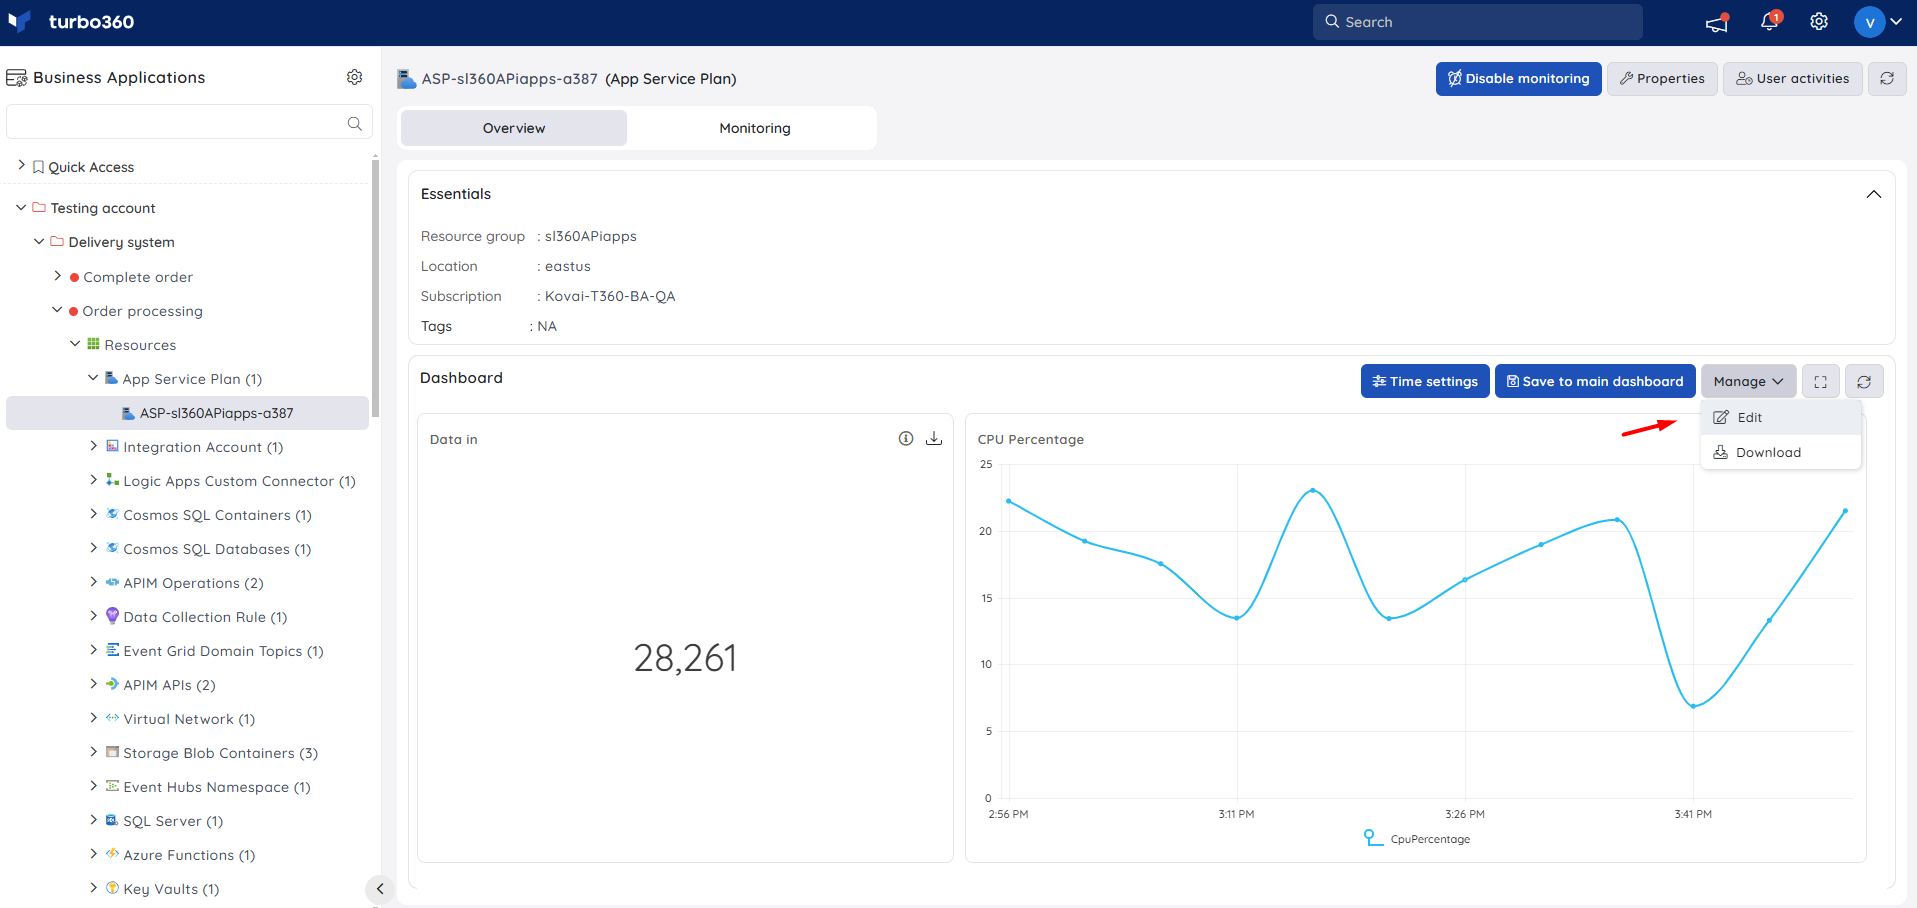
To add widgets, open the dashboard configuration for the App Service Plan and select the metrics most relevant to your support scenario.
Metrics
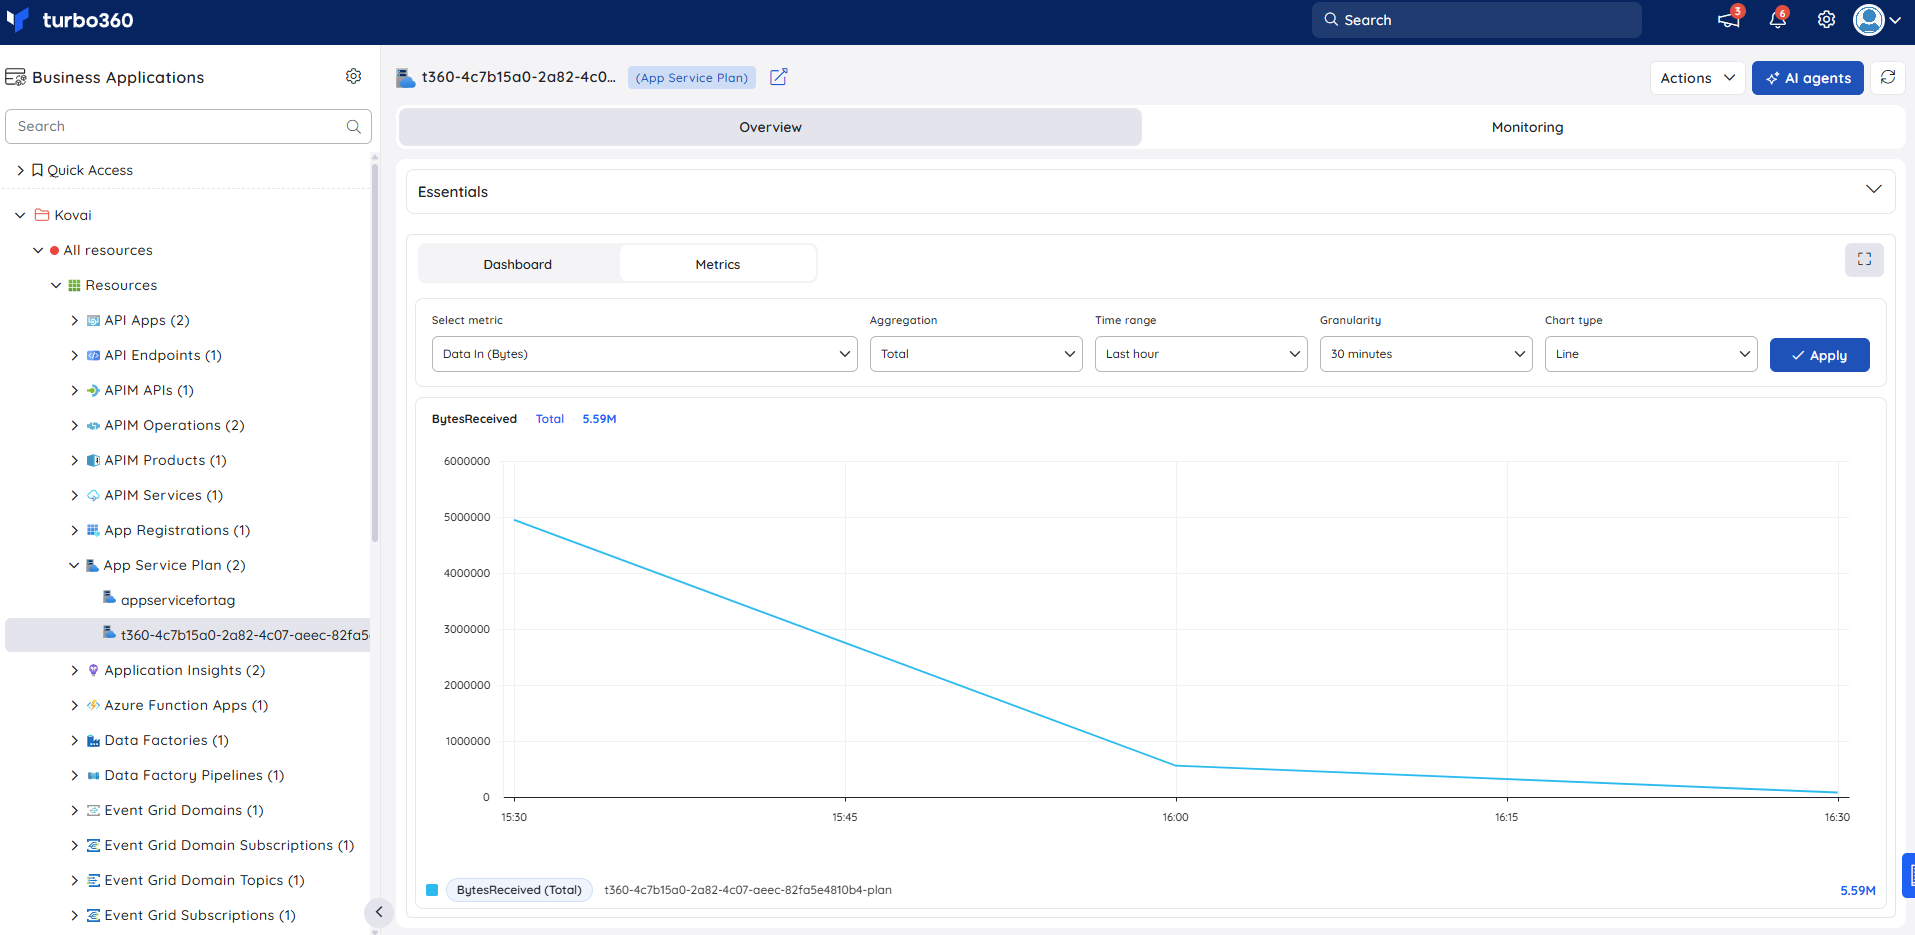
The Metrics tab lets you chart any Azure metric for your App Service Plan directly in Turbo360, without switching to the Azure portal. Use it to visualize CPU and memory utilization trends, HTTP queue depth, and instance scaling behavior over time — particularly useful when diagnosing whether a performance issue affecting multiple hosted apps is caused by plan-level resource saturation rather than a problem in an individual application.
Use the following controls to build your chart:
| Control | Description |
|---|---|
| Select metric | Choose the Azure metric to visualize (e.g. CPU Percentage, Memory Percentage, HTTP Queue Length, Disk Queue Length, Data In, Data Out). |
| Aggregation | Set the aggregation method: Average, Min, Max, Total, or Count. |
| Time range | Set the time window for the data (e.g. Last 24 hours, Last 7 days). |
| Granularity | Set the data point resolution (e.g. 1 minute, 1 hour). |
| Chart type | Choose the visualization type: Line or Bar. |
Click Apply to render the chart.
Monitoring
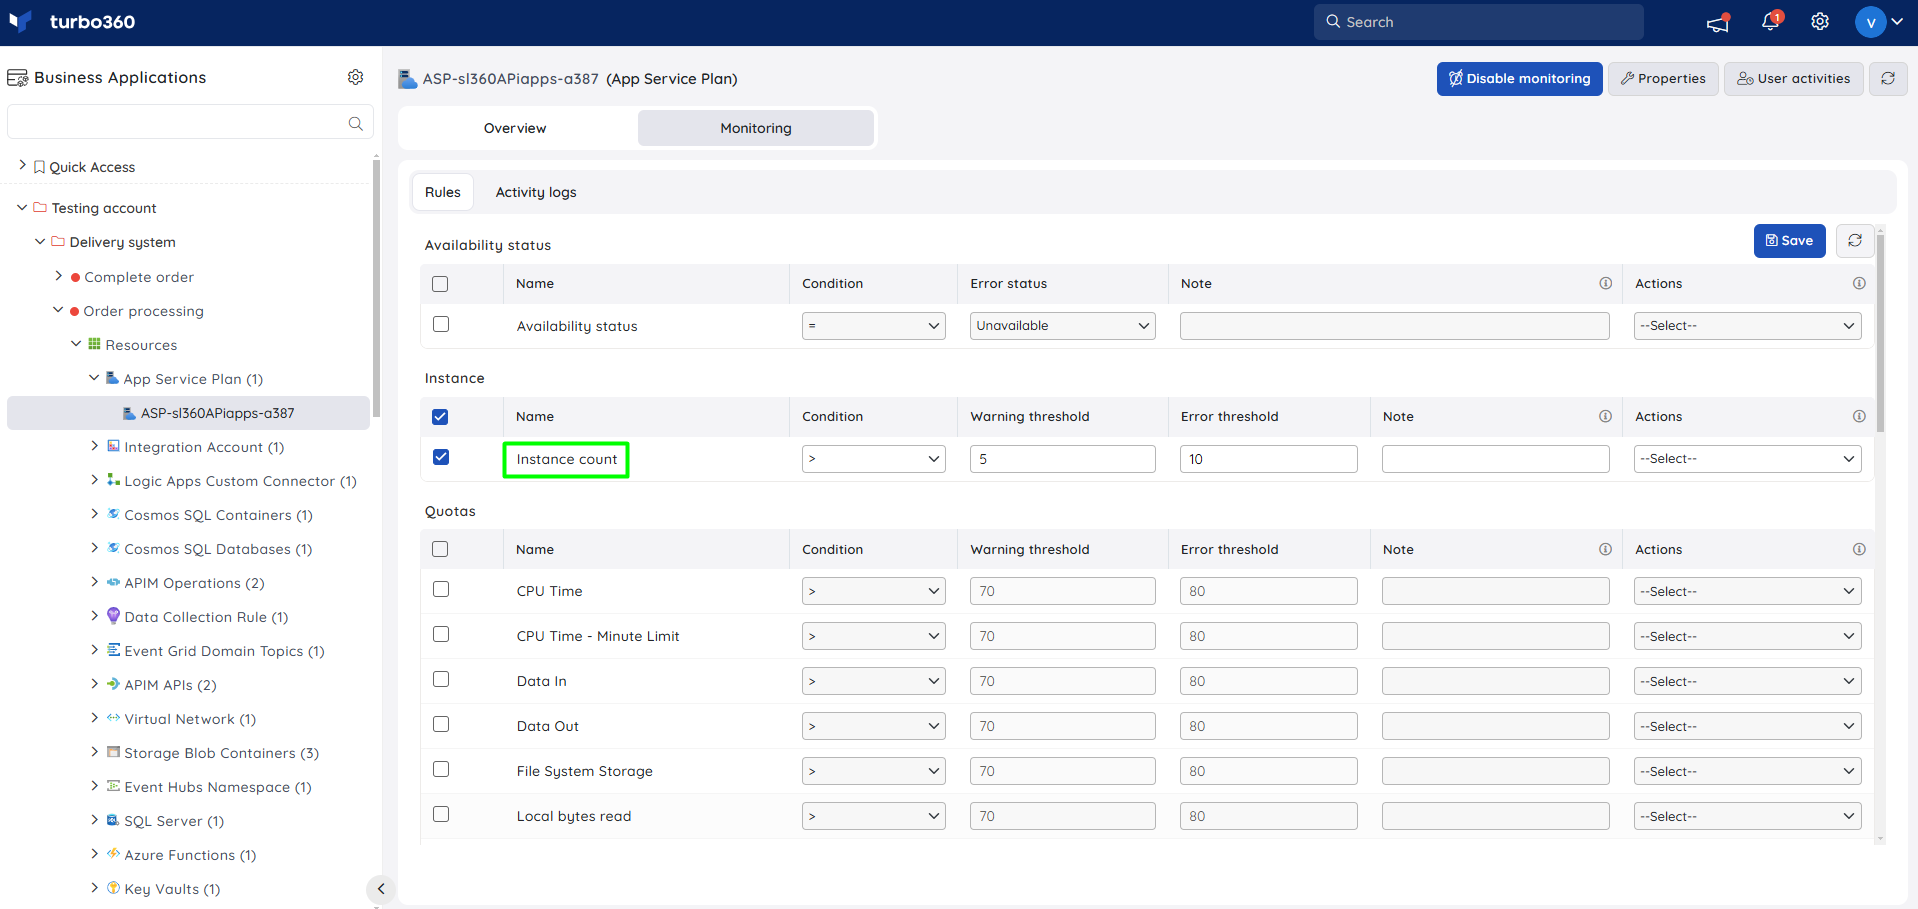
App Service Plan supports availability status, instance, quotas, and metric monitoring rules. Navigate to App Service Plan > Monitoring to configure rules.
Monitoring rules are saved for the App Service Plan. The monitoring state for each metric is reflected after every monitoring cycle.
Availability status monitoring
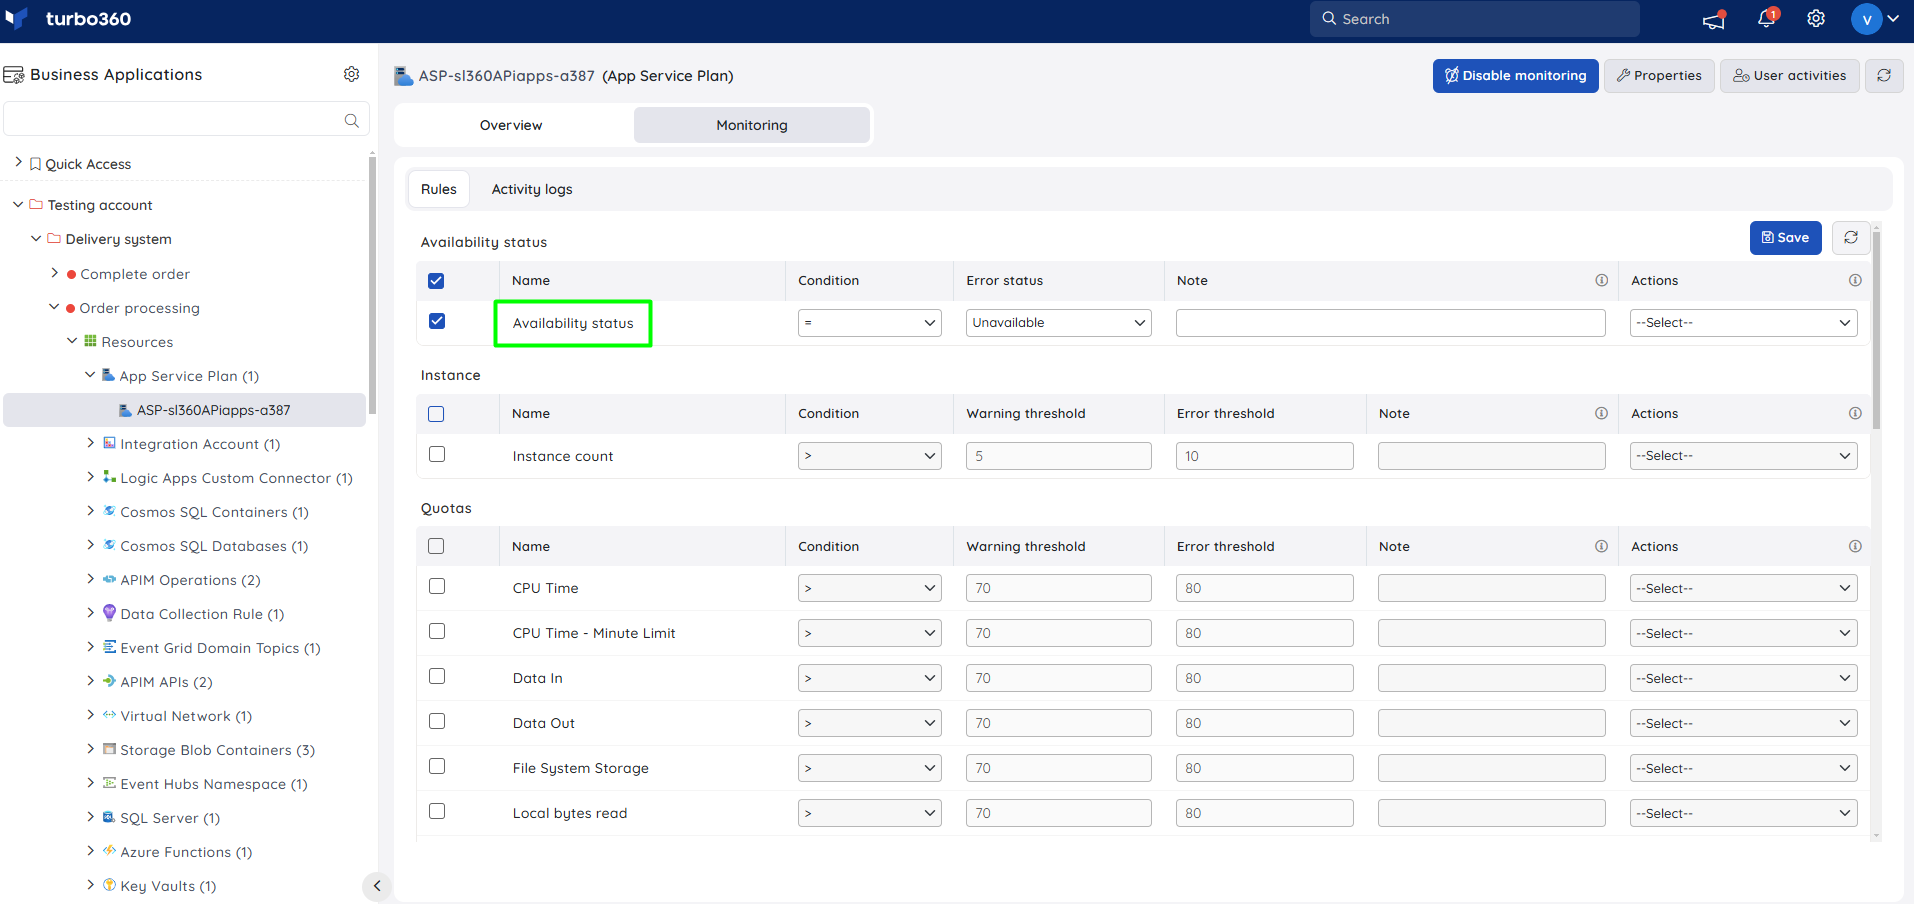
Availability status monitoring tracks the resource health of the App Service Plan as reported by Azure. Use this as your first alert — an unhealthy plan affects every app running on it, so this rule gives you early warning of a platform issue before individual apps start failing.
- Configure the Availability status rule with the desired threshold.
- Click Save.
Instance monitoring
Instance monitoring tracks the number of compute nodes currently allocated to the plan. Use this rule to detect unexpected scaling behavior — for example, alert when instance count drops to zero (indicating all instances have been removed) or exceeds your expected maximum, which could signal a runaway auto-scale configuration or unexpected load on shared infrastructure.
- Configure the Instance count rule with the desired threshold.
- Click Save.
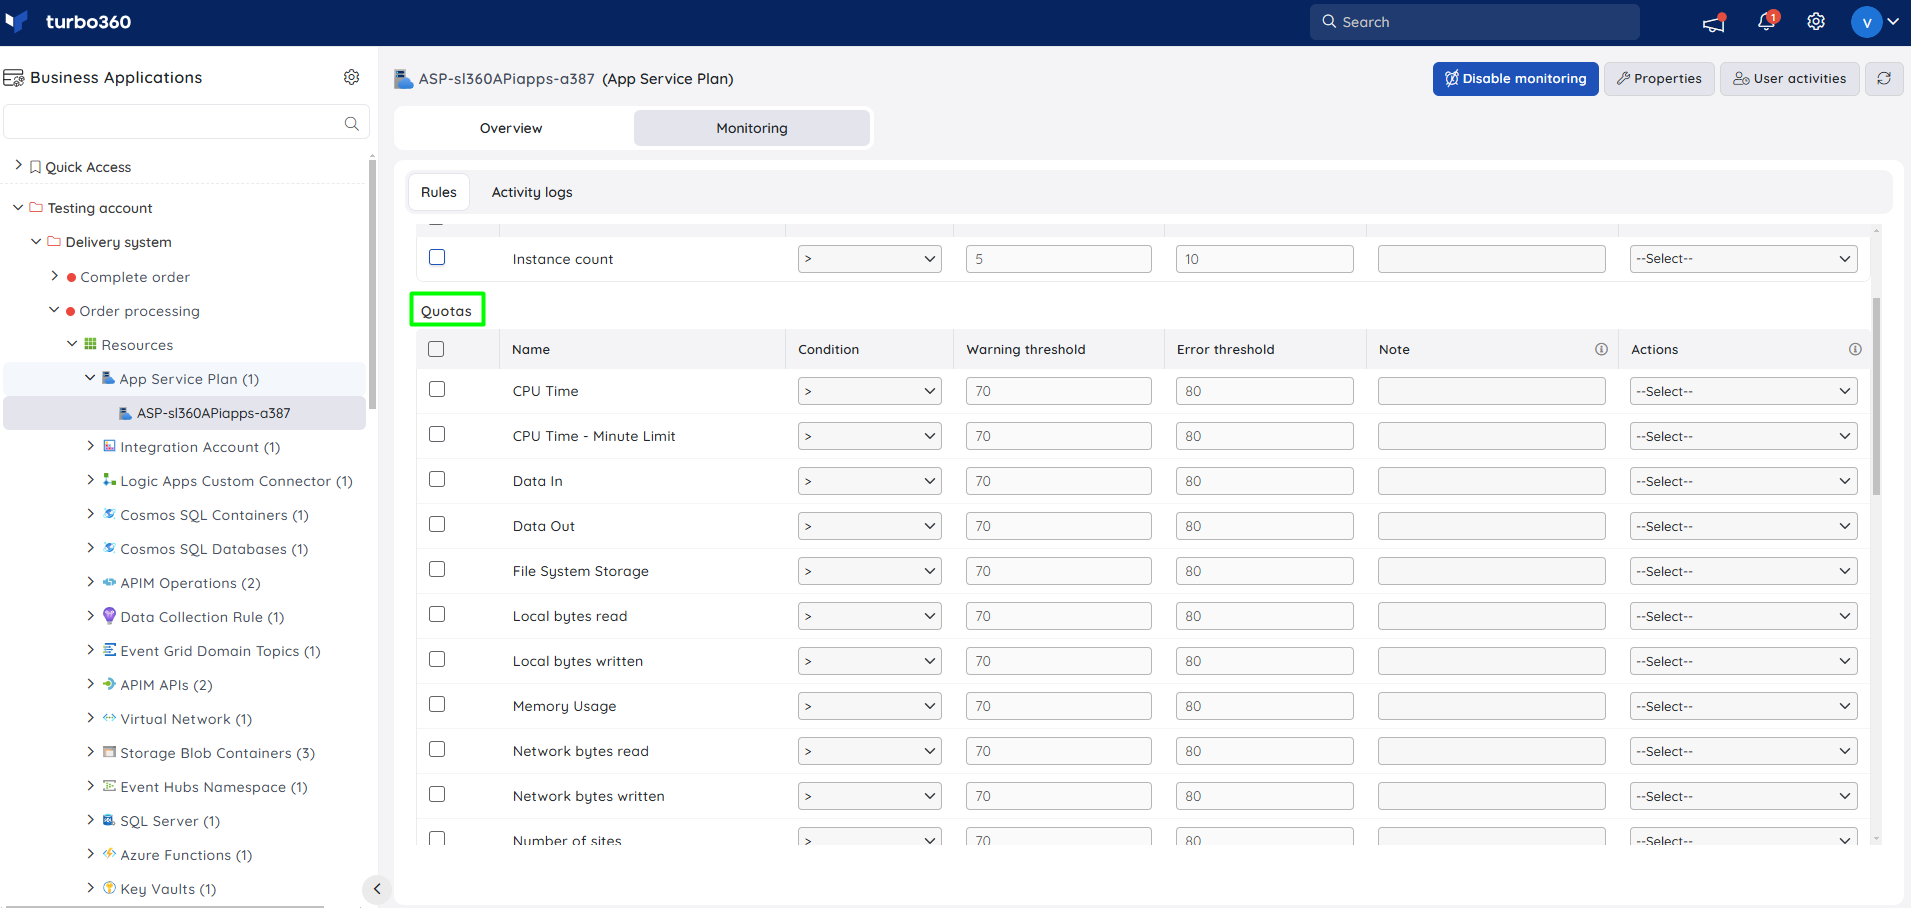
Quotas monitoring
Quotas monitoring tracks resource consumption limits for the App Service Plan, such as CPU time, memory, and bandwidth. Use quota rules to catch apps that are approaching their allocated limits — for example, alert when CPU time quota consumption reaches 80%, giving you time to investigate a misbehaving app or upgrade the plan before it gets throttled.
- Choose the required quotas exposed by the App Service Plan and configure the threshold values.
- Click Save.
Metric monitoring
Metric monitoring lets you track any Azure metric available for the App Service Plan, such as CPU percentage, memory percentage, and HTTP queue length. Use metric rules for sustained performance monitoring — for example, alert when CPU percentage exceeds 90% for a sustained period, indicating a resource contention issue on the plan that needs investigation or scaling.
- Select the required metrics and configure the threshold values.
- Click Save.
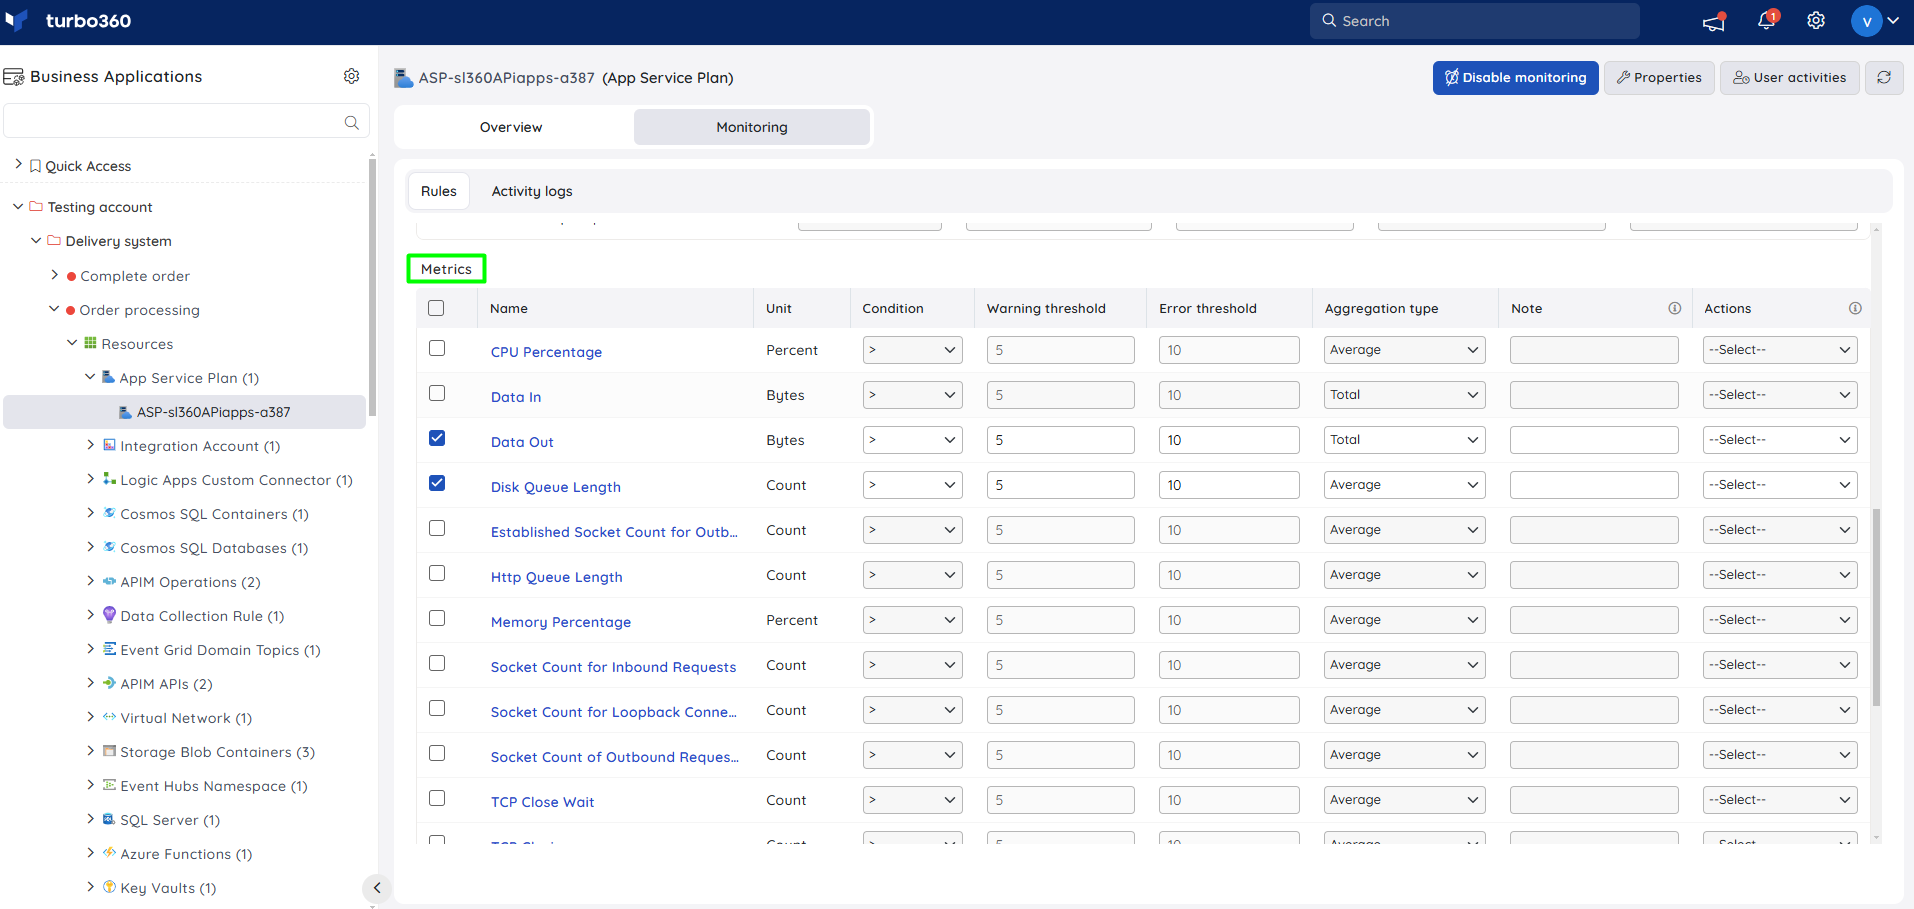
You can also provide a threshold value for any metric name directly, defining the monitoring rule to be violated when that threshold is met.
Troubleshooting
Monitoring state not updating after saving a rule
Cause: The monitoring cycle has not yet completed.
Fix: Wait for the next monitoring cycle. Monitoring state is reflected after each cycle completes.Availability status monitoring not triggering as expected
Cause: The threshold may be configured incorrectly, or the resource health status is not being reported by Azure.
Fix: Verify the threshold under App Service Plan > Monitoring and check the Azure resource health status in the Azure portal.Instance count alert firing unexpectedly
Cause: Dynamic scaling is configured on the plan and load is causing the plan to scale out beyond the configured threshold.
Fix: Review your auto-scale rules in Azure and adjust the instance count threshold in Turbo360 to reflect the expected scaling range.Metric value is not updating
Cause: The Azure metrics API may be delayed, or the resource is not emitting the selected metric.
Fix: Verify that the metric is available for your App Service Plan tier in the Azure portal. Metric availability varies by plan size.Dashboard chart not loading
Cause: The Business Application may not have the App Service Plan associated, or the user does not have the Read permission for App Service Plan.
Fix: Confirm that the App Service Plan is added to your Business Application in Turbo360 and that the user's role includes at least Read for App Service Plan.
Related articles
Was this article helpful?