

Application Insight
- 05 Aug 2026
- 8 Minutes to read
- Print
- DarkLight
- Download PDF
Application Insight
- Updated on 05 Aug 2026
- 8 Minutes to read
- Print
- DarkLight
- Download PDF
Article summary
Did you find this summary helpful?
Thank you for your feedback!
Overview
Application Insight is an Azure performance management service for web applications. Within Turbo360's Business Applications module, Application Insights resources give you access to query-based analytics, a pre-built resource dashboard, and monitoring rules — all from within your business application context.
Business value
Integrating Application Insights with Turbo360 eliminates the need to switch to the Azure portal for query execution and monitoring configuration. You can run custom queries, visualize results in dashboard widgets, set metric and query-based monitoring thresholds, and receive alerts from a single interface.
How it works
Application Insight works by sending telemetry data from your application to Azure. When an Application Insights resource is added to a business application in Turbo360, it exposes the following capabilities:
- Queries — write, execute, and save custom KQL queries against your telemetry data
- Query library — access preset queries from the Azure portal directly within Turbo360
- Saved queries — store and reuse frequently executed queries; mark any query as a favorite for quick access
- Time range filter — apply a time range to queries to scope results to a specific period
- Resource dashboard — view pre-built metric widgets and add custom query-based widgets for real-time data visualization
- Monitoring rules — configure metric thresholds and query-based monitoring rules; violations are surfaced as alerts after each monitoring cycle
Application Insights resources also support query widgets on the Business Application dashboard. Set the Data source for a widget to Query to use query data instead of metric data.
Count charts do not support Query data sources.
Permissions
Access to Application Insight resources is controlled by the Application Insight resource permission in your Business Applications role.
| Permission | Access granted |
|---|---|
| Read | View the Application Insights resource, run queries, and view the resource dashboard |
| Manage | Configure monitoring rules and manage query widgets |
The following system-defined roles include Application Insights permissions by default:
| Role | Application Insights permission |
|---|---|
| Owner | Read + Manage |
| Contributor | Read + Manage |
| Reader | Read |
Operations
Turbo360 exposes the Application Insights query interface directly within your Business Application, so you can interrogate telemetry, investigate issues, and build reusable queries without leaving your operational context. The typical workflow is: discover useful queries in the library → save the ones you'll reuse → run them on demand with a time range scoped to the investigation.
Run queries
Use the query editor to write and execute KQL queries against your Application Insight telemetry. This is the primary way to investigate issues in real time — for example, filtering exceptions by operation name to identify which endpoint is generating errors, or checking dependency call durations to locate a slow downstream service.
- Navigate to the Application Insight resource in your business application.
- Go to the Queries section.
- Enter your query in the query field.
- Select the output format: table, line, bar, column, donut, or area.
- Apply a time range filter if required.
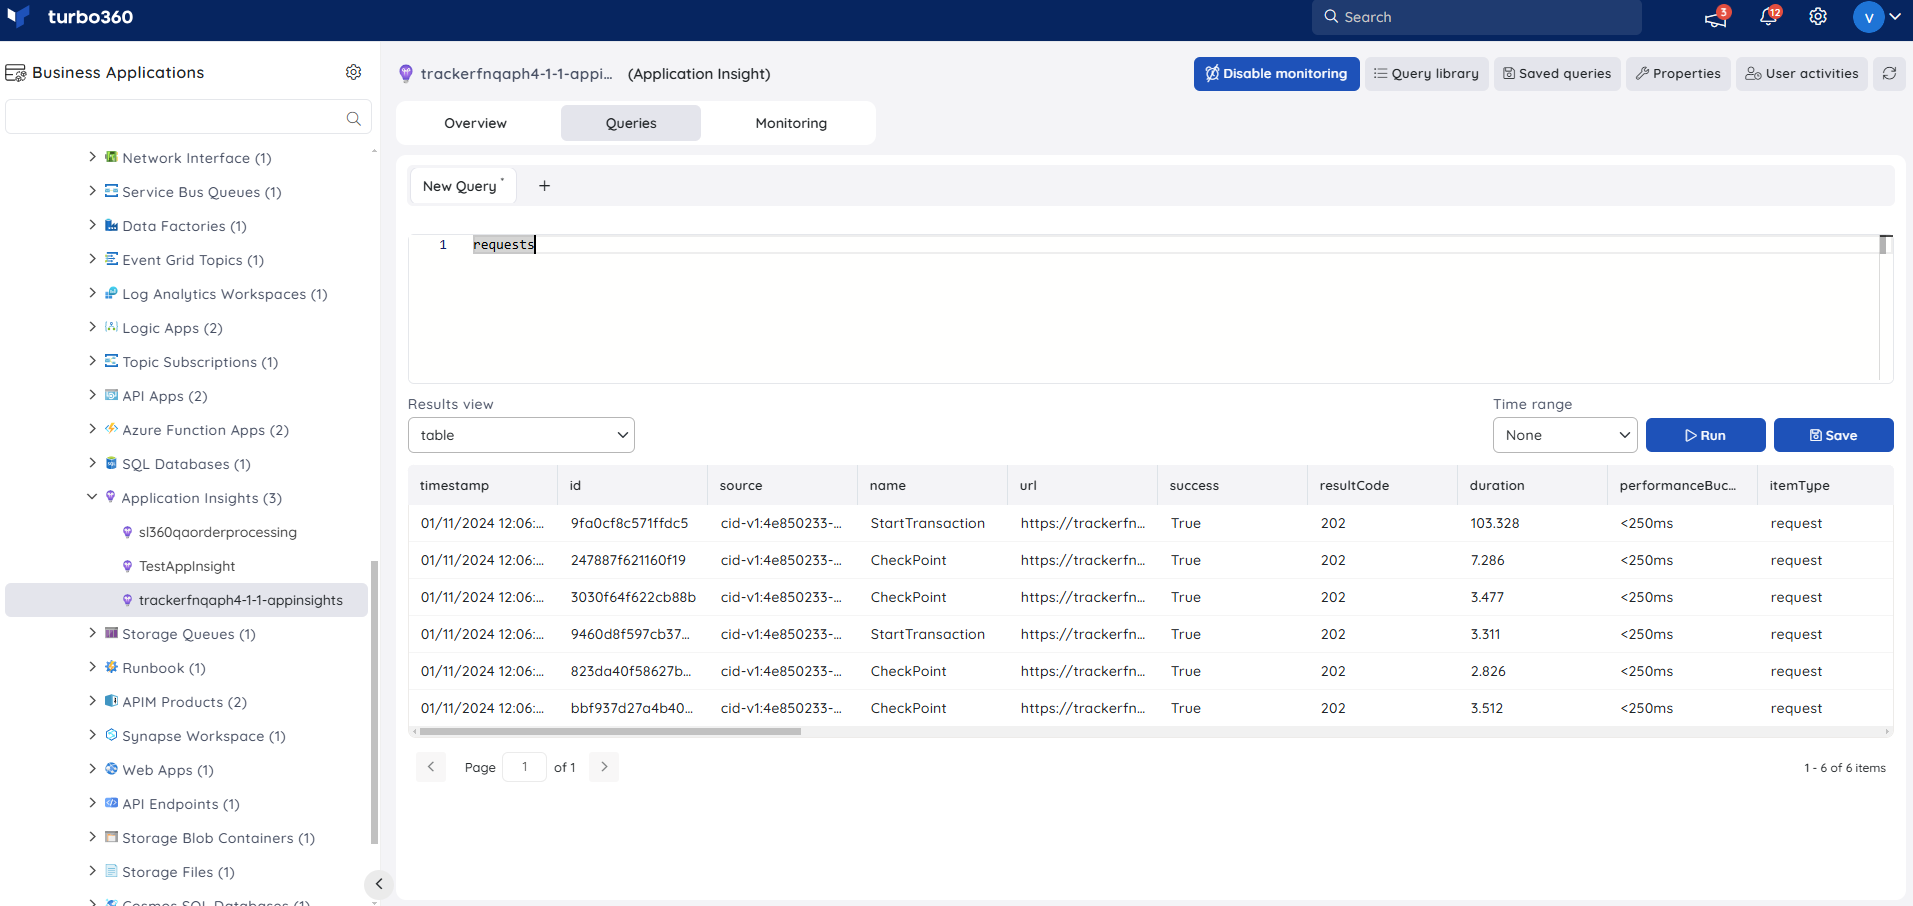
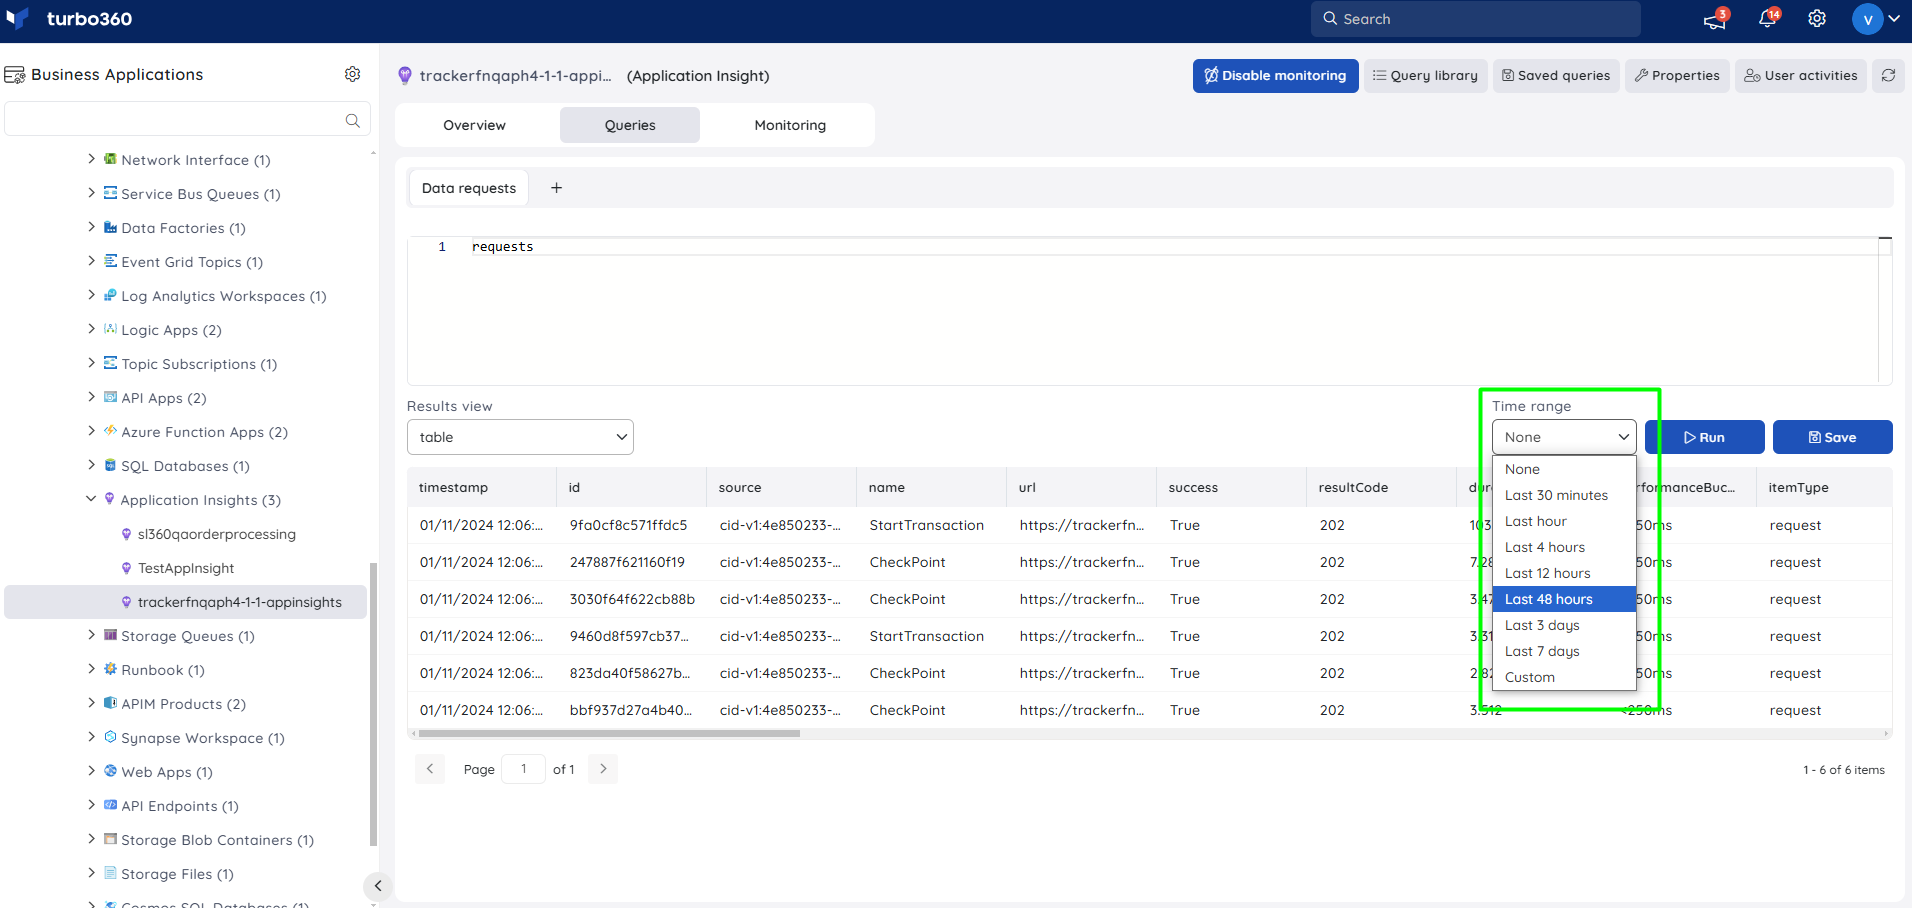
Apply a time range
A time range filter scopes your query results to a specific period, which is useful when investigating incidents with a known start time or comparing behavior across different time windows. You can embed the time range directly in the query, or select it from the time range filter.
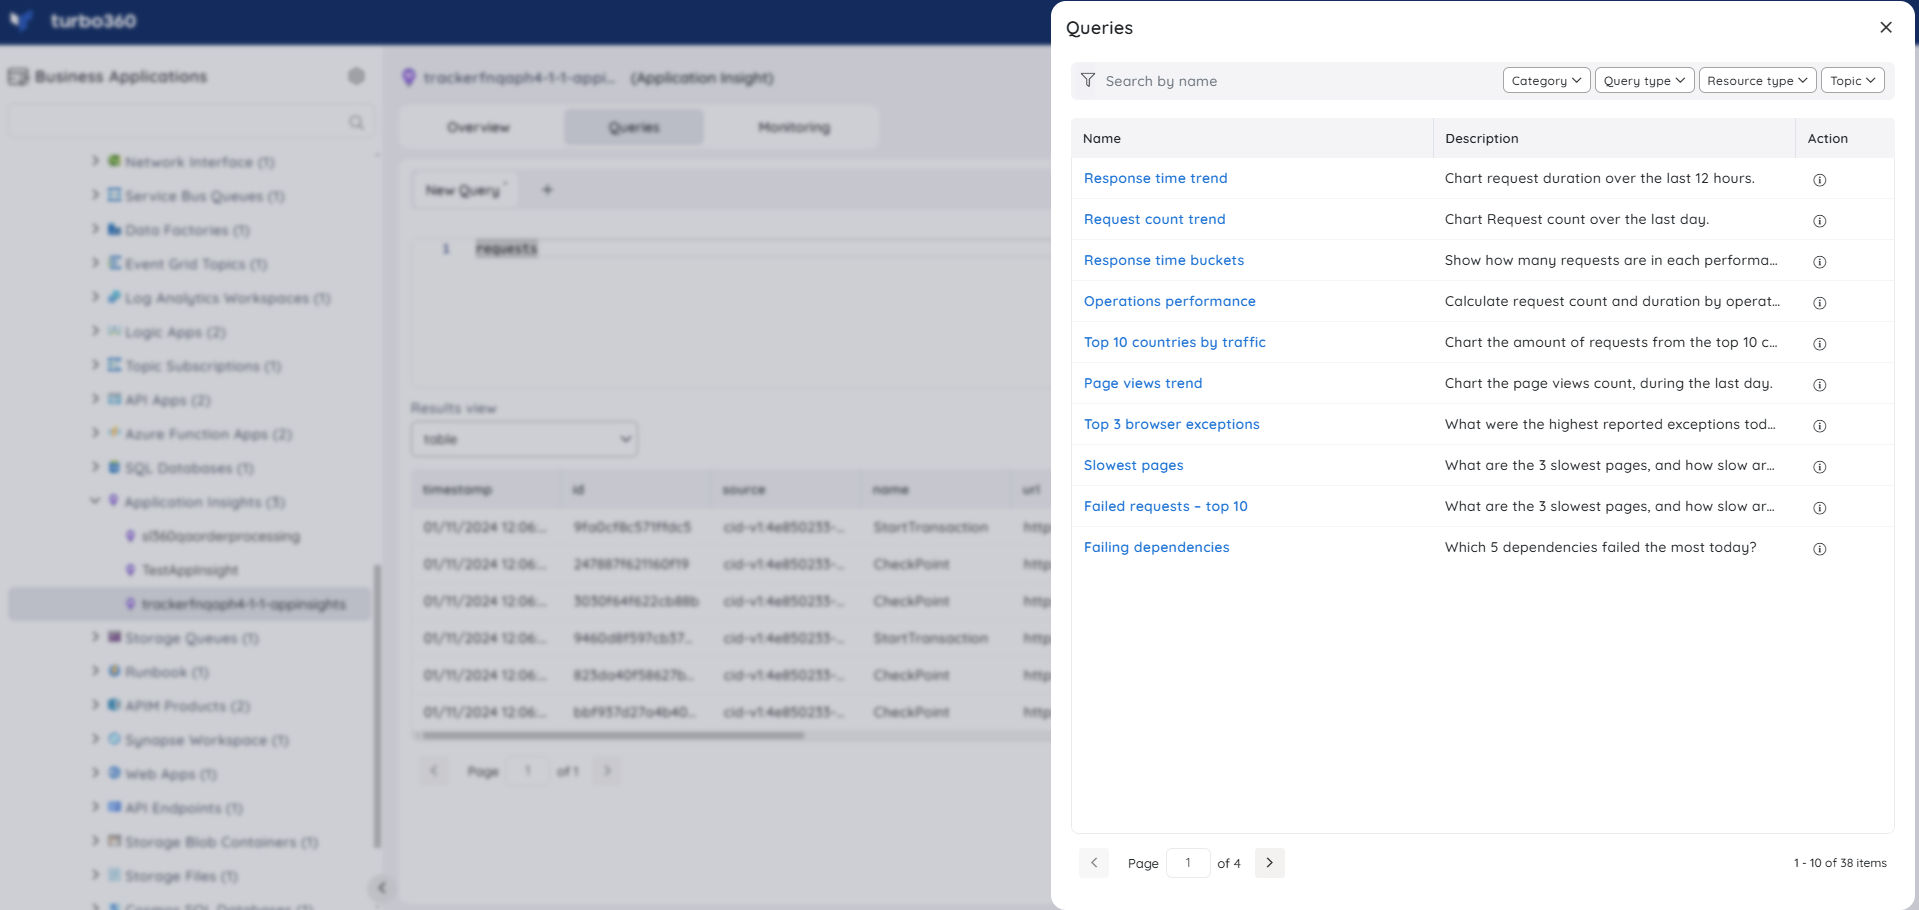
Use the query library
The query library surfaces the same preset queries available in the Azure portal, without leaving Turbo360. Use it when you're starting an investigation and aren't sure which query to write — the library gives you a set of well-known starting points for common telemetry scenarios that you can run immediately or save for later use.
- Open Query library in the Queries section.
- Browse the available preset queries.
- Click the Save icon on any query to add it to your saved queries.
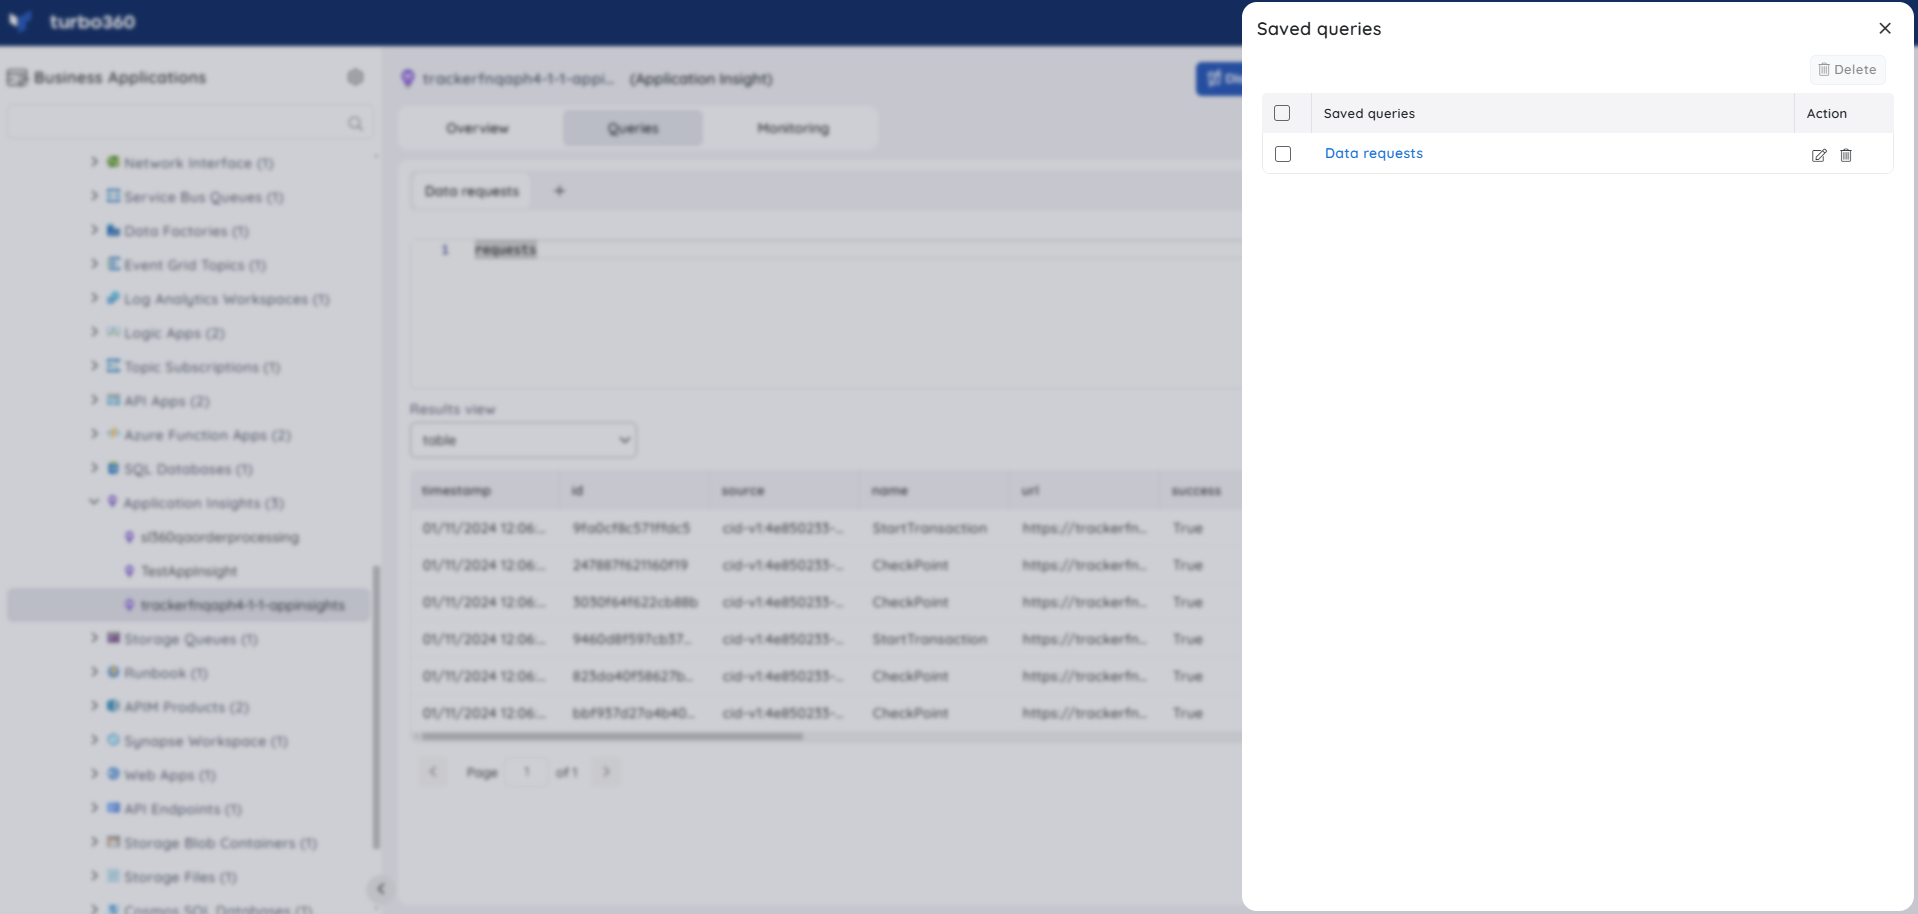
Manage saved queries
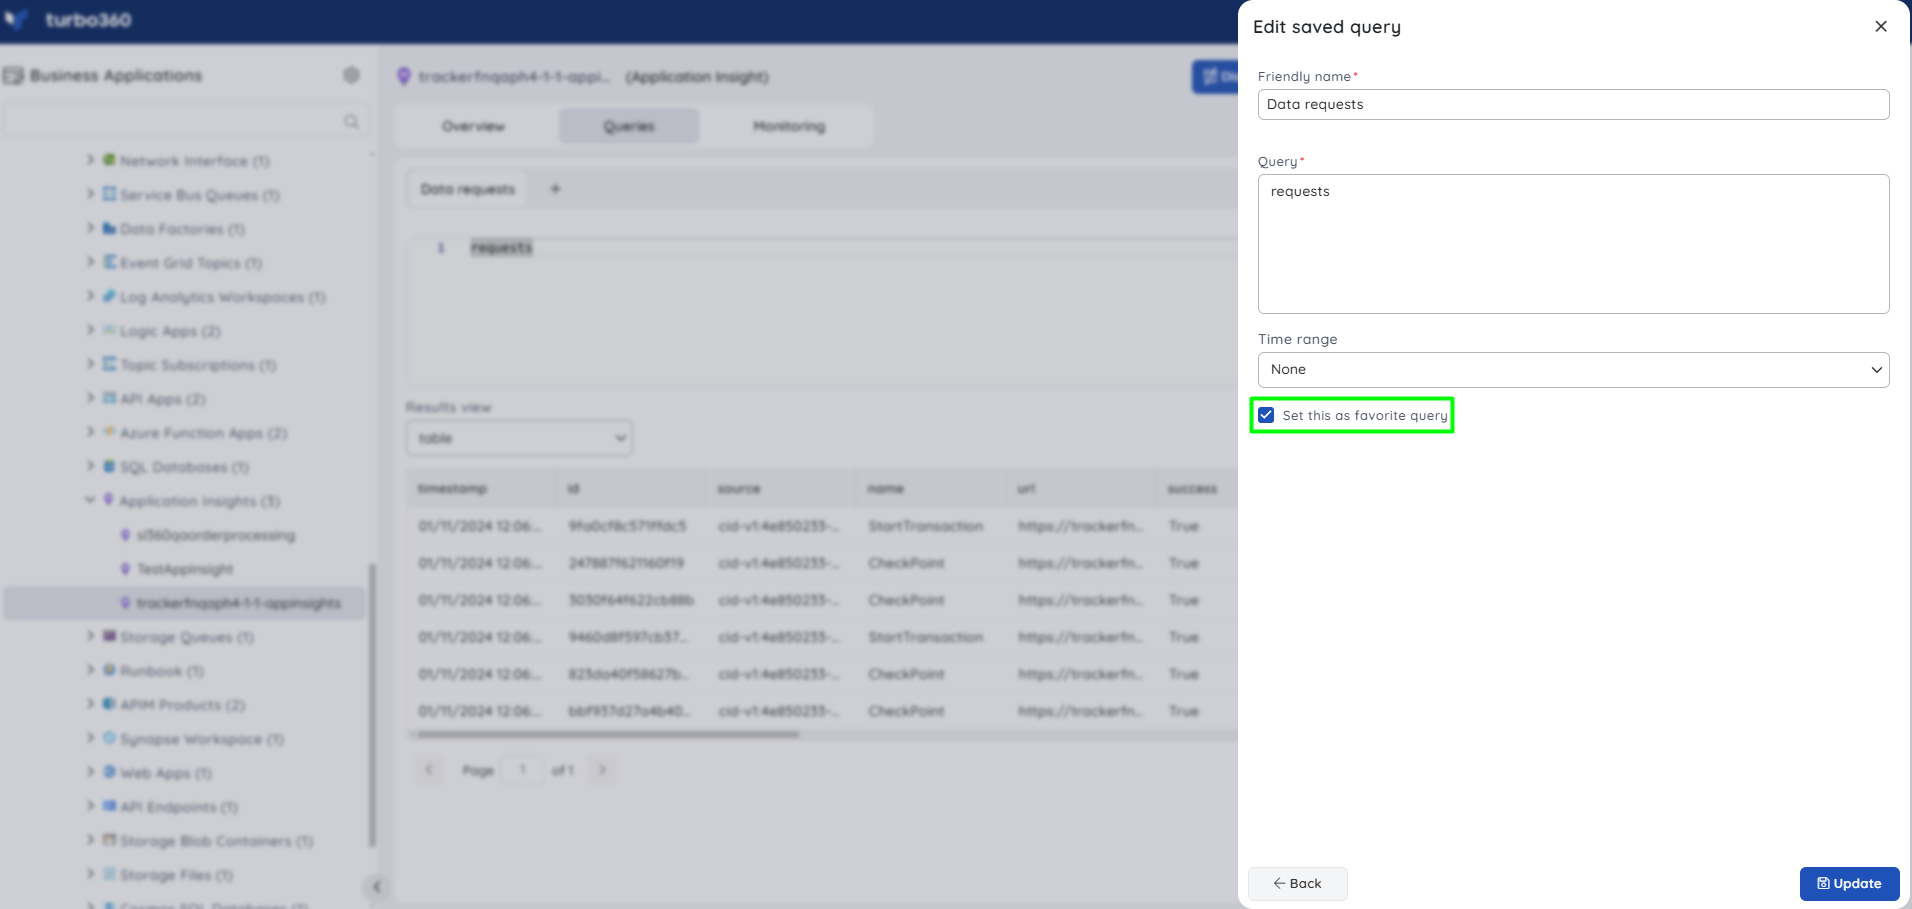
Saved queries let you build a personal library of queries you run repeatedly — for example, a query that counts failed requests by dependency type, or one that filters exceptions to a specific user session. Mark any saved query as a favorite to pin it to the top of the Queries section for quick access during incidents.
- Open Saved queries in the Queries section to view, edit, or update existing saved queries.
- To mark a query as a favorite, enable the Favorite option when saving or editing it.
Resource dashboard
The Application Insight resource dashboard gives you a real-time view of application health and reliability — covering availability, error rates, dependency failures, and performance — without needing to run queries manually.
The following widgets are available by default:
| Widget | What it shows |
|---|---|
| Dependency Call Failures | Count of failed calls to external dependencies (databases, APIs, services) — useful for identifying downstream failures affecting your application |
| Exception Rate | Rate of unhandled exceptions thrown by the application, useful for tracking code-level error trends over time |
| Failed Requests | Count of HTTP requests that resulted in a failure response, indicating user-facing errors |
| Exceptions | Total count of exceptions captured by Application Insights, including both handled and unhandled |
| Browser Exceptions | Count of JavaScript exceptions thrown in the browser, useful for diagnosing client-side errors |
| Server Exceptions | Count of exceptions thrown on the server side, useful for isolating backend failures from frontend ones |
| Availability | Result of availability tests configured in Application Insights — shows whether the application is reachable from external test locations |
| Performance | Summary of server response times, useful for identifying slow requests and performance regressions |
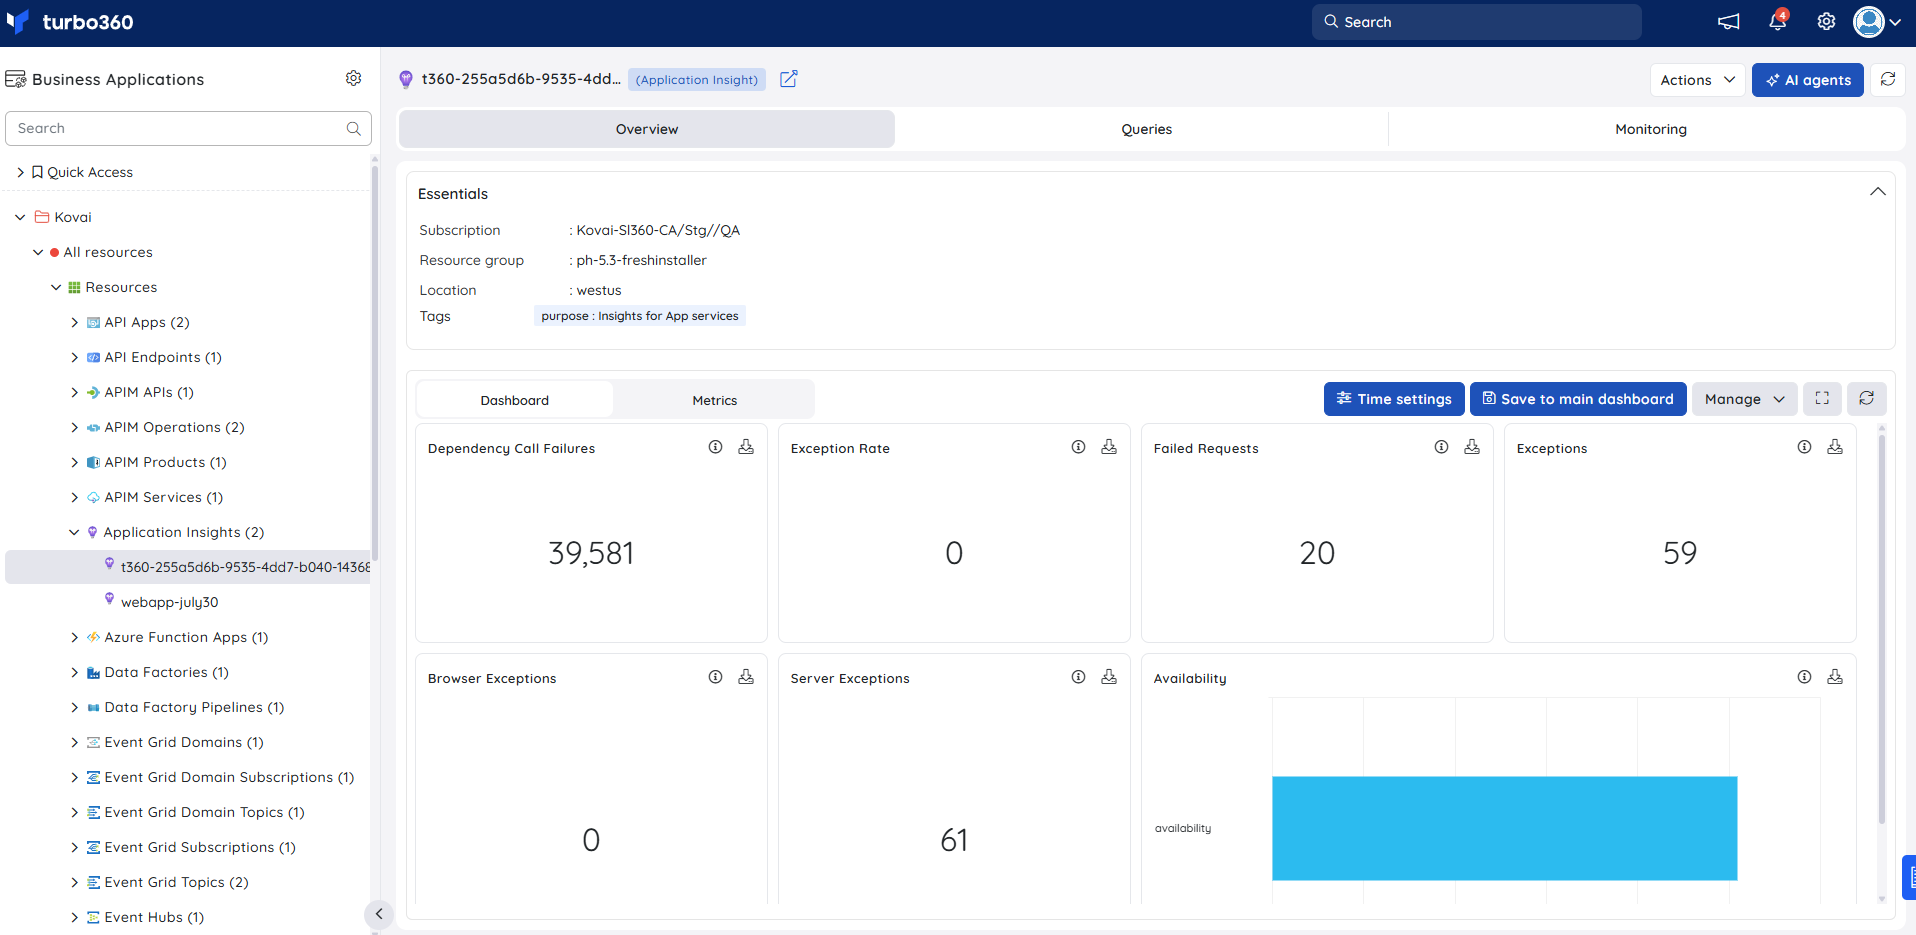
You can add, remove, or reconfigure widgets to focus on the metrics most relevant to your support scenario.
Add query widgets to dashboards
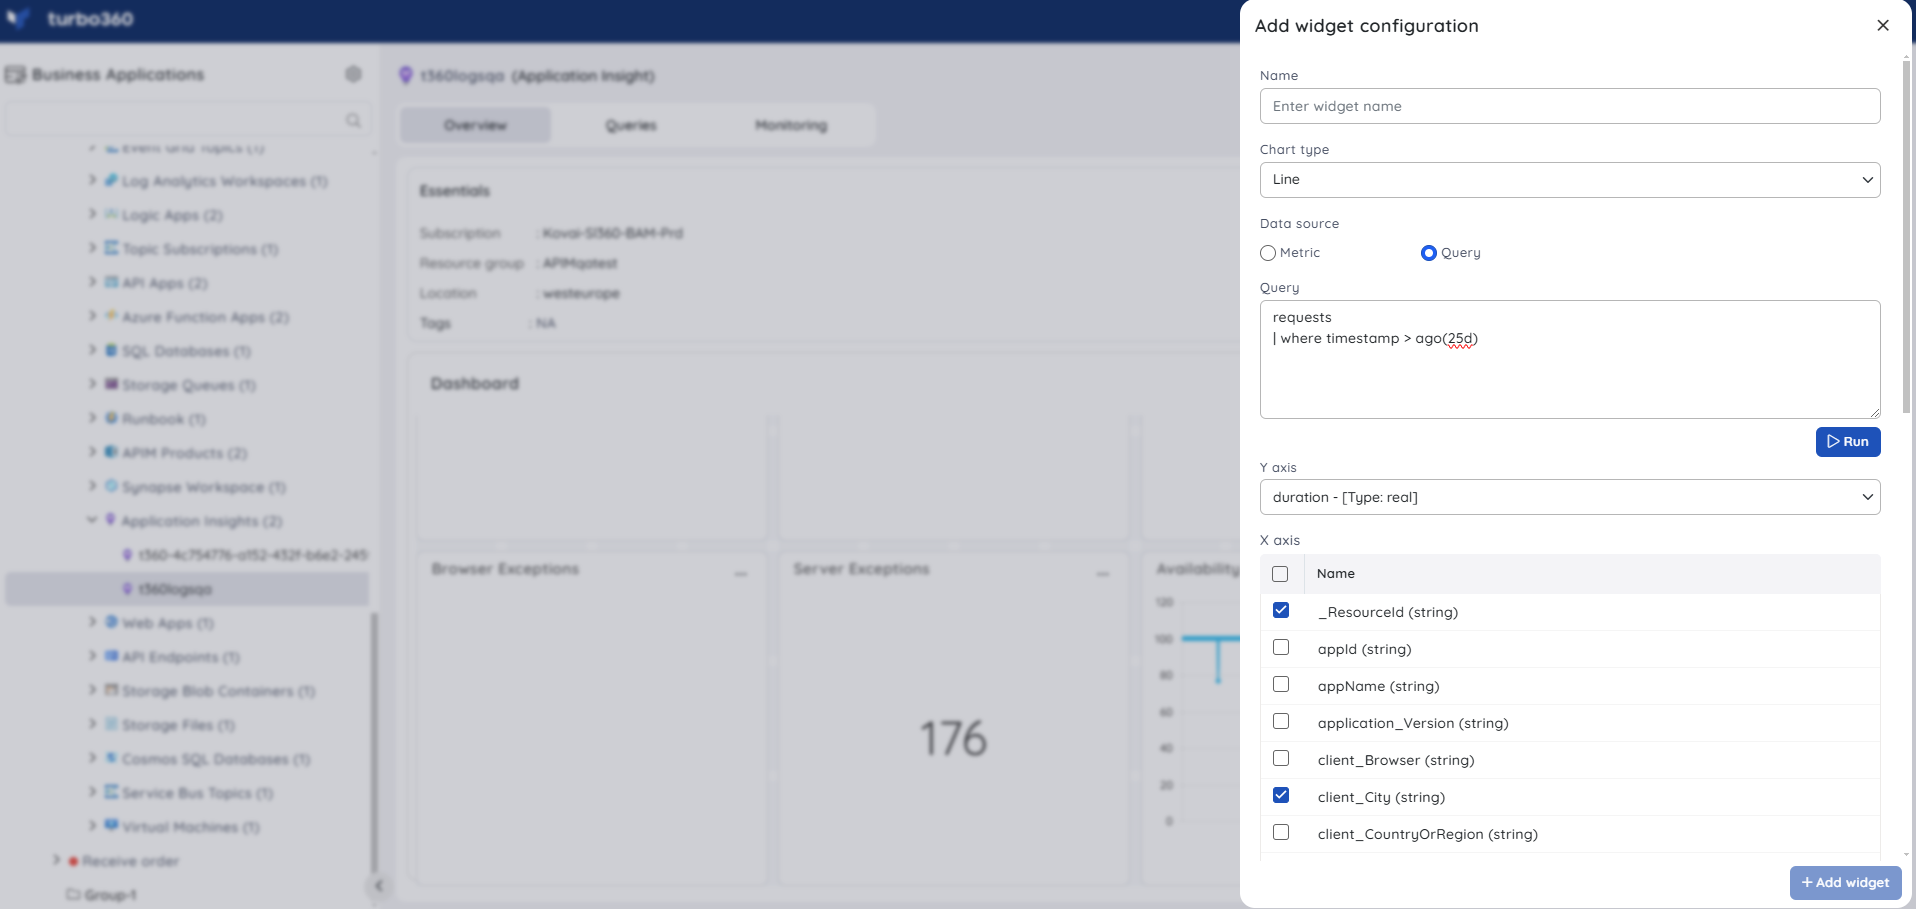
Queries can power real-time dashboard widgets on both the Business Application dashboard and the resource dashboard.
- Open the widget configuration for the Application Insights resource.
- Set Data source to Query.
- Enter a valid query in the query field.
- Click Run.
- Select the appropriate labels from the Y-axis dropdown and X-axis checkboxes to customize the chart axes.
Note:
Query widgets do not display time settings information in their tooltip. Data is generated for the desired query only, regardless of time settings configuration.
Metrics
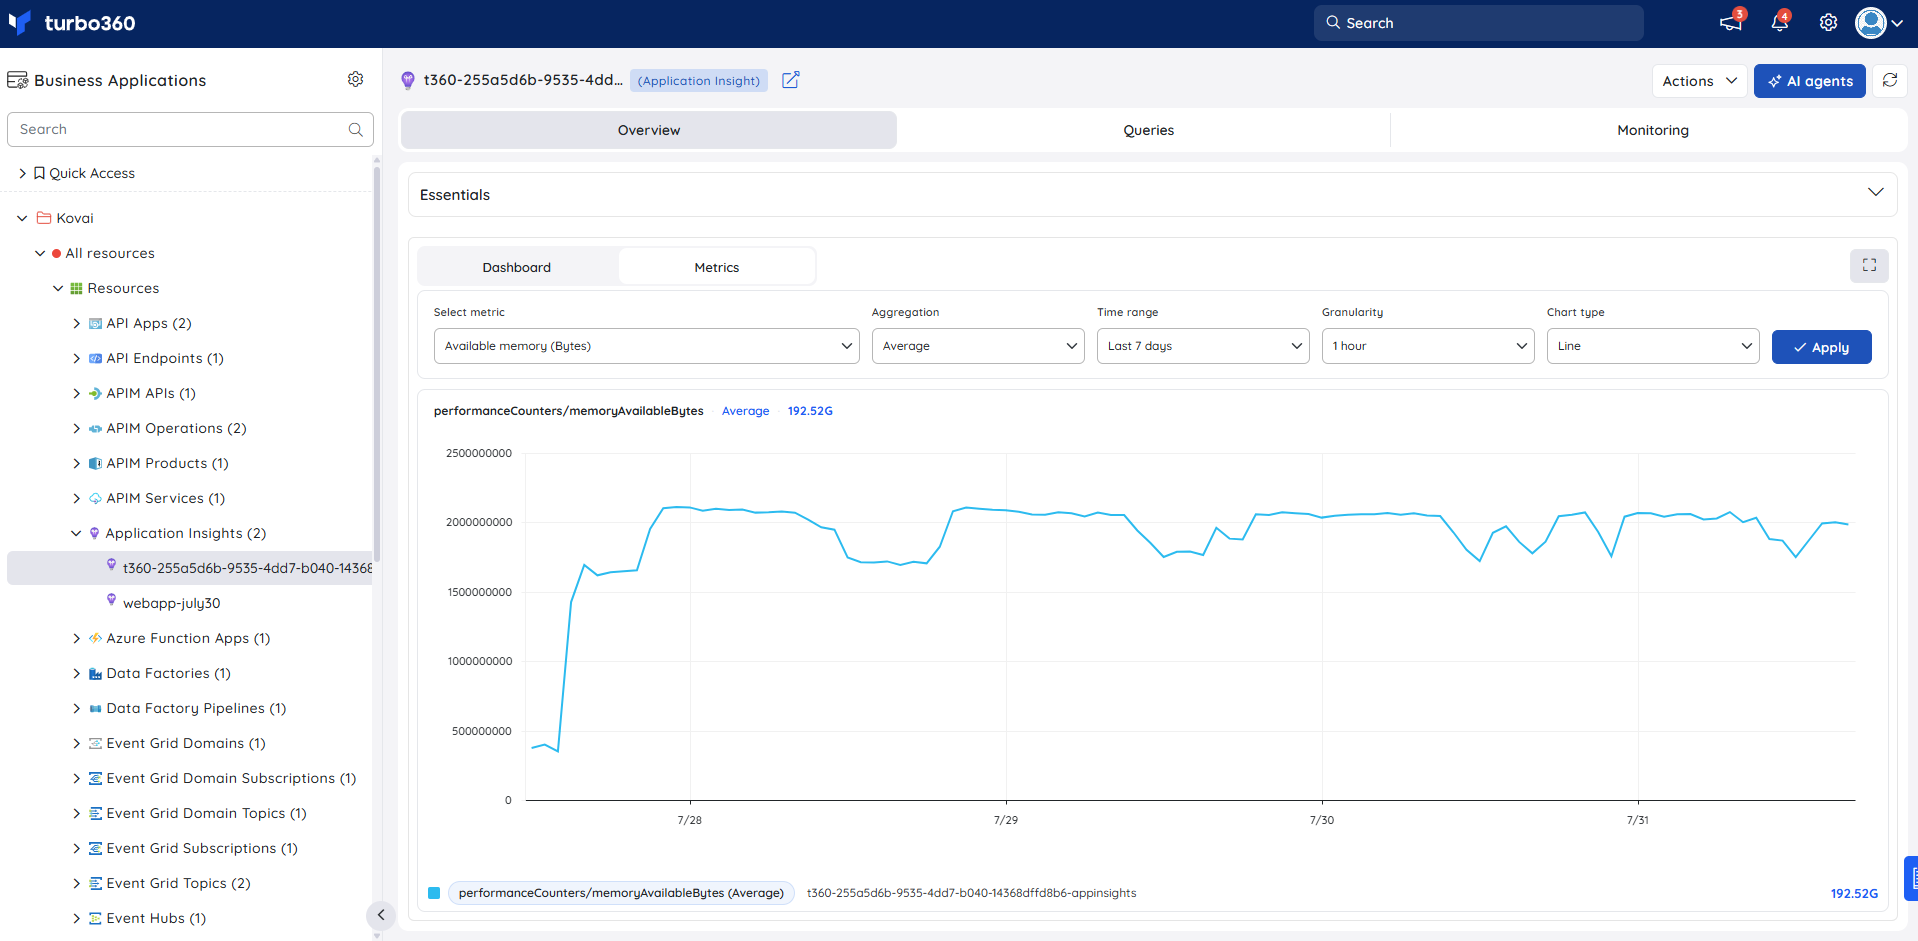
The Metrics tab lets you chart Azure Monitor metrics for your Application Insight resource directly in Turbo360, without switching to the Azure portal. Use it to visualize application availability trends, server response time distributions, and exception rates over time — complementing your KQL queries with a quick visual summary of key health signals across any time window.
Use the following controls to build your chart:
| Control | Description |
|---|---|
| Select metric | Choose the Azure metric to visualize (e.g. Requests, Failed Requests, Server Response Time, Availability Results Availability Percentage, Exceptions). |
| Aggregation | Set the aggregation method: Average, Min, Max, Total, or Count. |
| Time range | Set the time window for the data (e.g. Last 24 hours, Last 7 days). |
| Granularity | Set the data point resolution (e.g. 1 minute, 1 hour). |
| Chart type | Choose the visualization type: Line or Bar. |
Click Apply to render the chart.
Monitoring
Application Insight supports metric and query monitoring rules. Navigate to Application Insight > Monitoring to configure rules.
Note:
Monitoring rules are saved for Application Insights. The monitoring state updates after every monitoring cycle.
Metric monitoring
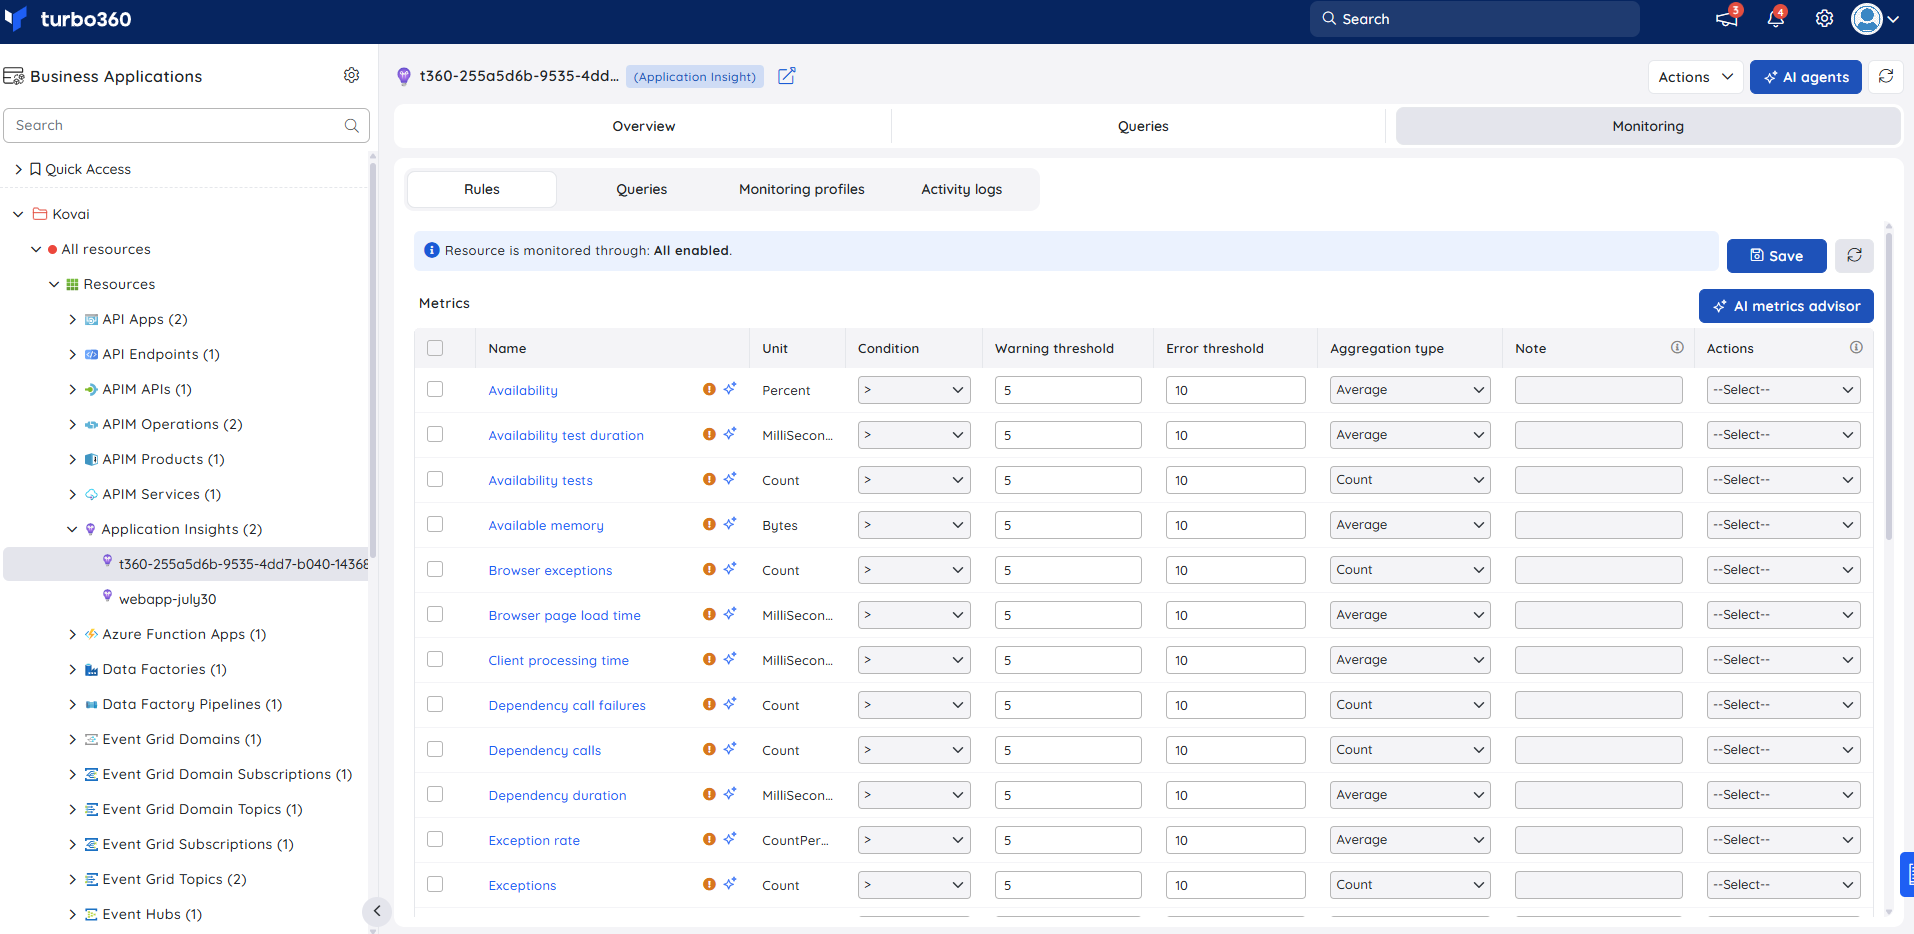
Metric monitoring tracks Azure platform metrics exposed by the Application Insight resource, such as availability, exception rates, and failed request counts. Use metric rules to establish a health baseline for your application — for example, alert when the exception rate exceeds a threshold, indicating a code-level issue that may not yet be visible to end users.
- Switch to the Metrics and properties tab.
- Select the monitoring metrics and configure the threshold values.
- Click Save.
You can provide threshold values for any metric name. The rule triggers when the metric value meets the configured threshold.
Query monitoring
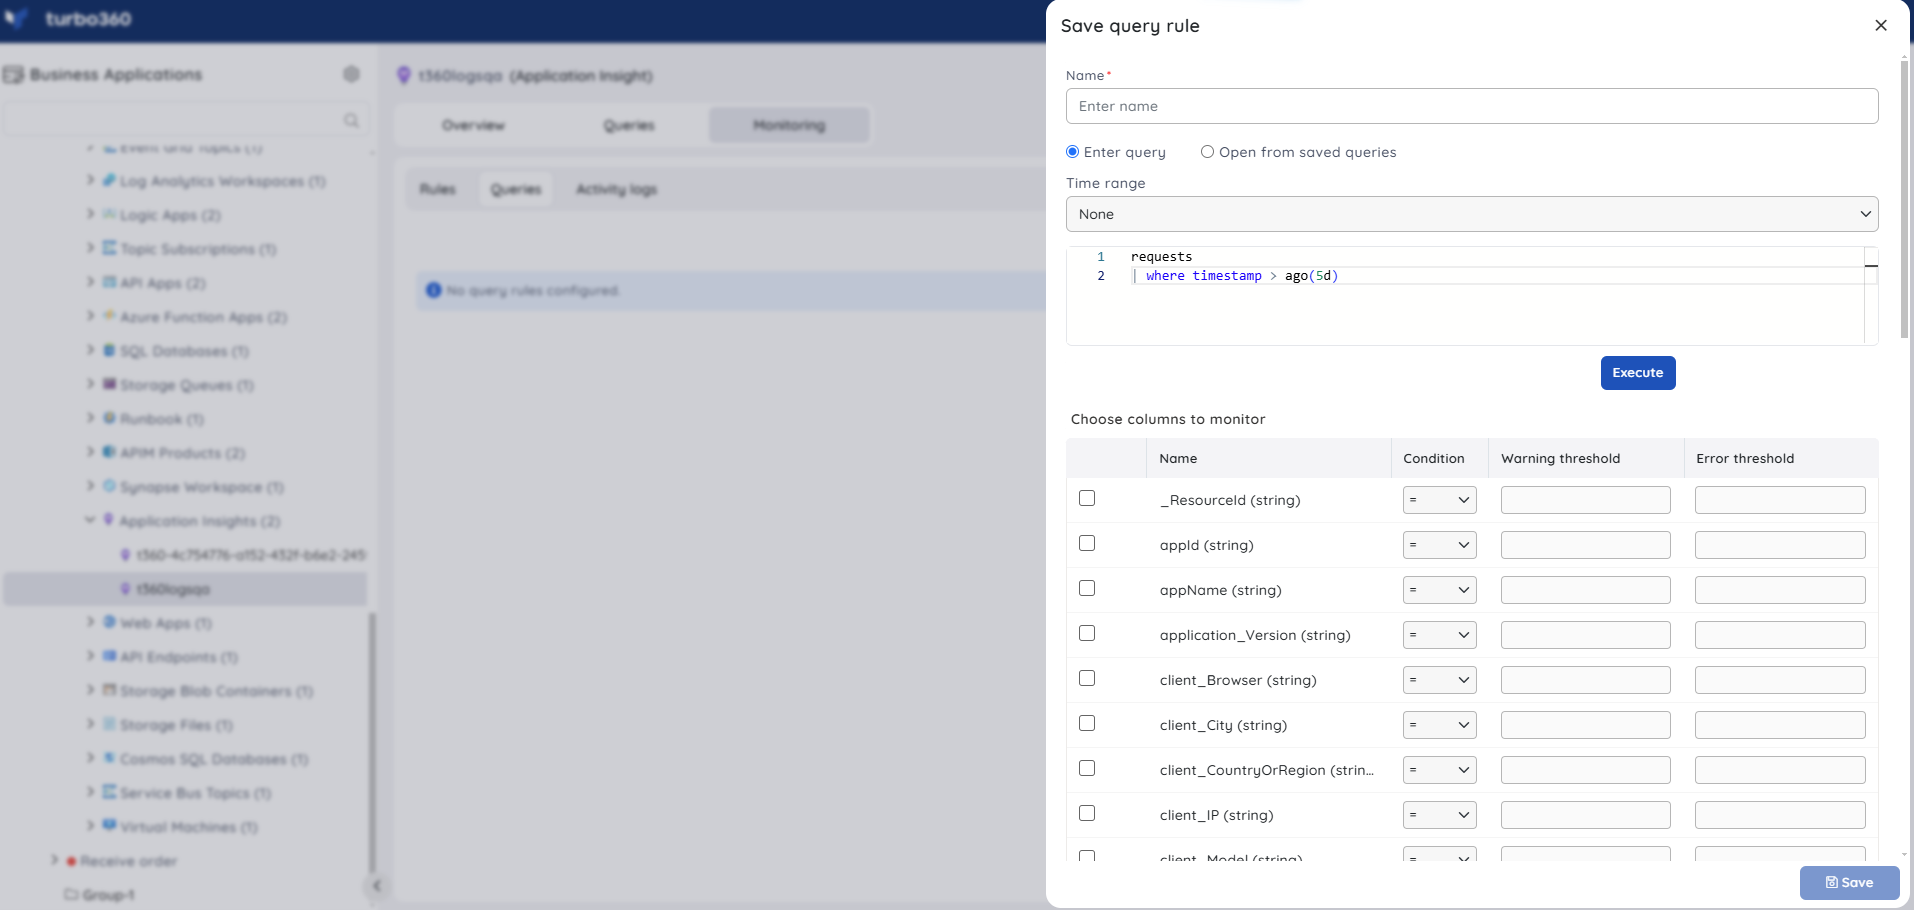
Query monitoring lets you define custom alert conditions using KQL queries against your Application Insight telemetry. Use query rules for precise, context-aware alerting that metric thresholds cannot provide — for example, alert when the count of failed dependency calls to a specific external service exceeds a threshold in the last 15 minutes, isolating third-party failures from your own application errors. Application Insights supports both scalar and non-scalar queries for query monitoring.
- Switch to the Queries tab.
- Click Add.
- Enter a name for the query rule.
- Enter a query by selecting Enter query, or choose a saved query by selecting Open from saved queries.
- Select the preferred time range.
- Click Execute to run the query.
- Select the required query columns and configure the threshold values.
- To include a query link in the alert, enable the Add query link in alert checkbox and select a saved query.
- To include query results in the alert, enable the Add query result in alert checkbox, execute or select a saved query, and choose the columns to display.
- Click Save.
Note:
Query monitoring starts once the rules are saved. The query monitoring state updates after every monitoring cycle.
Troubleshooting
Query returns no results despite valid syntax
Cause: The selected time range may not include the relevant telemetry, or the query targets a table that has no data for this resource.
Fix: Expand or adjust the time range filter, and confirm the target table contains data for this Application Insight resource in the Azure portal.Query monitoring rule not triggering
Cause: The query result shape does not match the expected scalar or non-scalar format, or the threshold configuration is incorrect.
Fix: Re-run the query manually using Execute to confirm its output, and verify the threshold value configured under the Queries tab.Query widget shows stale or no data on the dashboard
Cause: The Count chart type was selected for a query-based widget, which is not supported, or the query itself returns no rows.
Fix: Use a chart type other than Count for query widgets, and confirm the query returns data when run manually with Execute.Saved query missing from the library
Cause: The query may not have saved successfully, or it was saved without enabling Favorite and is not pinned to the top of the list.
Fix: Re-open Saved queries to confirm it was stored, and mark frequently used queries as Favorite for quick access.
Related articles
Was this article helpful?