

Automatic anomaly detection
- 09 Aug 2026
- 15 Minutes to read
- Print
- DarkLight
- Download PDF
Automatic anomaly detection
- Updated on 09 Aug 2026
- 15 Minutes to read
- Print
- DarkLight
- Download PDF
Article summary
Did you find this summary helpful?
Thank you for your feedback!
Overview
Anomaly detection gives you real-time visibility into unusual Azure cost spikes within a cost management group. It uses your historical spend data to identify cost changes that fall outside a normal pattern, at daily intervals, and alerts you the moment one is detected.
Business value
Anomaly detection removes the need to manually scan cost reports for unexpected spikes. By flagging only statistically significant cost changes, it lets your team react to genuine cost risks faster, without being buried in noise from normal day-to-day fluctuations.
The video below shows how anomaly detection can help.
Prerequisites
Anomaly detection is enabled by default when a cost management group is created. No separate setup is required before configuring it.
Required permissions
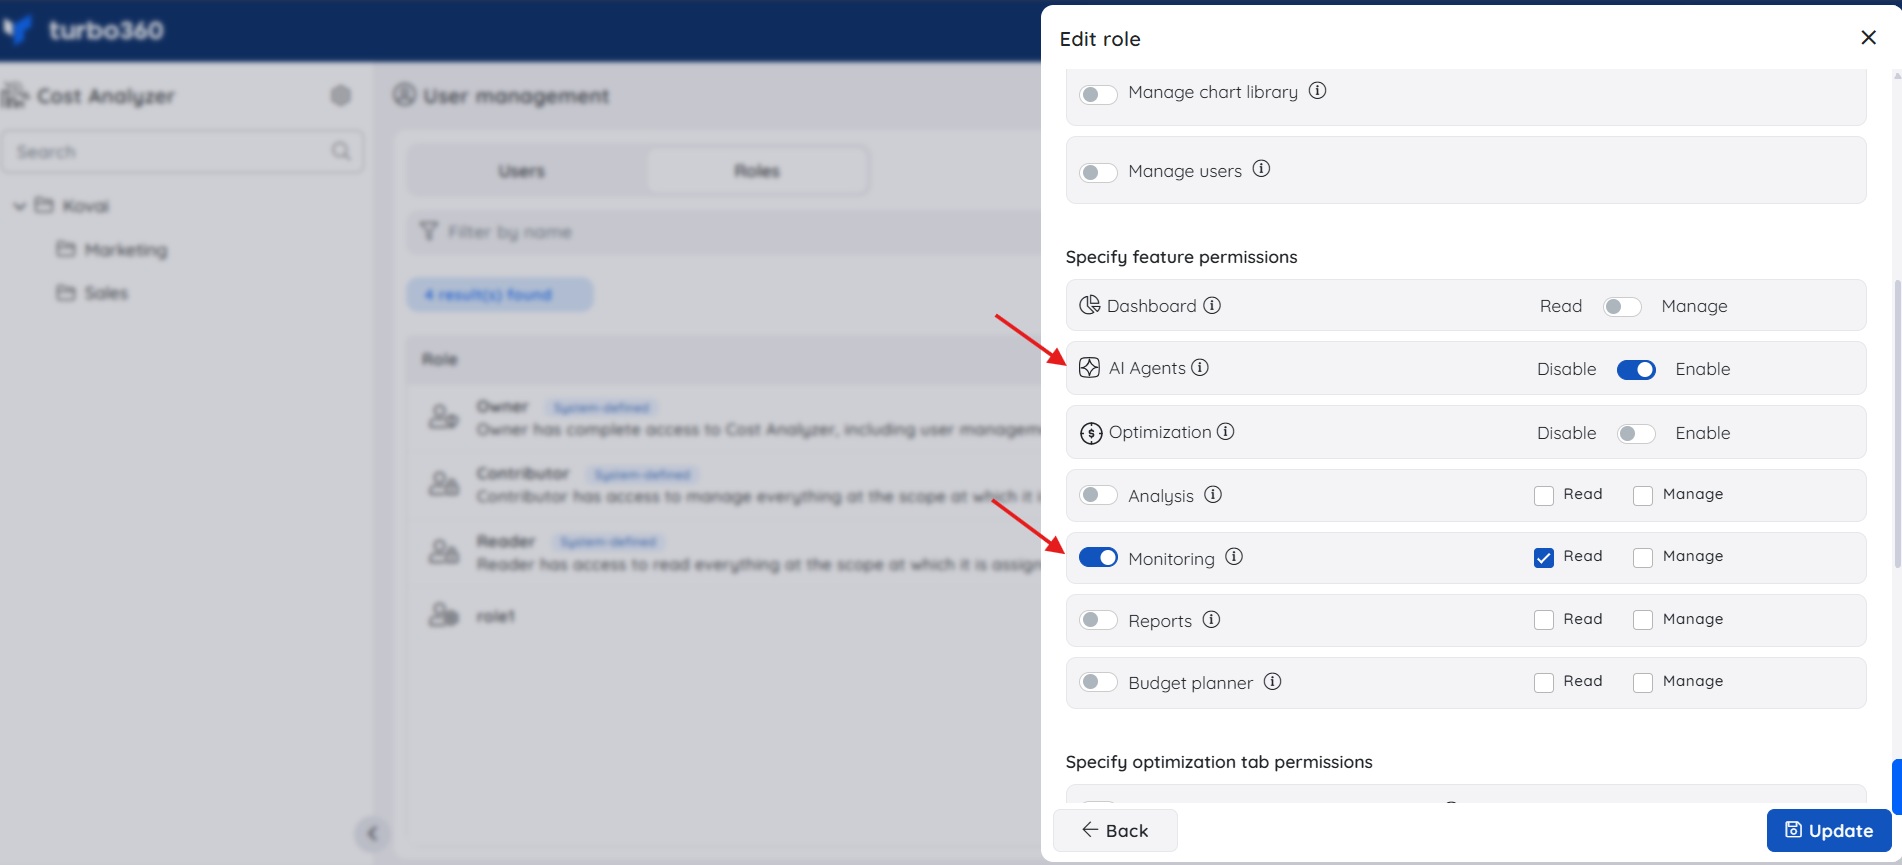
The Monitoring toggle must be enabled for the role before users can access anomaly detection. To enable the toggle, an administrator must edit the role in role management.
| Role | Access |
|---|---|
| Account owner, Owner, Contributor | Full access — can view and configure anomaly detection |
| Custom role with Read | Can view anomaly detection status and alert history; cannot configure |
| Custom role with Manage | Can enable/disable anomaly detection and modify the threshold multiplier or notification channels |
.png)
For Explain with AI access, users also require the AI Agents feature to be enabled for their role, in addition to Monitoring access.
| Role | Permission level | Access |
|---|---|---|
| Account Owner / Owner / Contributor | Full access | Can use Explain with AI on any cost management group |
| Custom role | AI Agents — Enable, Monitoring — Read (or Manage) | When AI Agents is set to Enable and Monitoring is toggled on with at least Read access, the user can open Anomaly Insights; if either is missing, the option is not available |
How it works
Anomaly detection runs at the group level, monitoring subscription costs at the daily interval, using statistical analysis rather than fixed dollar thresholds.
Standard deviation: the basis of detection
Standard deviation measures how much daily cost changes normally vary. A low standard deviation means costs move in small, steady increments; a high standard deviation means costs swing widely. It answers one question: what counts as a normal amount of fluctuation? Only cost changes that fall well outside that normal range are flagged — everyday noise is ignored.
Detection algorithm
- Collect the last 30 days of daily cost data and calculate each day's cost change:
CostChange[day] = Cost[day] – Cost[day-1]. - Compute the standard deviation of those 30 daily changes — this is the baseline for "normal" movement.
- Calculate today's cost change:
TodayChange = Cost[today] – Cost[yesterday]. - Flag an anomaly when:
abs(TodayChange) > (StandardDeviation × ThresholdMultiplier).
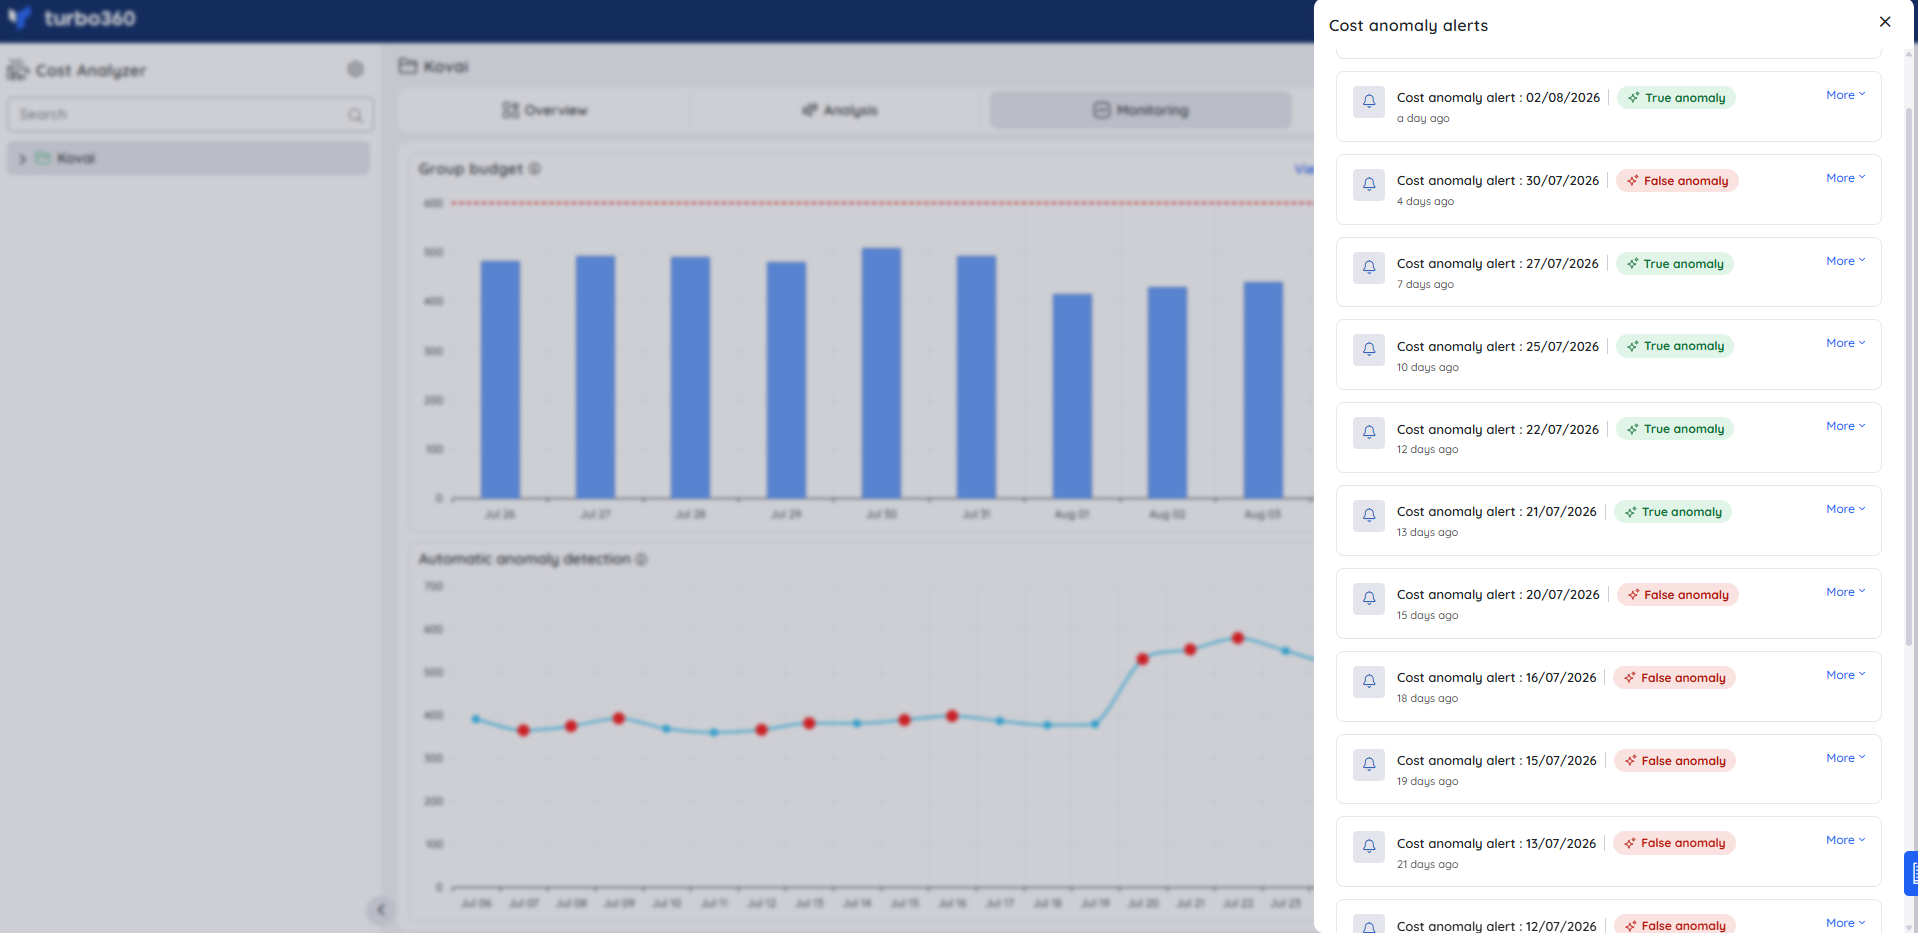
Once an anomaly is identified, Turbo360 inspects the service-level costs within the monitored scope to surface the resources most likely responsible for the spike. When an anomaly is detected, an alert is sent through your configured notification channels and logged as an incident.
Threshold multiplier and sensitivity
The Threshold multiplier scales the standard deviation to set how large a cost change must be before it's flagged. Lower multipliers (1.0–1.5) are more sensitive and surface more alerts, useful for early warning. Higher multipliers (2.0–3.0) are less sensitive and only flag larger spikes.
| Threshold multiplier | Standard deviation | Anomaly threshold (SD × multiplier) | Today's cost change | Alert triggered? | Sensitivity |
|---|---|---|---|---|---|
| 1.0 | 50 | 50 | 120 | Yes | Very sensitive |
| 1.5 | 50 | 75 | 120 | Yes | High sensitivity |
| 2.0 | 50 | 100 | 120 | Yes | Balanced |
| 2.5 | 50 | 125 | 120 | No | Low sensitivity |
| 3.0 | 50 | 150 | 120 | No | Very low sensitivity |
The standard deviation stays fixed at 50 across all rows — only the multiplier changes. The same $120 cost event triggers an alert at a multiplier of 2.0 but not at 2.5, which is why choosing the right value matters.
Recommended starting point: when setting up a new cost management group, start with the threshold multiplier at 1 and observe the kinds of anomalies flagged over time. Once you understand your group's typical cost behavior, tune the multiplier to a level that matches your comfort level for noise versus coverage.
Why the rolling model avoids repeated alerts
Because the standard deviation is recalculated daily from a rolling 30-day window, a single spike doesn't trigger alerts for days afterward — only the day the spike actually occurred. The table below illustrates this using a simplified 7-day window:
| Day | Daily cost ($) | Daily cost change ($) | 7-day std dev of change | Interpretation |
|---|---|---|---|---|
| 7 | 530 | +5 | 4.03 | Low deviation — predictable cost |
| 8 | 590 | +60 | 23.74 | Large spike increases deviation sharply |
| 9 | 600 | +10 | 20.45 | Still high due to recent jump |
| 10 | 605 | +5 | 18.98 | Volatility drops as spike leaves the window |
| 11–14 | — | +2 to +3 | 13.04–17.11 | Settling back to a stable pattern |
With a threshold multiplier of 2.0, only Day 8 crosses its anomaly threshold (47.48) — every other day's change stays below its threshold, even while the standard deviation remains temporarily elevated. This is the key benefit of a rolling model: it catches the genuine spike without punishing the days that follow it with repeated alerts.
Example
Using 7 days of cost data for simplicity (the same logic applies across the standard 30-day window):
| Day | Date | Daily cost ($) |
|---|---|---|
| 1 | 22-Oct | 100 |
| 2 | 23-Oct | 102 |
| 3 | 24-Oct | 101 |
| 4 | 25-Oct | 105 |
| 5 | 26-Oct | 104 |
| 6 | 27-Oct | 160 |
| 7 | 28-Oct | 158 (today) |
The daily cost changes for days 2–7 are [+2, -1, +4, -1, +56, -2].
- Mean change: (2 − 1 + 4 − 1 + 56 − 2) ÷ 6 = 9.67
- Standard deviation: ≈ 20.82 (calculated from the squared deviations of each change from the mean)
- Today's change: -2. With a threshold multiplier of 2.0, the anomaly threshold is 20.82 × 2.0 = 41.64. Since
abs(-2) = 2 < 41.64, today is not flagged. - Yesterday's change: +56, against the same 41.64 threshold. Since
abs(56) = 56 > 41.64, the jump from $104 to $160 would have been flagged as an anomaly the day it occurred.
AI classification and severity
After an anomaly is flagged, Turbo360 uses AI to assess whether it's a genuine cost anomaly or a false positive, and assigns it a severity.
- AI classification — each anomaly is evaluated as Verified by AI (the AI confirms it's genuine) or Not verified by AI (the AI judges it a likely false positive).
- Severity — each anomaly is assigned one of four severities: Info, Warning, Issue, or Critical.
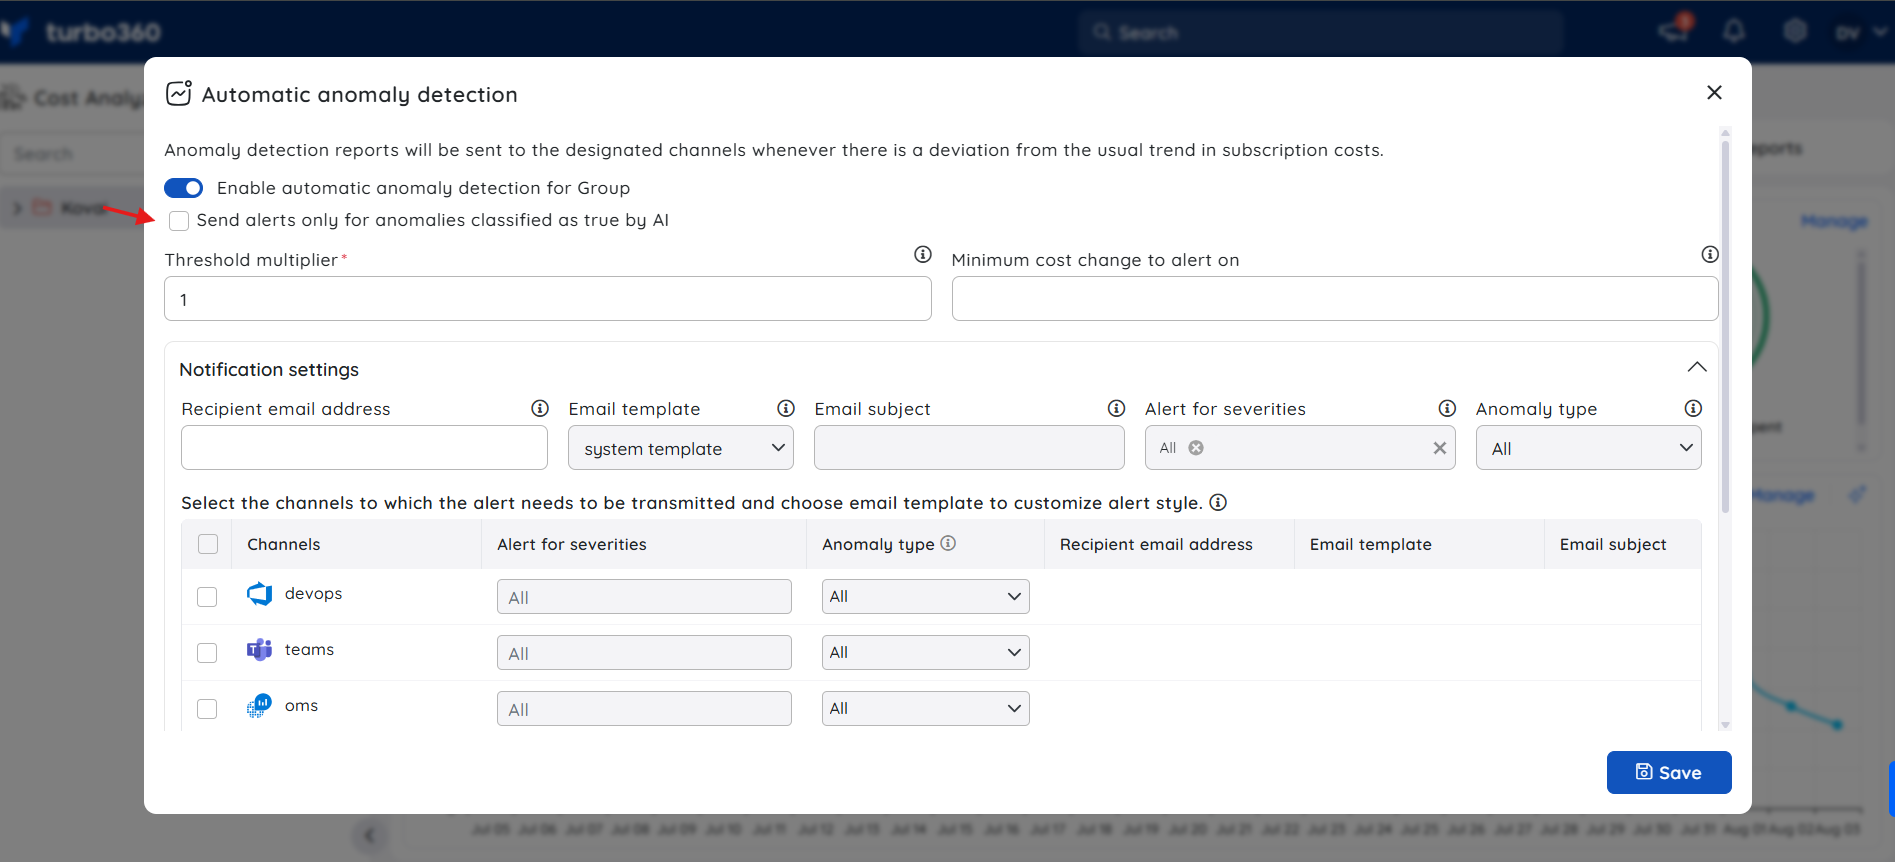
- Send alerts only for anomalies classified as true by AI — when this option is enabled, only AI-verified anomalies are recorded and sent to notification channels. When disabled, both AI-verified and AI-classified false anomalies are recorded and sent to configured channels.
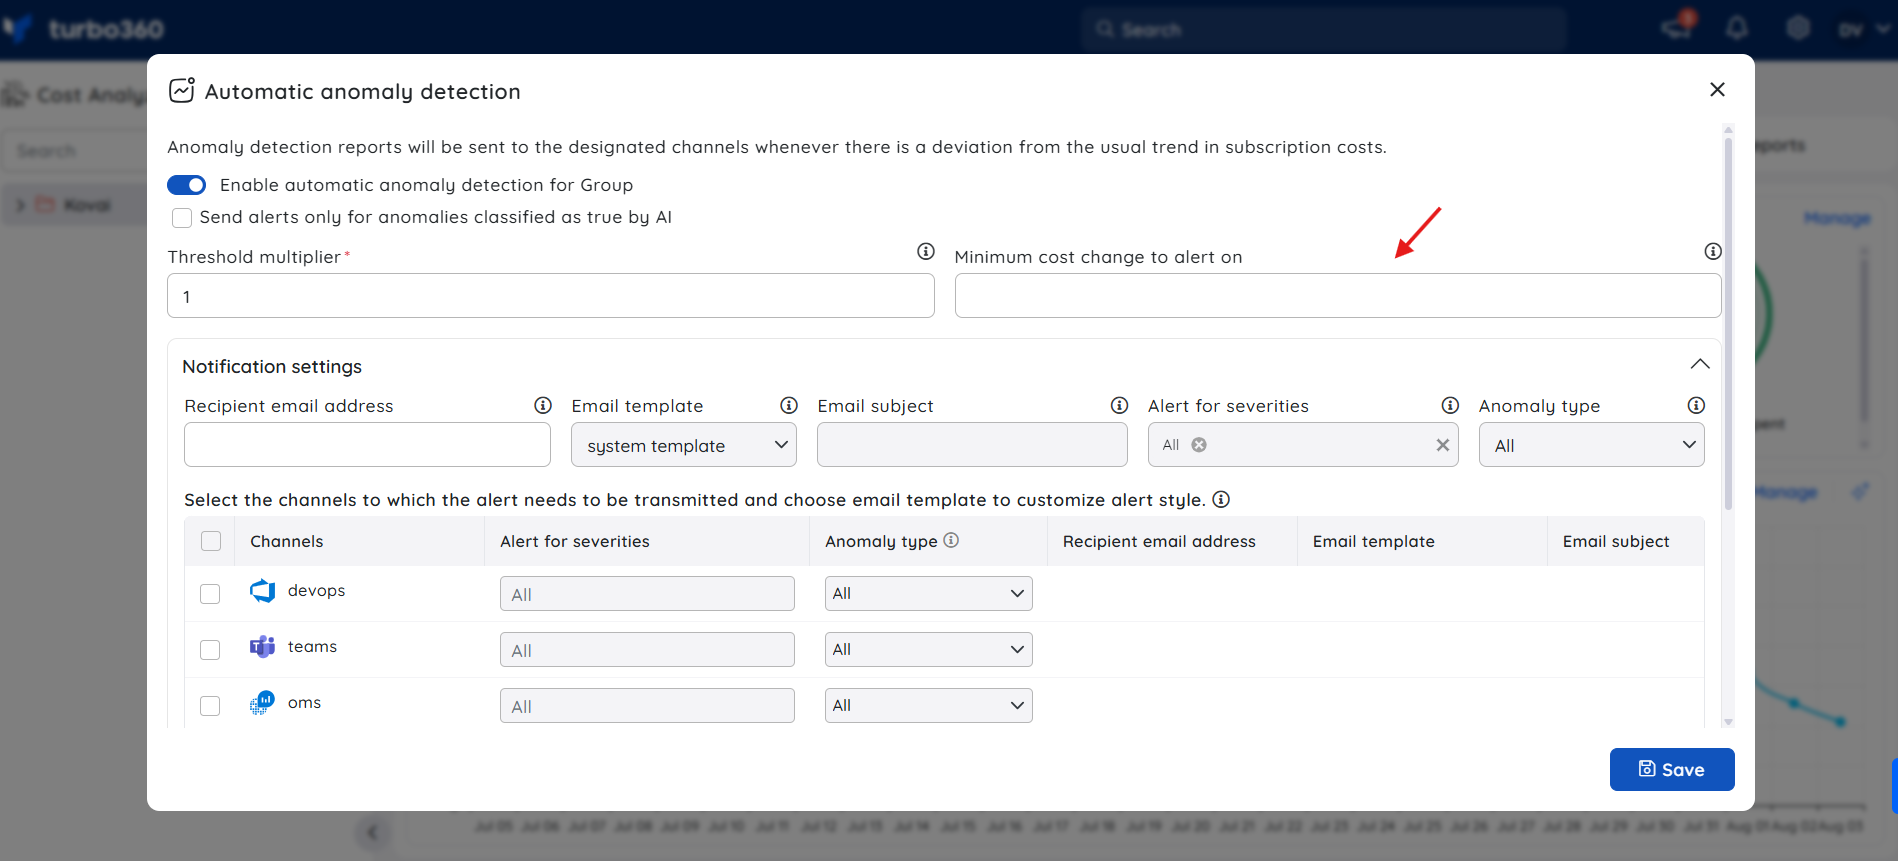
- Minimum cost change to alert on — an anomaly triggers an alert only if its cost change exceeds this amount, in the group's billing currency. Changes at or below this value are not alerted, and the AI also treats them as low relevance. Leave this blank for no floor.
Notification channels can further filter which of these anomalies they receive, based on severity and AI classification — see Steps and Configuration below.
Explain with AI
Explain with AI generates a structured, AI-driven audit of a cost management group's anomaly detection setup — covering the current configuration, cost consistency, recent anomaly history, severity distribution, alert routing, and tuning recommendations.
Anomaly Insights panel turns raw anomaly detection settings and alert history into a ready-made audit, saving teams from manually correlating threshold settings, cost volatility, and alert history to judge whether their detection setup is well-tuned. It flags misconfigurations — such as missing notification channels or an unsuitable threshold multiplier — and recommends specific tuning changes, helping teams get well-tuned alerting faster.
Run this after your first week of alerts to get an evidence-based starting point for tuning, or whenever alert volume seems too high or too low.
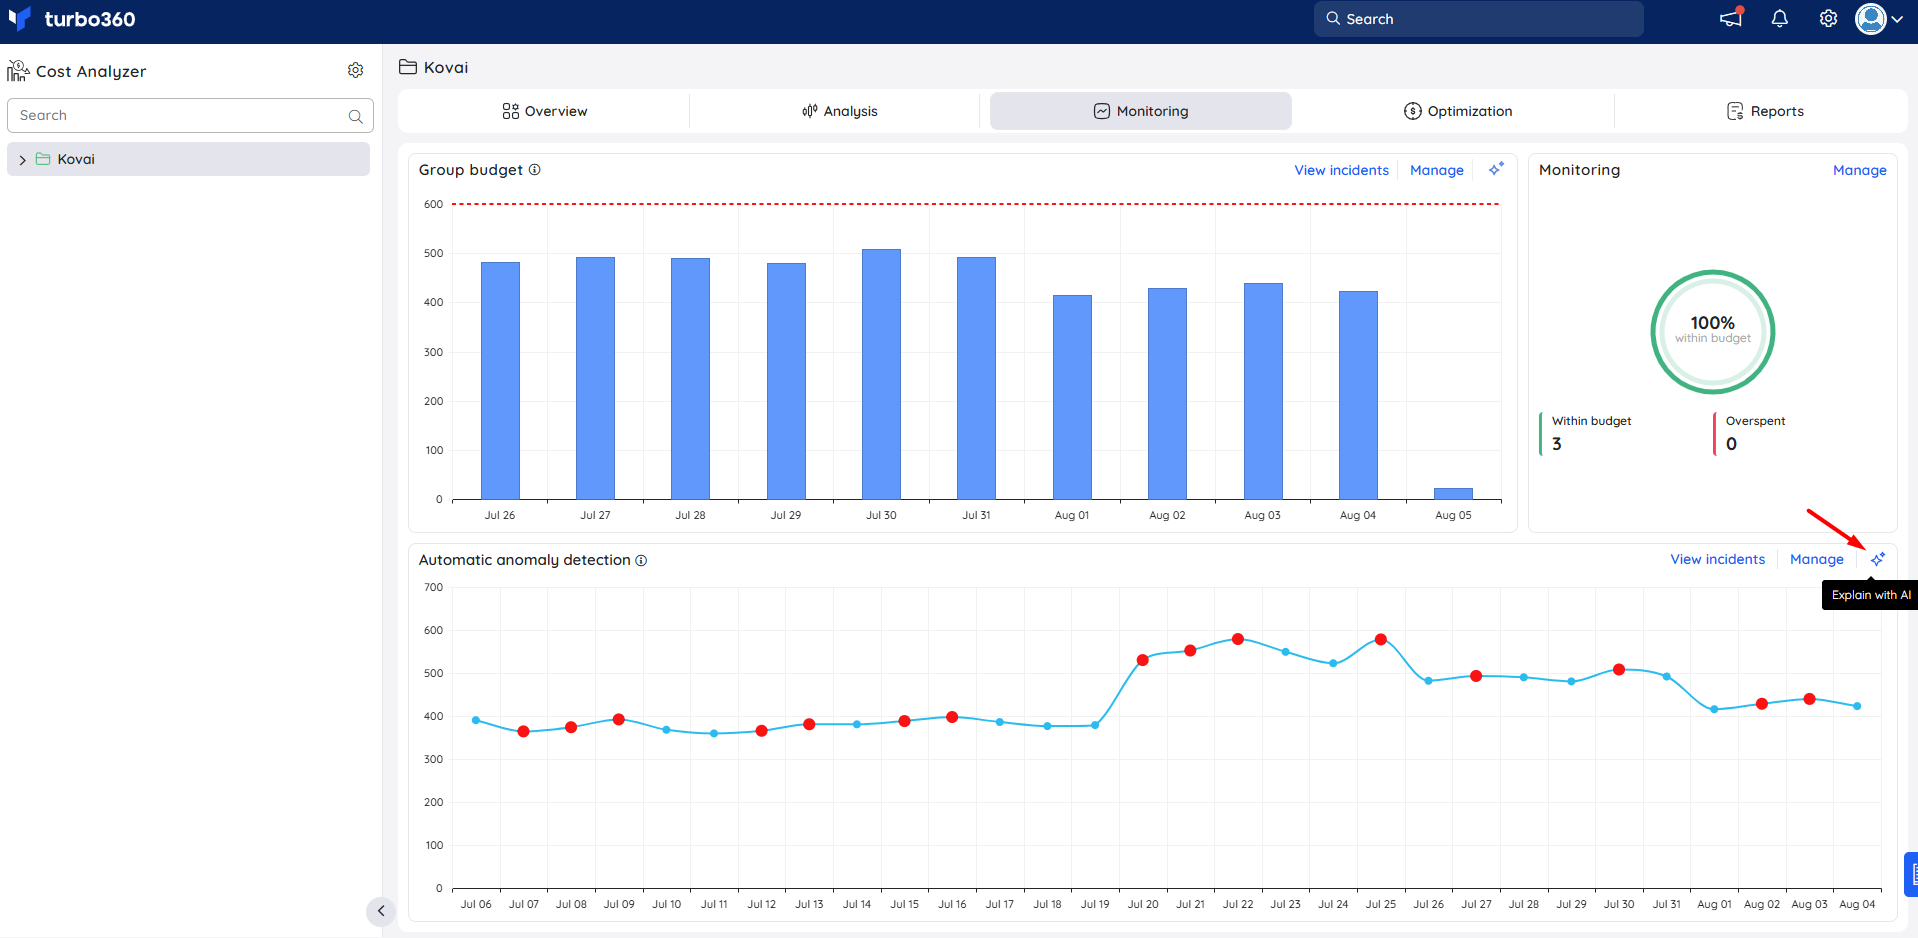
Navigate to the cost management group and open the Monitoring tab to get started.
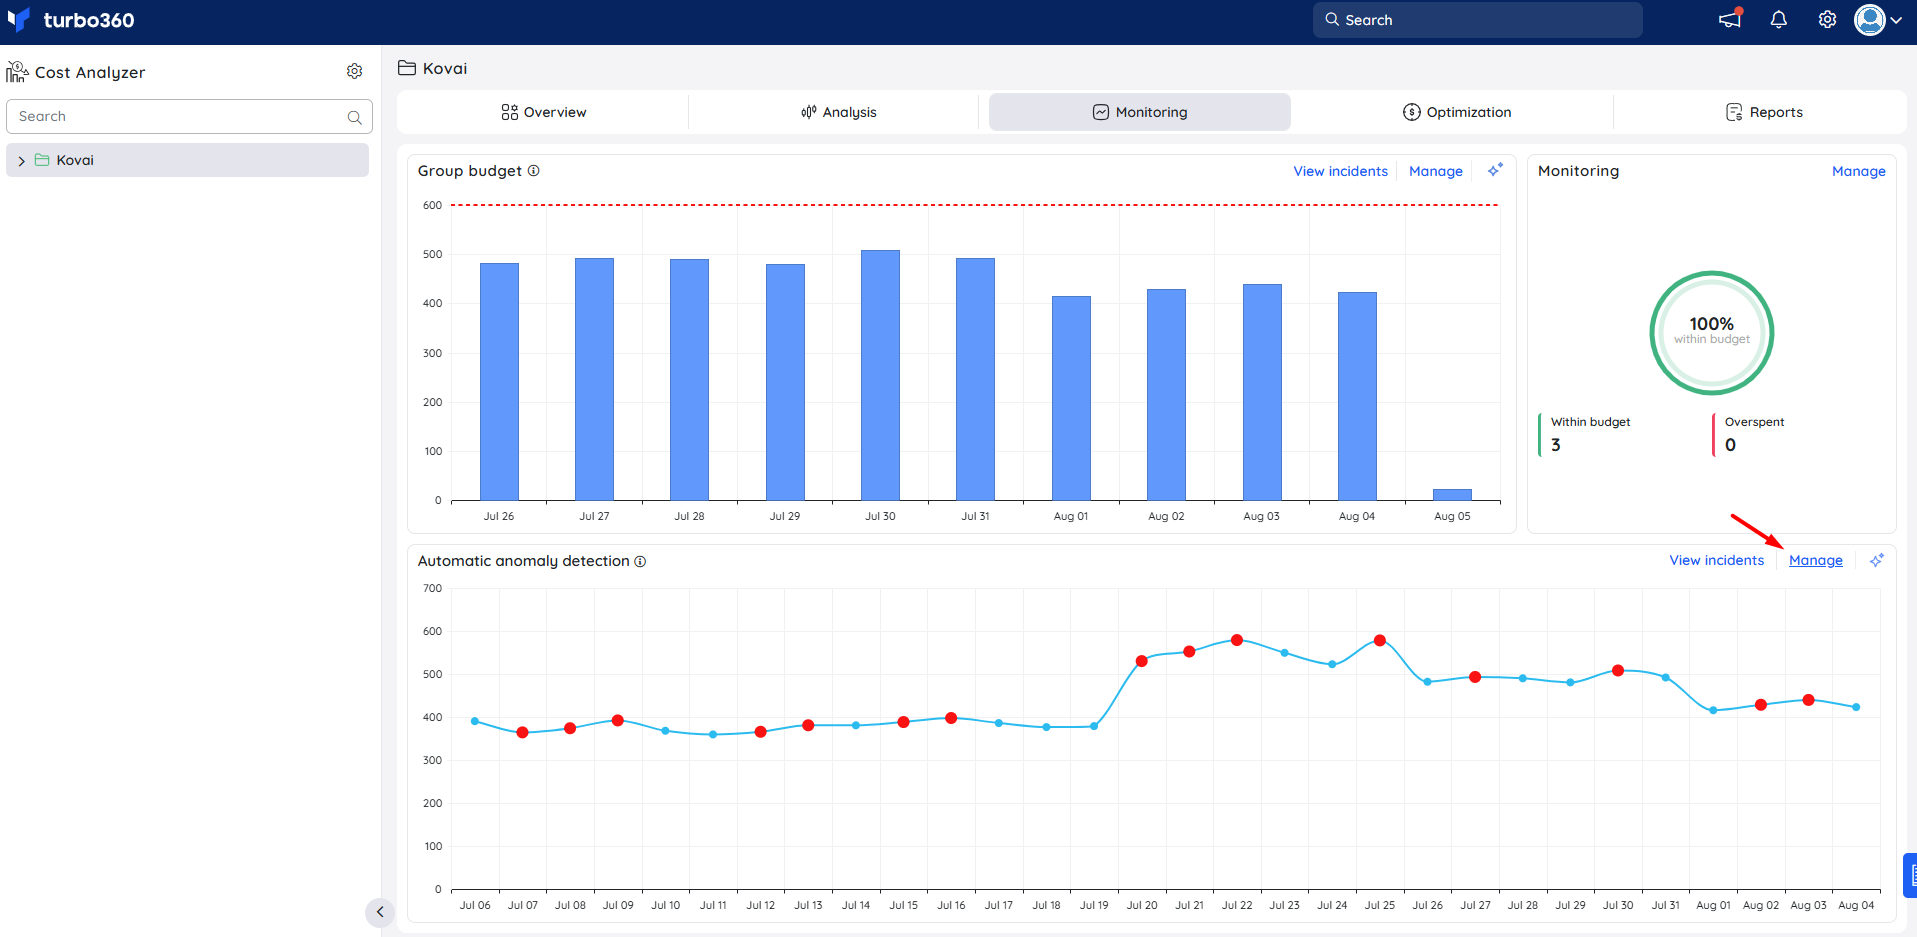
- On the Automatic anomaly detection widget, click the sparkle icon (✦) next to Manage.
- The Anomaly Insights panel opens with a full audit of the group's anomaly detection setup and history.
Insight breakdown
- Setup score — an overall score with a status label (for example, Attention needed) summarizing whether the current configuration suits the group's cost behavior, along with a one-line explanation of the main issue.
- Configuration — a summary of the group's current settings: whether automatic anomaly detection is enabled, the threshold multiplier, the minimum cost change floor, whether alerts are restricted to AI-verified anomalies, the detection interval, and the notification channels configured — with a plain-language summary sentence beneath.
- Cost consistency — a 30-day daily cost chart with anomaly alert days marked, alongside the average daily spend, the group's typical day-to-day cost movement, and the number of anomalies received in the period. Includes a volatility callout explaining whether the group's cost movement makes some anomalies expected even when nothing is broken.
- Common anomaly candidates — resources that most often drive cost anomalies for the group, each with a brief explanation of why that resource tends to swing and its average cost swing.
- Threshold multiplier — a recommendation on whether to raise or lower the multiplier, based on the group's anomaly count and cost volatility.
- Minimum cost change floor — a recommendation on whether to set or adjust the floor, based on the group's typical daily cost movement.
- AI verification — a Relevance ("would you care") score and a Confidence score summarizing how many of the recorded anomalies were AI-verified as true versus judged not-real, and whether enabling Alert only on AI-verified would have suppressed the not-real ones.
- What happens when you get an alert — a step-by-step explanation of the detection-to-incident pipeline: the statistical trigger, AI classification, severity assignment, channel routing, and incident logging.
- Alert routing map — flags gaps in notification setup, such as no notification channels configured, or a severity with no channel configured to receive it.
- How anomaly detection works here — a plain-language recap of the group's specific detection baseline and sensitivity.
- Recent anomaly history — a table of recent anomalies with date, cost change amount, the resource involved, assigned severity, and the AI verification result with a confidence percentage.
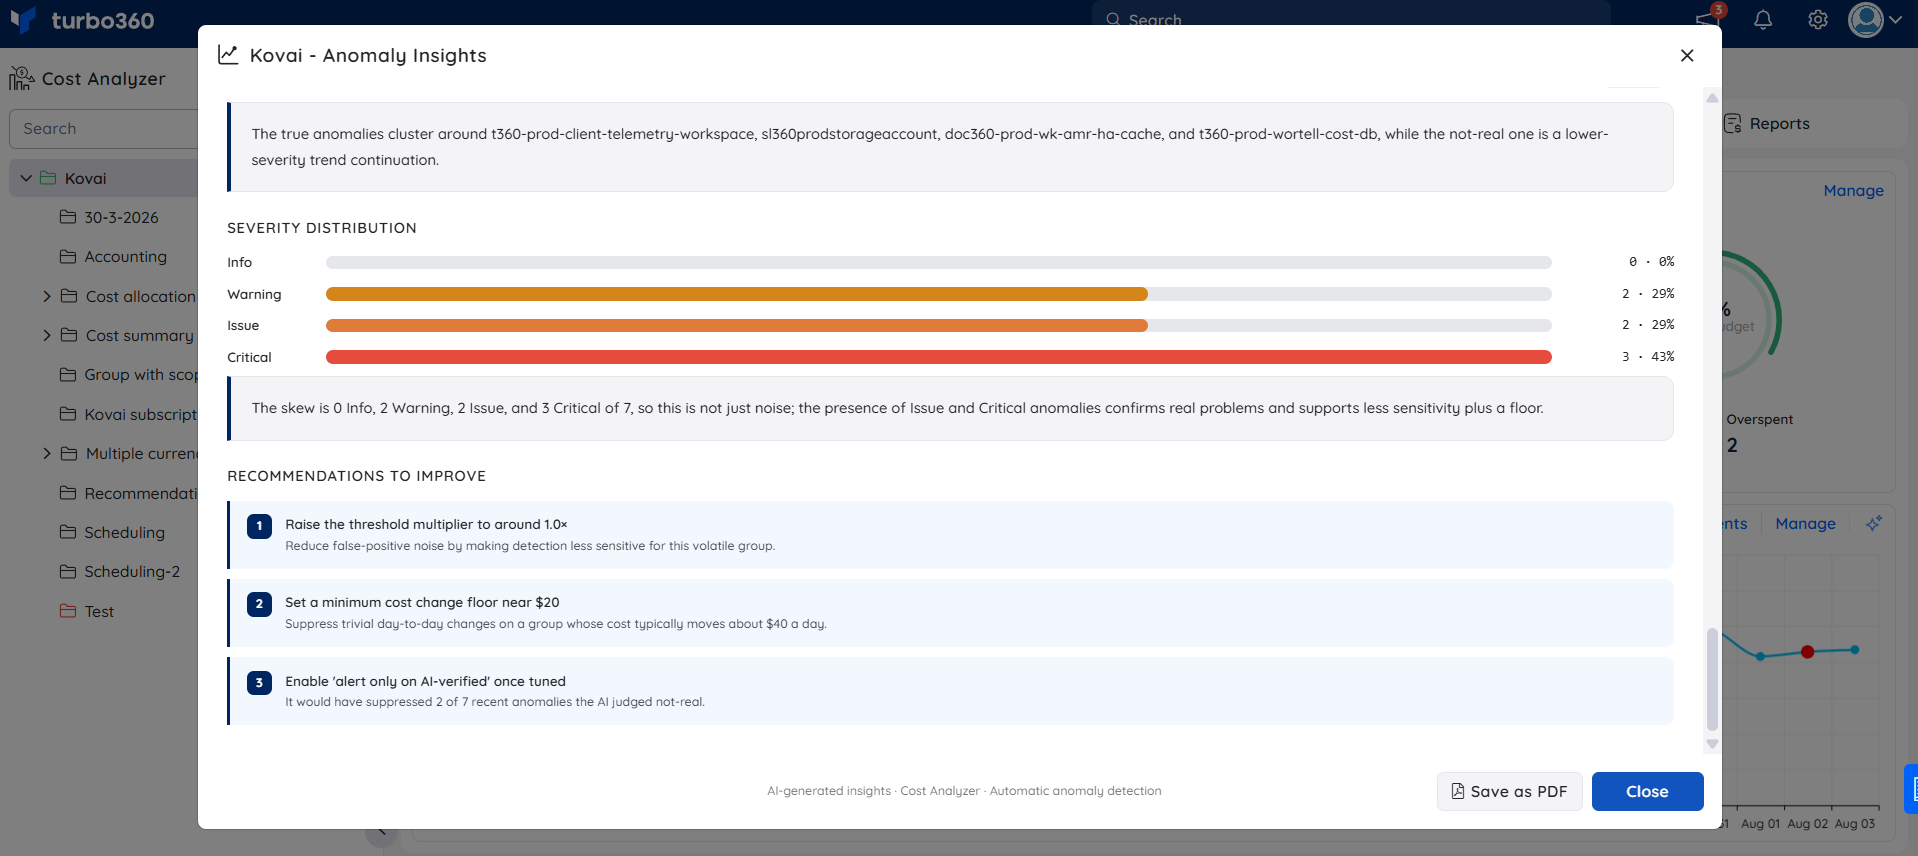
- Severity distribution — a breakdown of how many recorded anomalies fall into each severity band (Info, Warning, Issue, Critical), with a one-line interpretation.
- Recommendations to improve — a numbered list of concrete tuning actions, such as raising the threshold multiplier, setting a minimum cost change floor, adding notification channels, fixing routing gaps, or enabling AI-verified-only alerts.
Export
The full Anomaly Insights report can be saved using the Save as PDF button at the bottom of the panel.
Example scenario
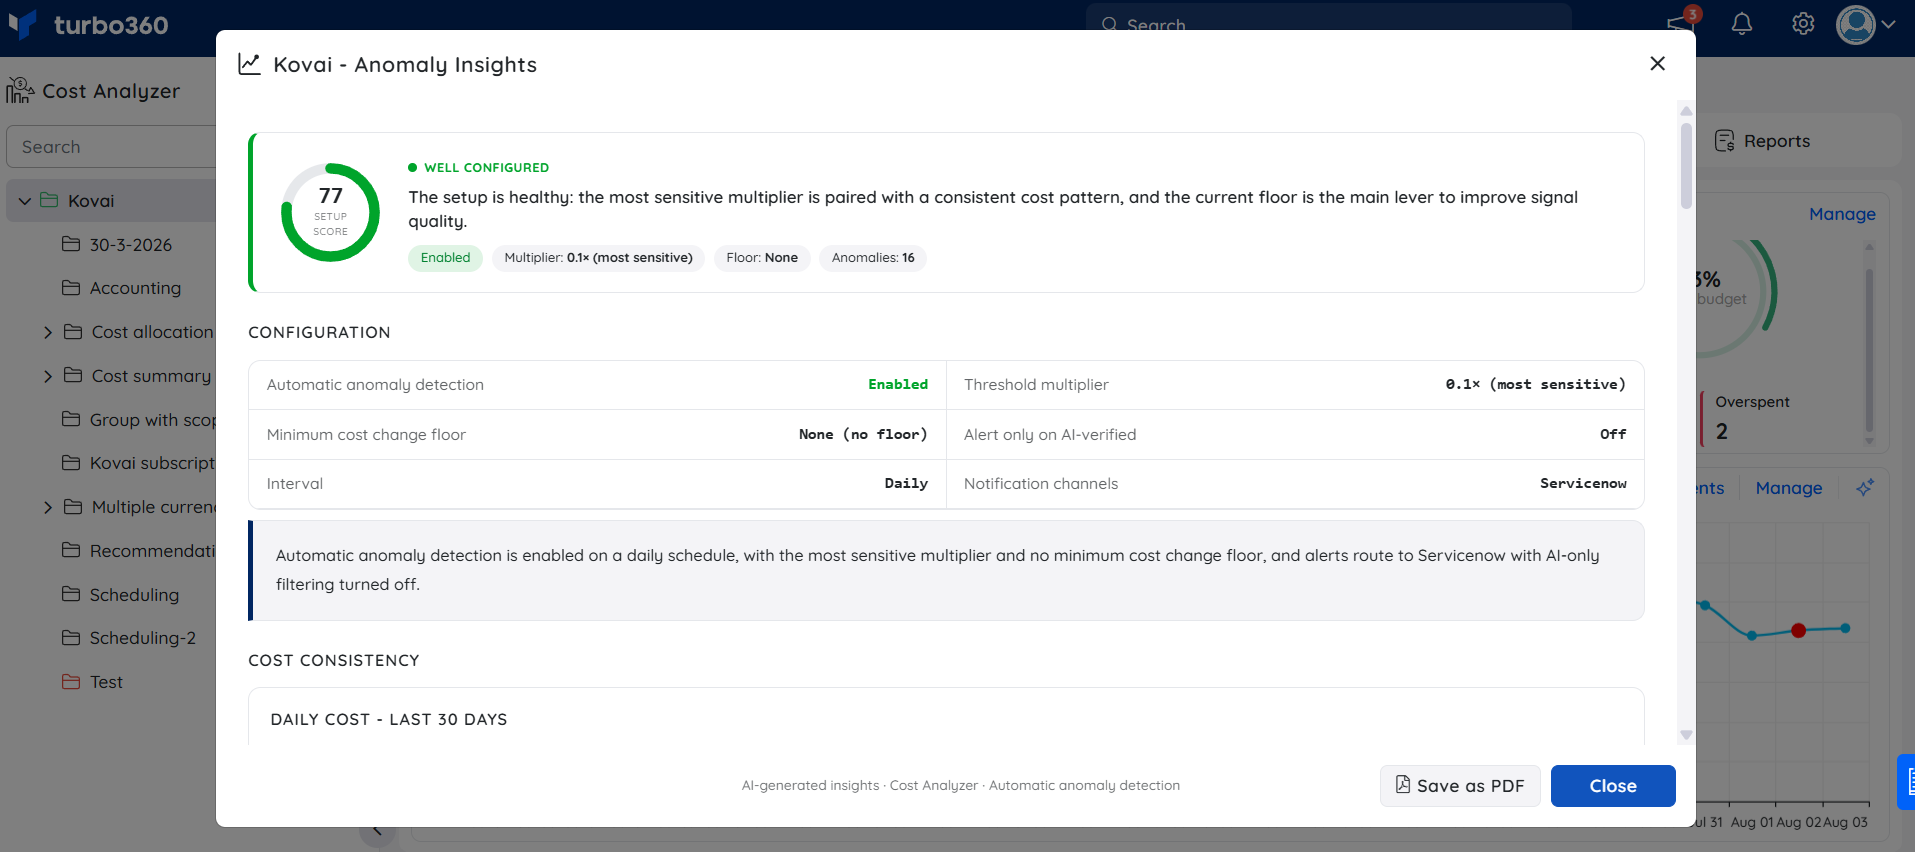
A FinOps analyst wants to verify that the Kovai cost management group's anomaly detection is properly tuned. They open Anomaly Insights from the Automatic anomaly detection widget on the group's Monitoring tab.
The panel shows a setup score of 77 (Well configured): the most sensitive multiplier (0.1×) is paired with a consistent cost pattern, and no minimum cost change floor is set. The group's average daily spend is $441, with a typical day-to-day movement of $40, and 15 anomalies were received in the last 30 days. Alerts route to ServiceNow; the Alert only on AI-verified toggle is off.
.png)
The AI verification section shows Relevance: 88% and Confidence: 92%. Of 7 recent AI-classified anomalies, 5 were verified true and 2 were judged not-real. Turning on Alert only on AI-verified would have suppressed those 2 not-real anomalies.
.png)
The severity distribution skews toward Issue and Critical (43%), confirming these are real problems rather than noise.
Anomaly Insights recommends:
- Raise the threshold multiplier to around 1.0× to reduce false-positive noise for this consistent group.
- Set a minimum cost change floor near $20 to suppress trivial day-to-day changes on a group that typically moves about $40 a day.
- Enable Alert only on AI-verified once tuned — it would have suppressed the 2 anomalies the AI judged not-real.
Steps
Use the following steps to configure anomaly detection for a cost management group. Navigate to the cost management group and open the Monitoring tab to get started.
- In the Automatic anomaly detection widget, click Manage and enable the Anomaly detection toggle.
- Optionally, select Send alerts only for anomalies classified as true by AI to record and send alerts only for anomalies the AI verifies as genuine. Leave this cleared to record and send both AI-verified and AI-classified false anomalies to your configured channels.
Set a Threshold multiplier to define detection sensitivity.
Optionally, set a Minimum cost change to alert on to suppress alerts for cost changes at or below this amount, regardless of the threshold multiplier. Leave this blank for no floor.
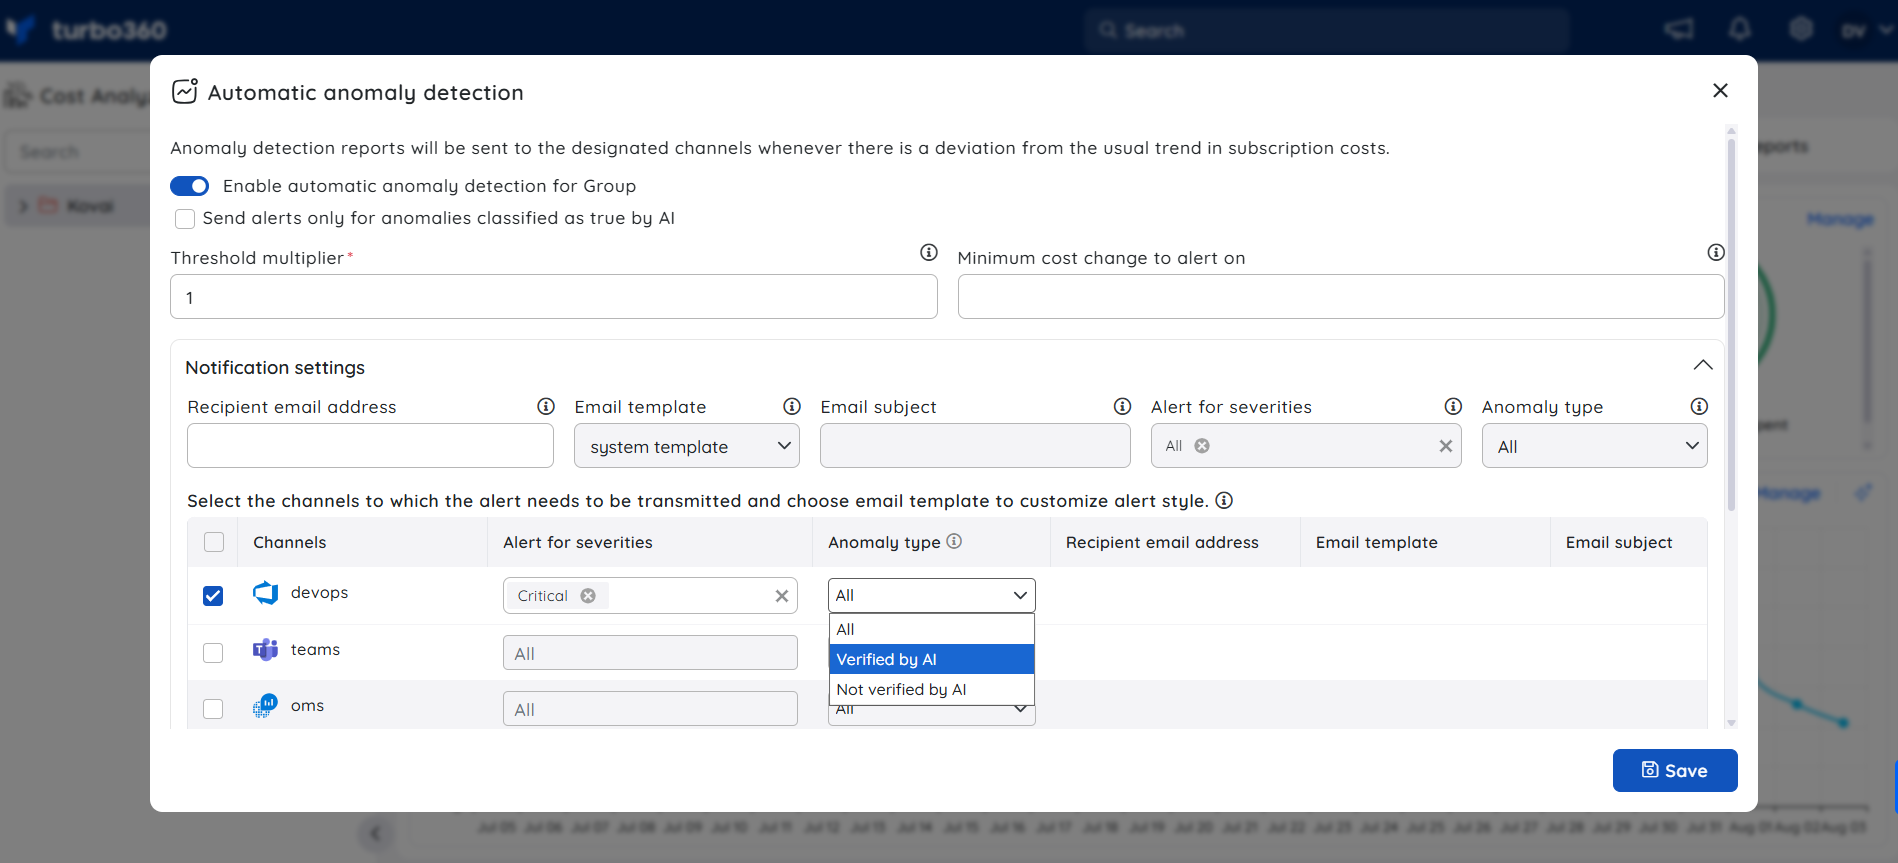
- Under Notification settings, select the checkbox next to each channel you want to receive alerts on. For a selected channel, you can override Alert for severities and Anomaly type:
- A channel receives an alert only when the anomaly's severity is included in that channel's Alert for severities.
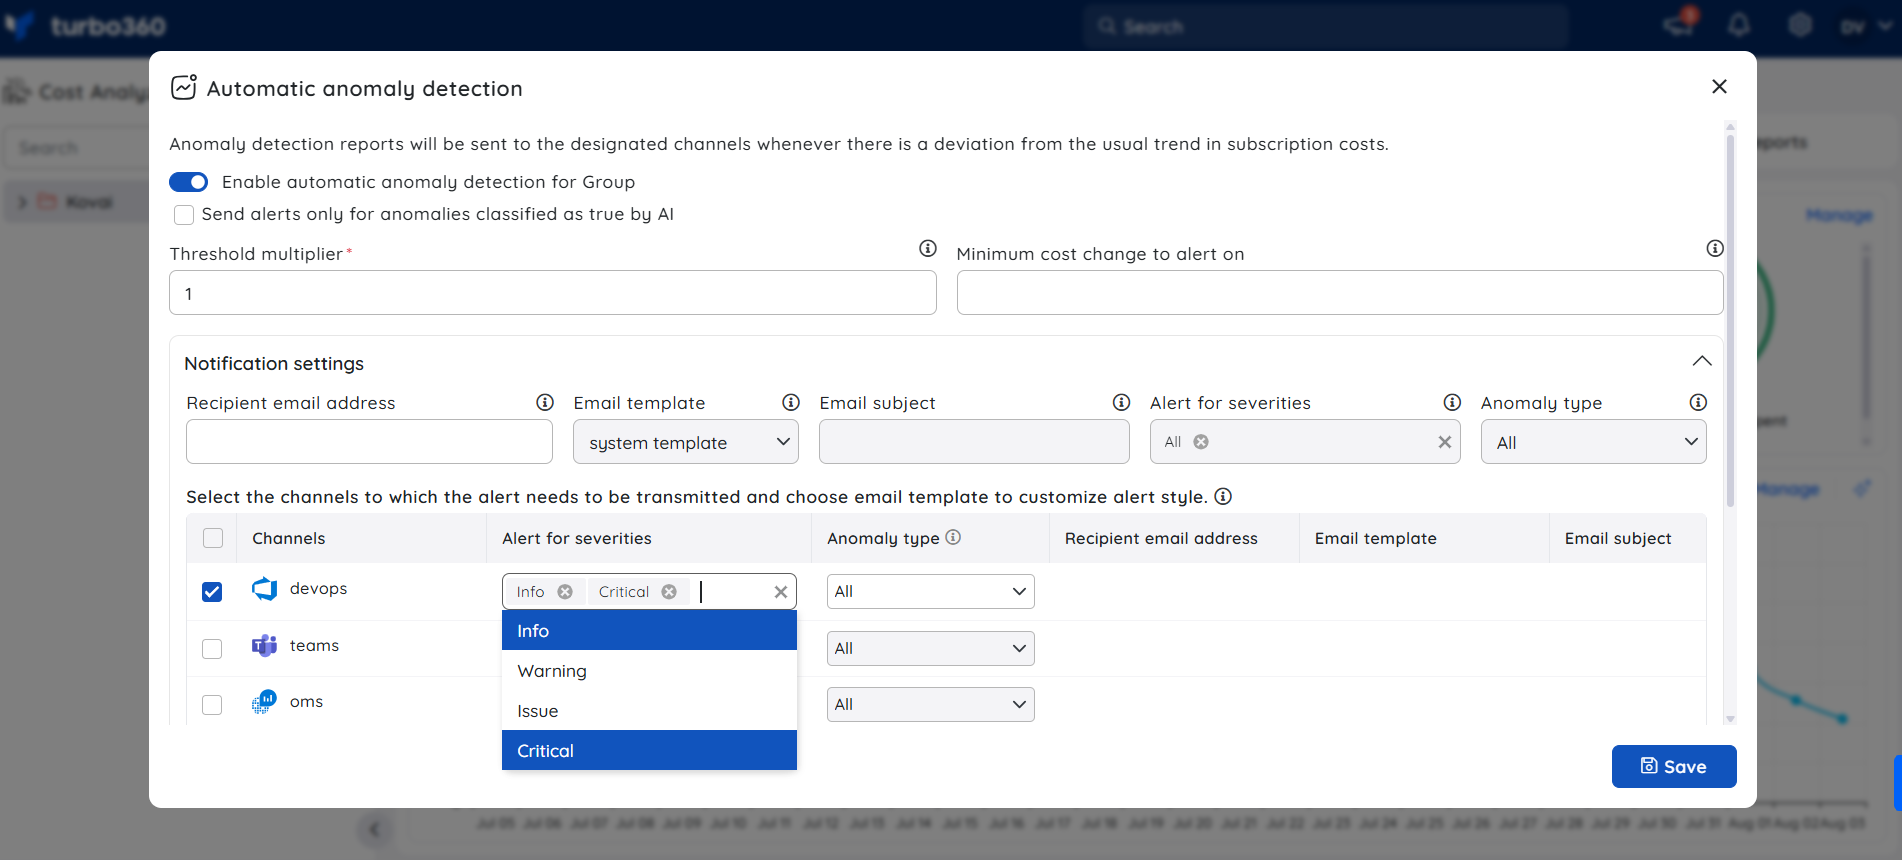
- Set the Anomaly type for each selected channel — All, Verified by AI, or Not verified by AI — to control which anomalies that channel receives based on AI classification.
- Click Save.
Cost anomaly report
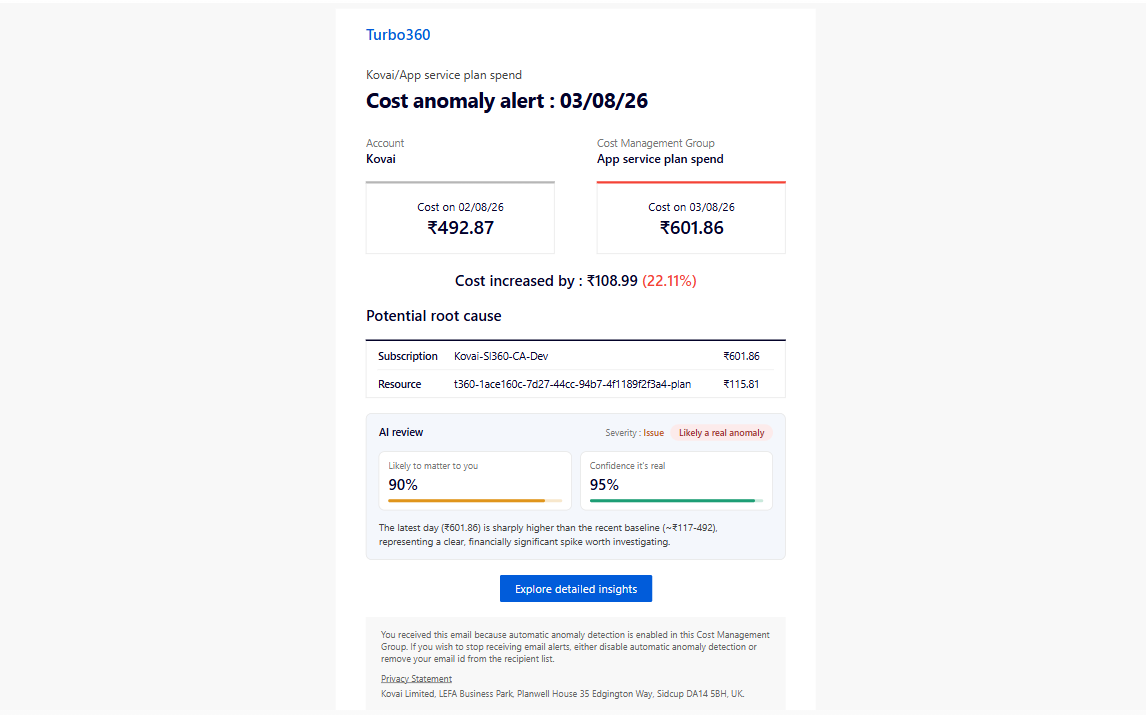
Below is the Cost anomaly report received via Turbo360 mail. This comprehensive report outlines potential root cause and overall cost variation detected on the specified date. It contains a navigation link that opens the cost analysis section of the corresponding group directly.
The report now also includes an AI review block, showing the assigned Severity (e.g. Issue, Critical), whether the anomaly is tagged Likely a real anomaly or False anomaly, a Likely to matter to you percentage, a Confidence it's real percentage, and a short AI-generated explanation of why the anomaly was flagged.
Alert incidents
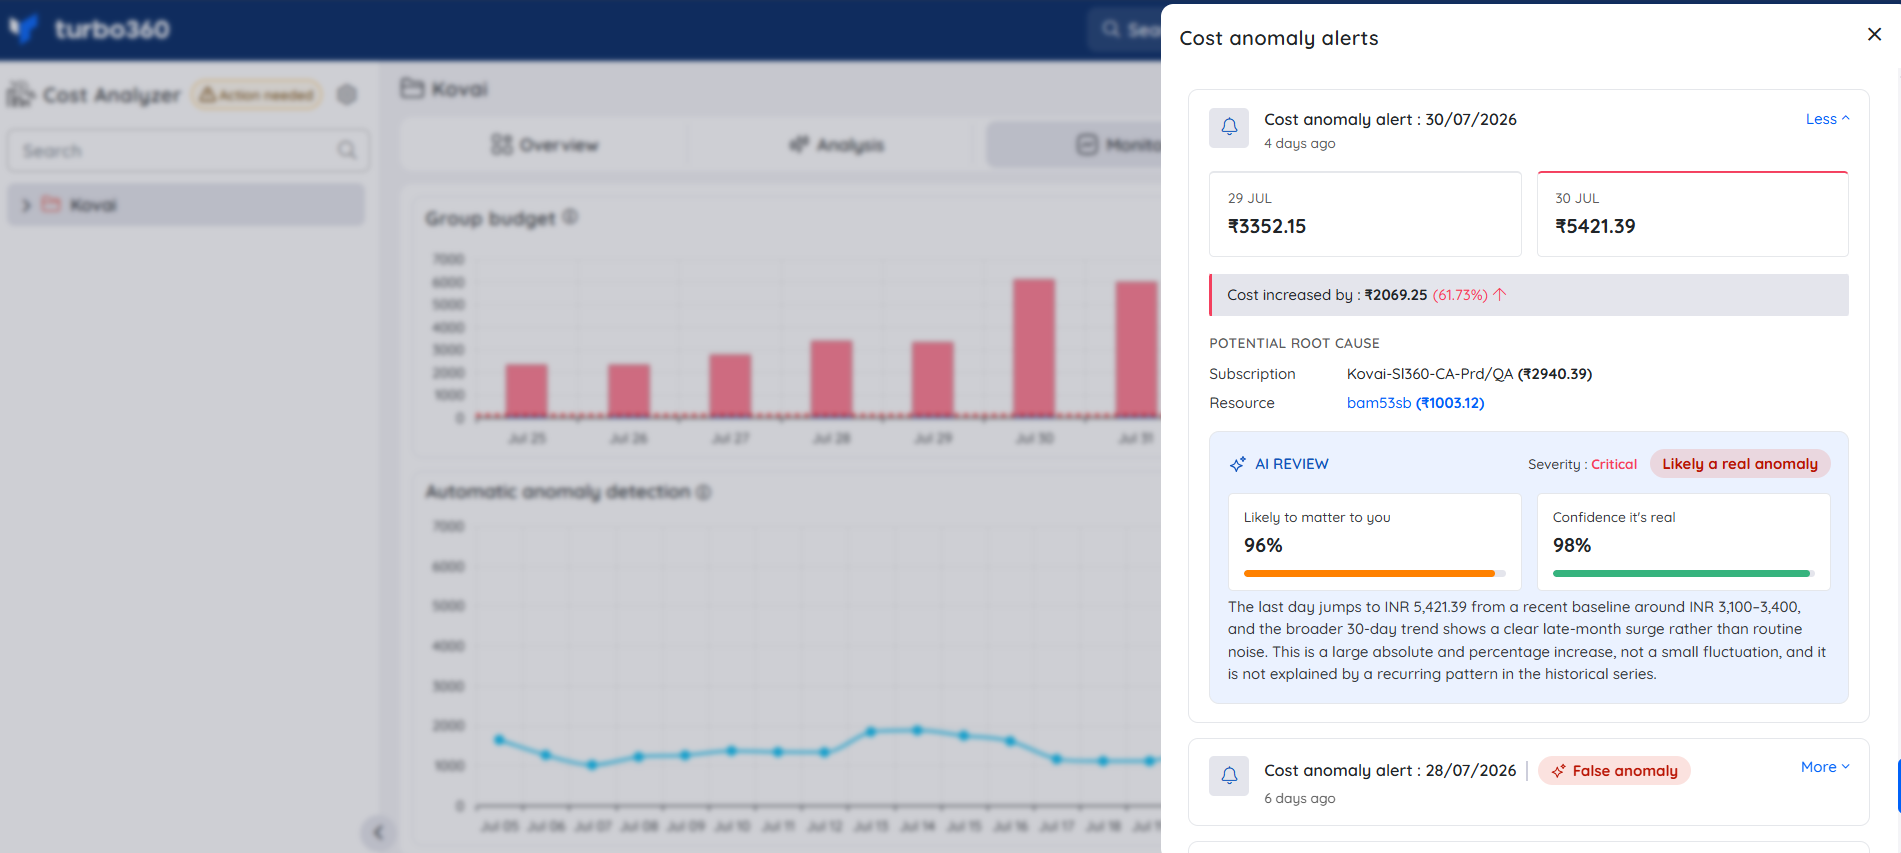
Anomalies detected within the configured interval are logged as incidents. Click View incidents on the Automatic anomaly detection widget to review them.
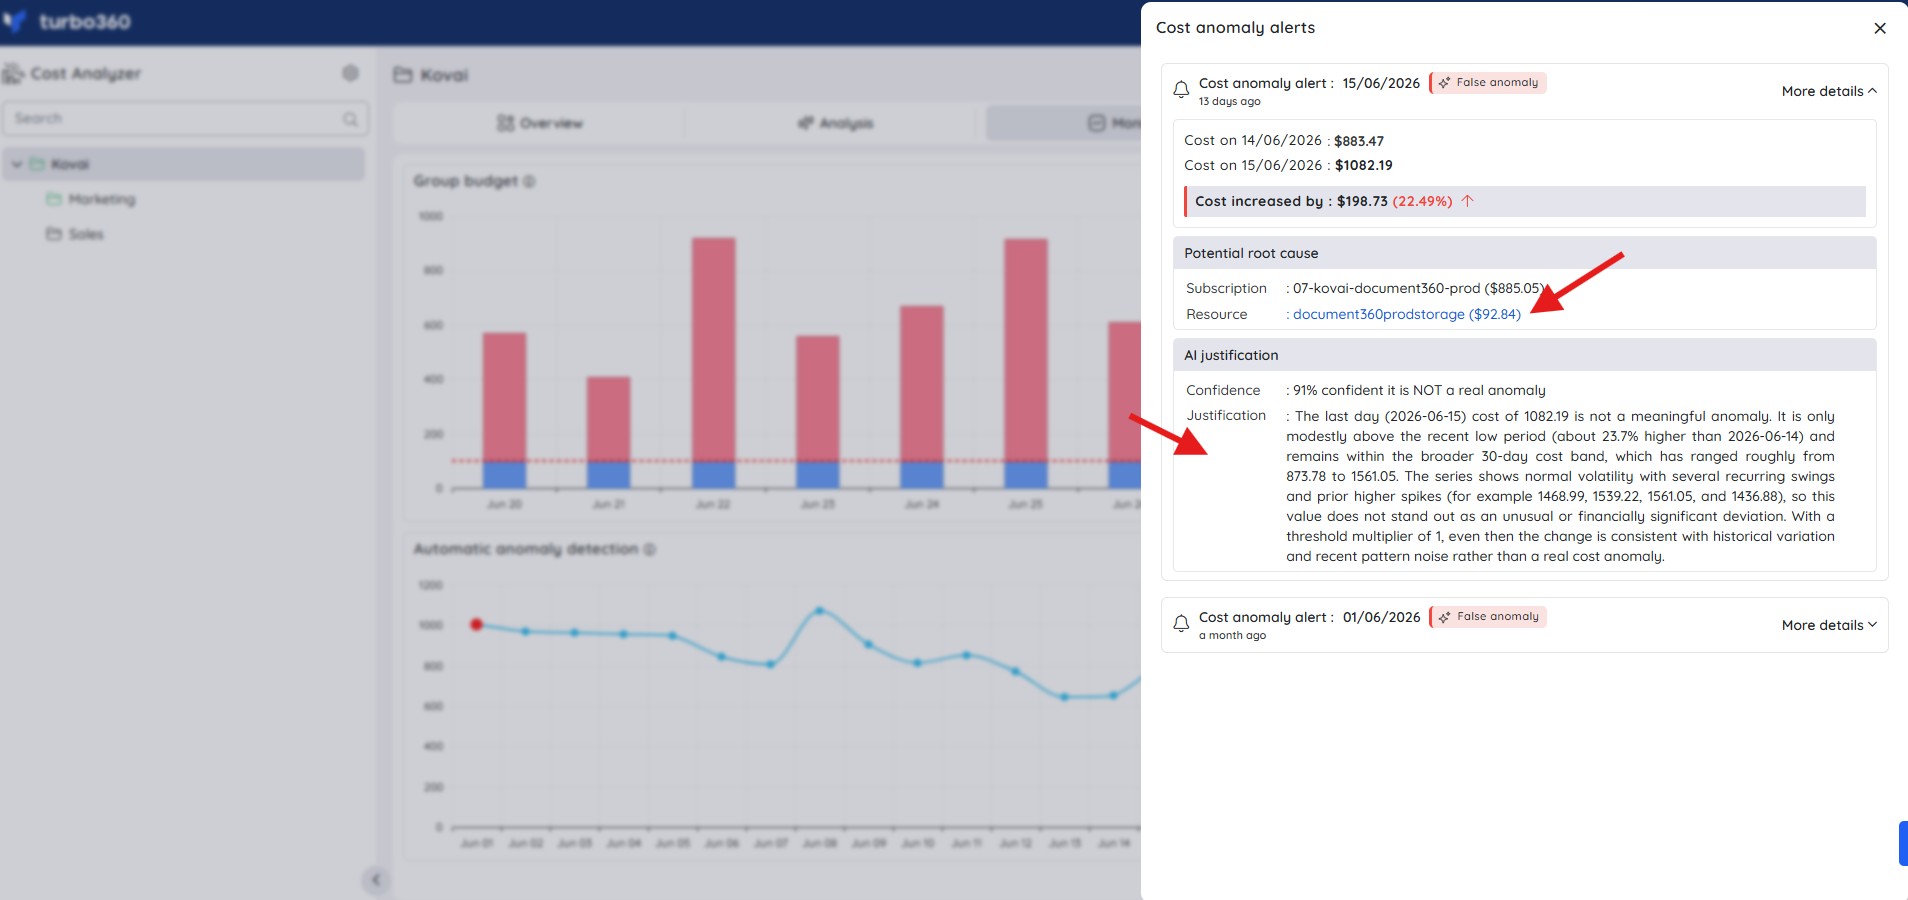
Each incident lists the cost for the previous and current day, the amount and percentage of the cost increase, and the Potential root cause — the subscription and resource most likely responsible for the spike. An AI Review section shows the assigned Severity (Critical, Issue, Warning, or Info), whether the anomaly is tagged Likely a real anomaly or False anomaly, a Likely to matter to you percentage, a Confidence it's real percentage, and a short AI-generated explanation of why the anomaly was flagged.
Investigating the root cause
Clicking a resource name under Potential root cause opens the cost intelligence view for the resource. From there, navigate to AI Agents > Cost spike troubleshooter to see the spike date, daily cost trend, and an AI-generated analysis explaining what caused the spike.
Limitations
- Anomaly detection always calculates its baseline from a 30-day rolling window of cost history; this window is not configurable.
- Detection sensitivity is controlled only through the threshold multiplier (range 0.1–10) — there's no separate control for time-of-day or seasonal cost patterns.
Troubleshooting
No anomalies are ever flagged despite visible cost spikes
Cause: The threshold multiplier is set too high, requiring a very large deviation before an alert fires.
Fix: Lower the threshold multiplier to increase sensitivity, starting from a value of 1 and adjusting based on observed behavior.Too many anomaly alerts are being triggered
Cause: The threshold multiplier is set too low, flagging normal day-to-day fluctuations as anomalies.
Fix: Raise the threshold multiplier to reduce sensitivity.Anomaly alerts are not arriving on the expected notification channel
Cause: The notification channel selection was not saved, the channel itself is not configured correctly, or the anomaly's severity or AI classification does not match the channel's configured Alert for severities or Anomaly type.
Fix: Reopen the anomaly detection configuration and confirm the correct channels are selected and saved. If Alert for severities or Anomaly type filters are set on the channel, confirm the anomaly's severity and AI classification match those filters.The sparkle icon for Anomaly Insights is not visible on the widget
Cause: The user's Custom role does not have the AI Agents feature permission enabled.
Fix: Go to User management > Roles, edit the relevant Custom role, and enable the AI Agents toggle and the Monitoring permission under Specify feature permissions.Recent anomaly history and severity distribution show no data
Cause: Automatic anomaly detection may have been recently enabled, or the group's cost has not deviated enough to trigger an anomaly in the current 30-day window.
Fix: Confirm the Anomaly detection toggle is enabled on the group and allow time for the 30-day baseline to build before expecting anomaly history.Save as PDF produces an incomplete or blank export
Cause: The Anomaly Insights panel may not have fully loaded all sections before the export was triggered.
Fix: Wait for all sections to finish loading in the panel, then use Save as PDF again.The setup score is very low but the anomaly detection config looks correct
Cause: The score weighs multiple factors — a missing notification channel, an extreme multiplier for a volatile group, or no minimum cost change floor can each significantly lower the score even when other settings appear fine.
Fix: Review the Recommendations to improve section at the bottom of the panel; each recommendation identifies the specific factor dragging the score down.The alert routing map shows routing gaps even though notification channels are configured
Cause: Channels may be configured but not assigned to all severity levels, or the AI verification filter may be blocking delivery for certain anomaly states.
Fix: Review the routing map table and check that each required severity has at least one channel assigned, and that the AI verification column setting matches the desired behavior.
FAQs
What does the Anomaly Insights setup score measure?
The setup score reflects how well the group's current anomaly detection configuration — sensitivity, minimum cost change floor, AI verification, and notification channel setup — fits that group's own cost volatility. It is not a universal benchmark across groups.Does opening Anomaly Insights change any anomaly detection settings?
No. Anomaly Insights is a read-only audit. Any recommended changes — threshold multiplier, minimum cost change floor, or notification channels — must be applied manually in the anomaly detection configuration.How often does the Anomaly Insights panel update?
The panel generates a fresh audit each time it is opened, using the group's most recent 30-day anomaly history and current configuration. It does not update in real time while open.
Related articles
Was this article helpful?