

Azure Function App
- 05 Aug 2026
- 10 Minutes to read
- Print
- DarkLight
- Download PDF
Azure Function App
- Updated on 05 Aug 2026
- 10 Minutes to read
- Print
- DarkLight
- Download PDF
Article summary
Did you find this summary helpful?
Thank you for your feedback!
Overview
Azure Function App is an Azure resource that hosts serverless functions as a managed service. In Turbo360, you can add both the Azure Function App (the host) and individual Azure Functions within it to your Business Application. Each level supports its own set of operations, monitoring rules, and dashboards.
- Azure Function App — the container that hosts one or more functions. You can start, stop, or restart the app and monitor it at the infrastructure level.
- Azure Function — an individual function within the app. You can enable, disable, test, invoke, and manage function keys for each function.
Business value
Managing Azure Function Apps and their individual functions through Turbo360 reduces the operational overhead of monitoring serverless workloads. You can detect failed invocations, monitor resource health, and reinvoke failed triggers directly from your Business Application, without switching between Azure portal screens.
How it works
Turbo360 surfaces operations, monitoring rules, dashboards, and invocation logs for Azure Function Apps and individual Azure Functions. Monitoring rules are evaluated on a regular cycle. The monitoring state is updated after each cycle.
For resource dashboards, Azure Function App includes a default set of pre-built widgets. Azure Function (individual) uses the Application Insights resource associated with the function at deployment time.
Permissions
Turbo360 uses role-based access control to restrict what users can do with Azure Function App and Azure Function resources. Permissions are assigned per resource type when configuring roles under User management.
| Resource type | Permission | Access granted |
|---|---|---|
| Azure Function App | Read | View the Function App resource, dashboards, and monitoring configuration |
| Azure Function App | Manage | Start, stop, restart the Function App; configure and save monitoring rules and dashboards |
| Azure Function | Read | View individual functions, invocation logs, and monitoring configuration |
| Azure Function | Manage | Enable/disable functions, test functions, manage keys, invoke triggers, configure monitoring rules |
Test a function
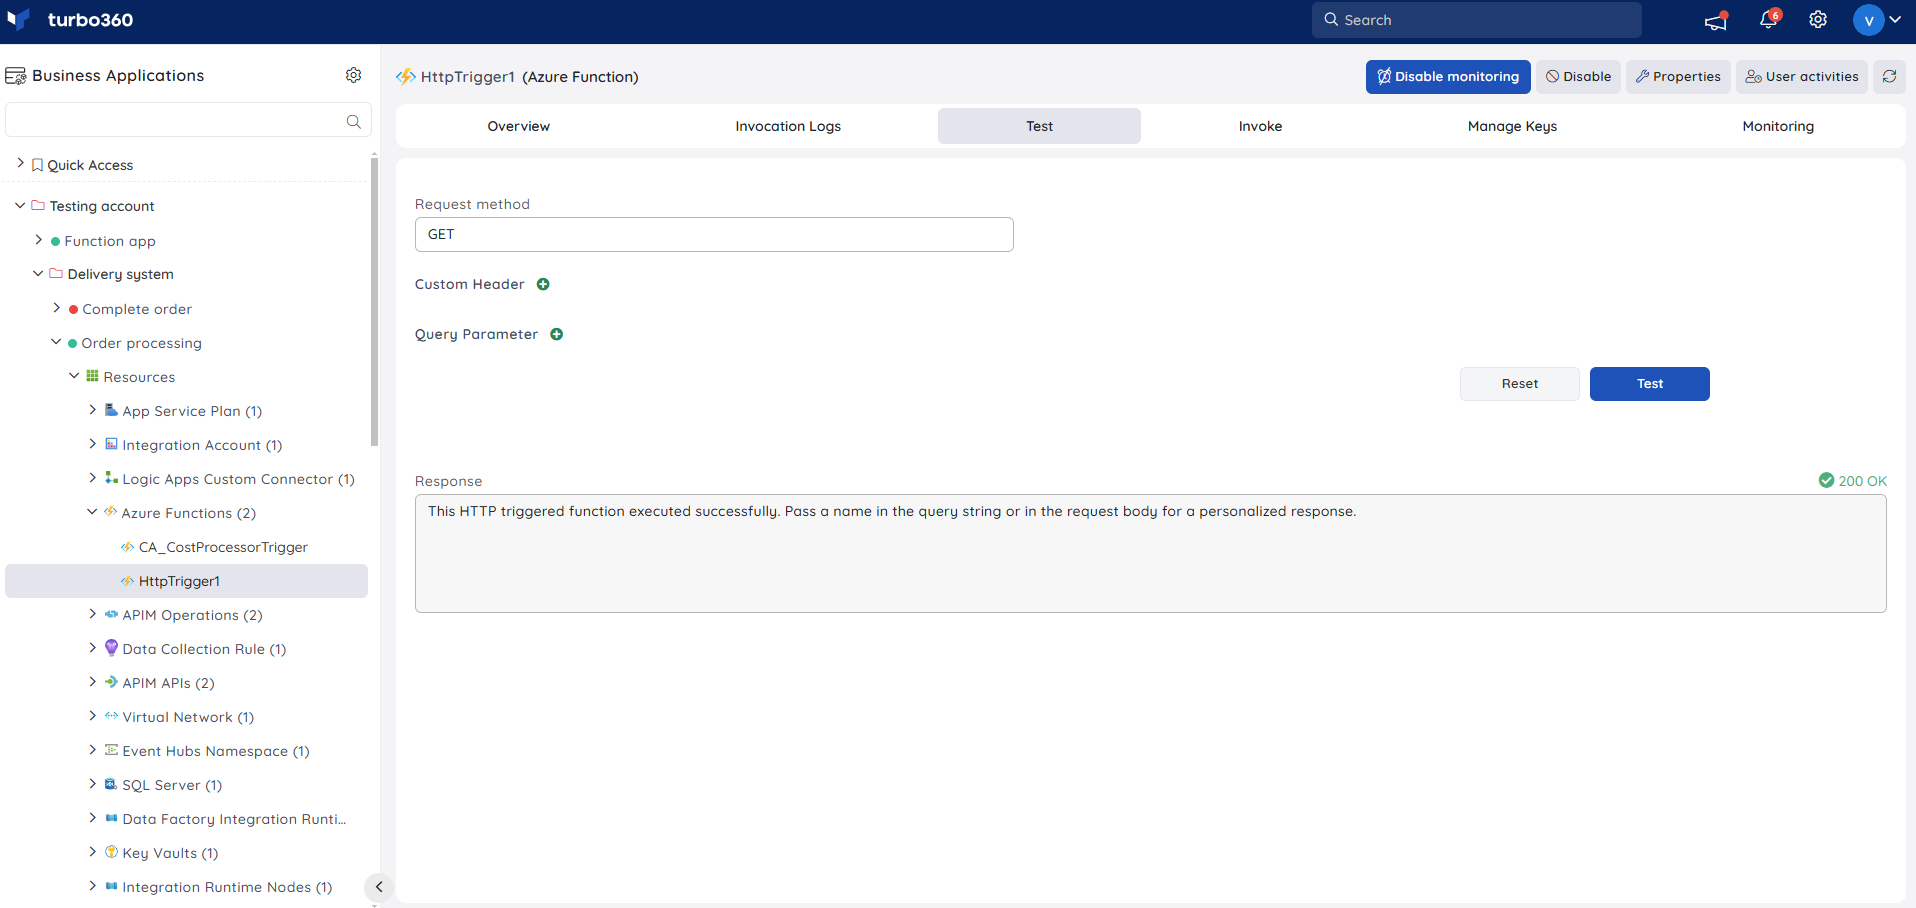
You can run a test invocation of an Azure Function to view the status code and response.
- Select the Request method.
- Provide a Message body.
- Optionally include custom headers and query parameters.
- Click Run.
The input fields vary according to the trigger type.
For example, to test an HTTP-triggered function, select GET or POST, add headers and query parameters as needed, then click Run. The response and status code are displayed after the test run.
Manage function keys
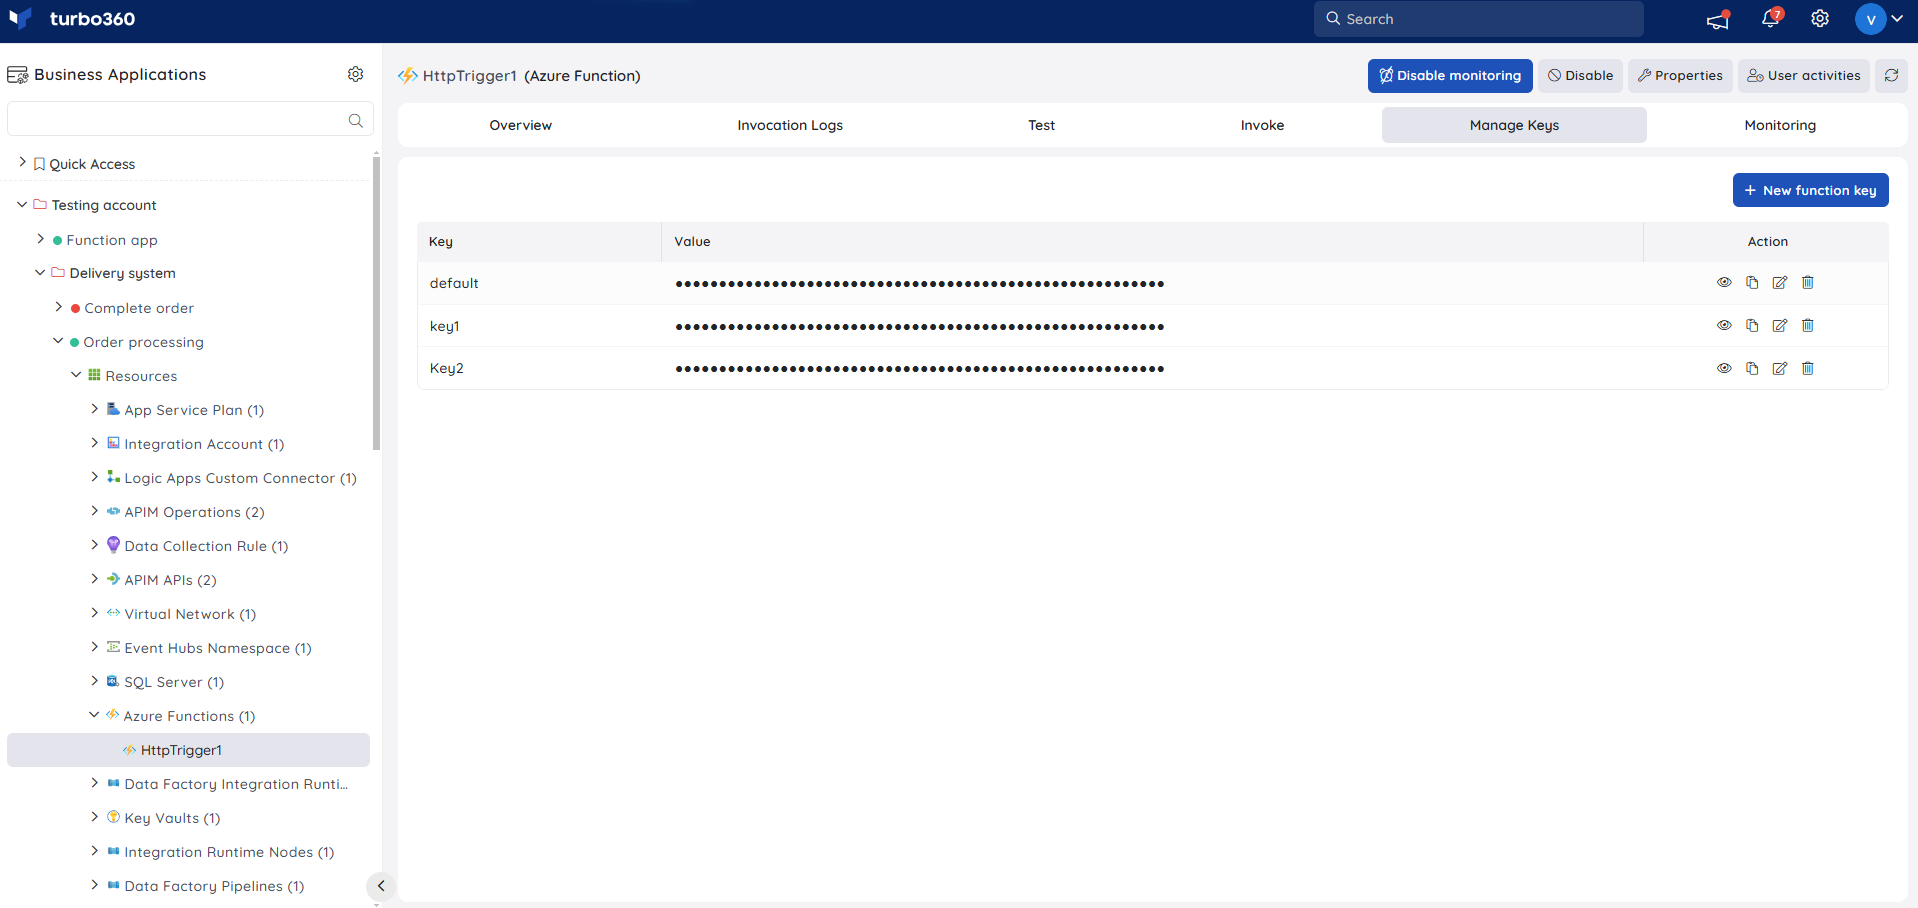
Function-level keys control HTTP request authorization. If a key is created for a function, the function expects that key as a header for all HTTP requests. If no key exists, no key is required.
To add a new function key:
- Click New function key.
- Provide a key name and value.
- Click Create.
Use the edit and delete icons to modify or remove existing keys.
Operations
You can manage both the Azure Function App host and its individual functions directly from Turbo360, avoiding context-switching to the Azure portal for routine lifecycle tasks and incident response.
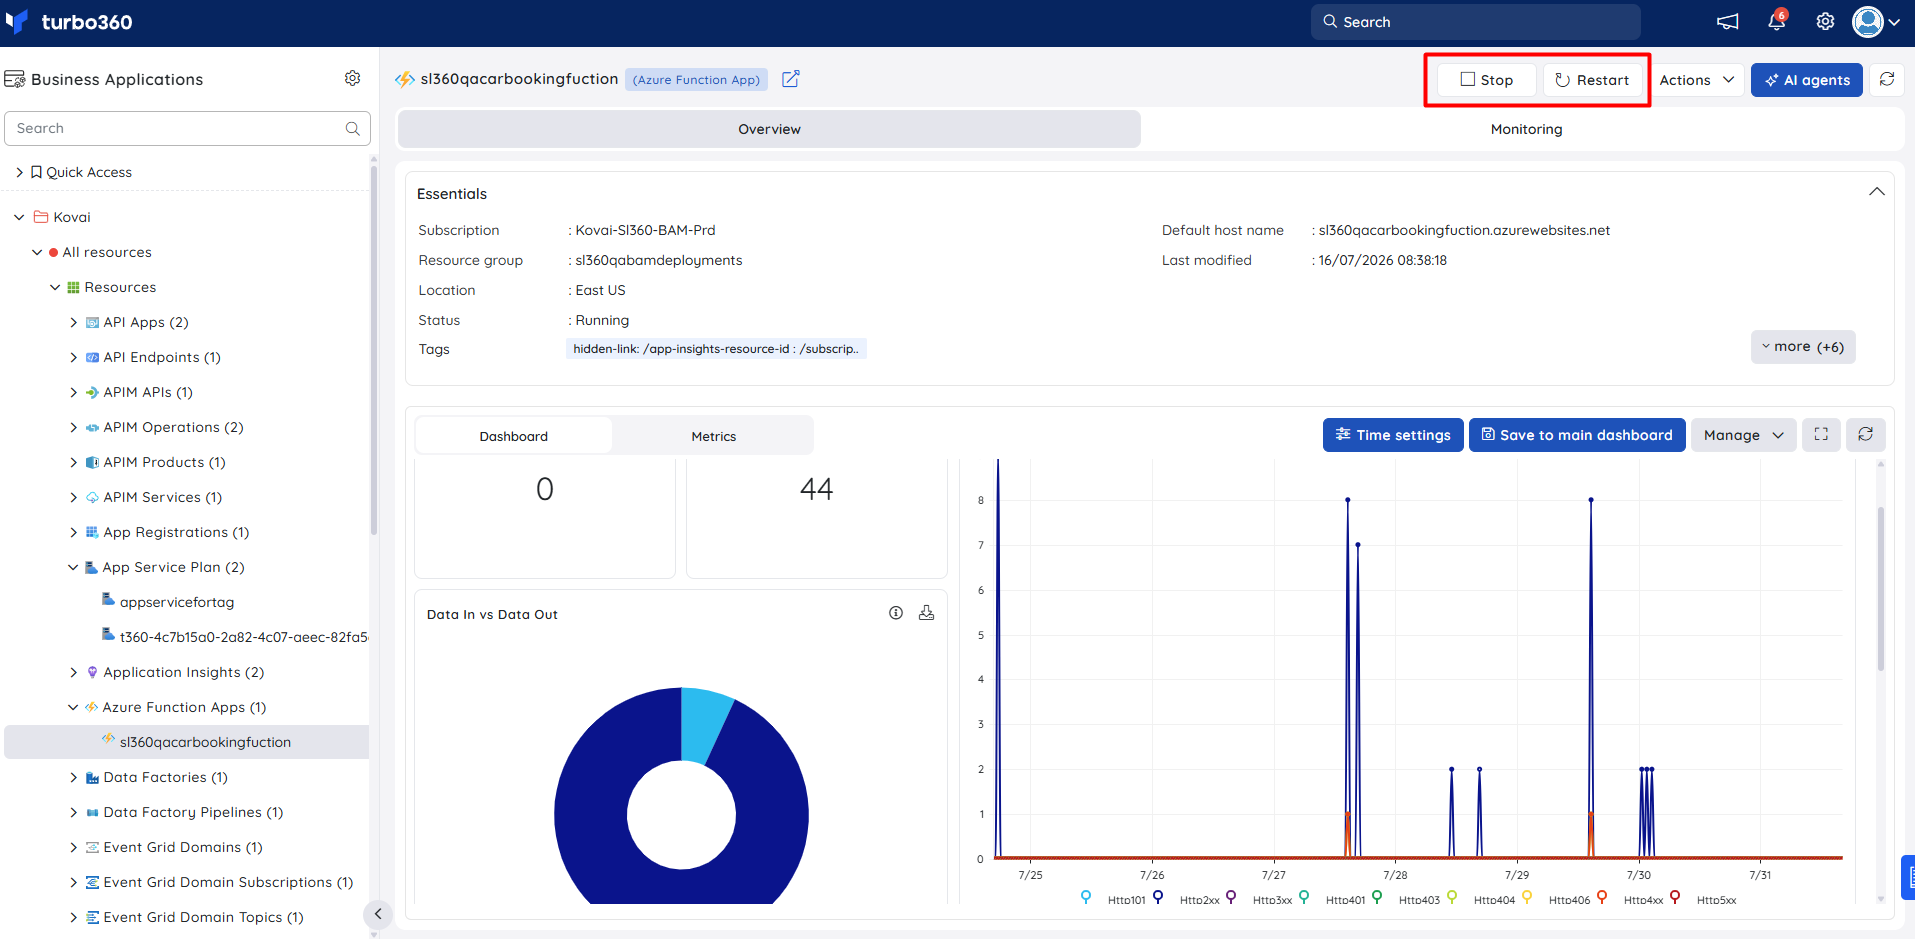
Start, Stop, and Restart (Function App)
- Start — brings the Function App back online after it has been stopped. Use this when you need to restore service following a planned maintenance stop or an unexpected shutdown.
- Stop — shuts down the Function App and all functions hosted within it. Use this when performing maintenance, deploying updates, or responding to a runaway process.
- Restart — stops and immediately restarts the Function App. Use this when functions are unresponsive or memory usage has grown unexpectedly and a clean restart is needed.
- Select the Azure Function App resource in the tree view.
- Click Start, Stop, or Restart.
Enable and Disable (Azure Function)
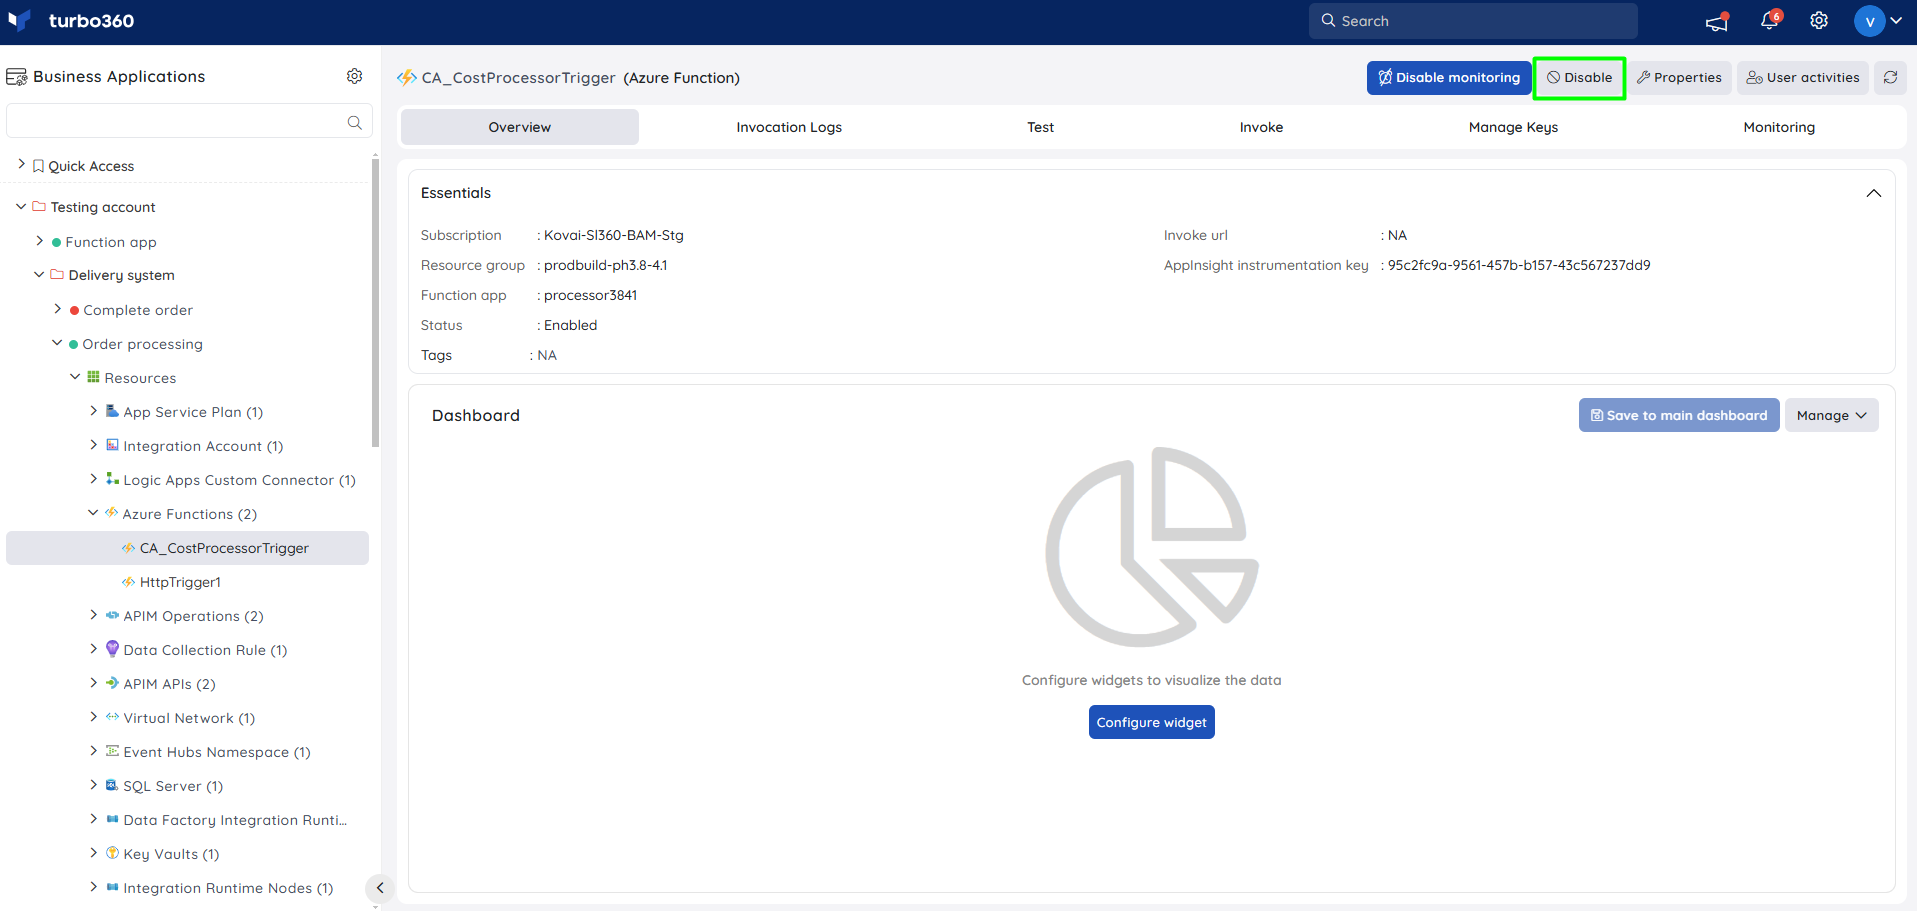
- Enable — activates an individual function so it begins processing trigger events. Use this when re-enabling a function after deliberate deactivation or after completing a deployment.
- Disable — deactivates an individual function without stopping the host app. Use this when you need to pause processing for a single function during debugging or a partial rollout.
- Select the Azure Function resource in the tree view.
- Click Enable or Disable.
Invoke triggers
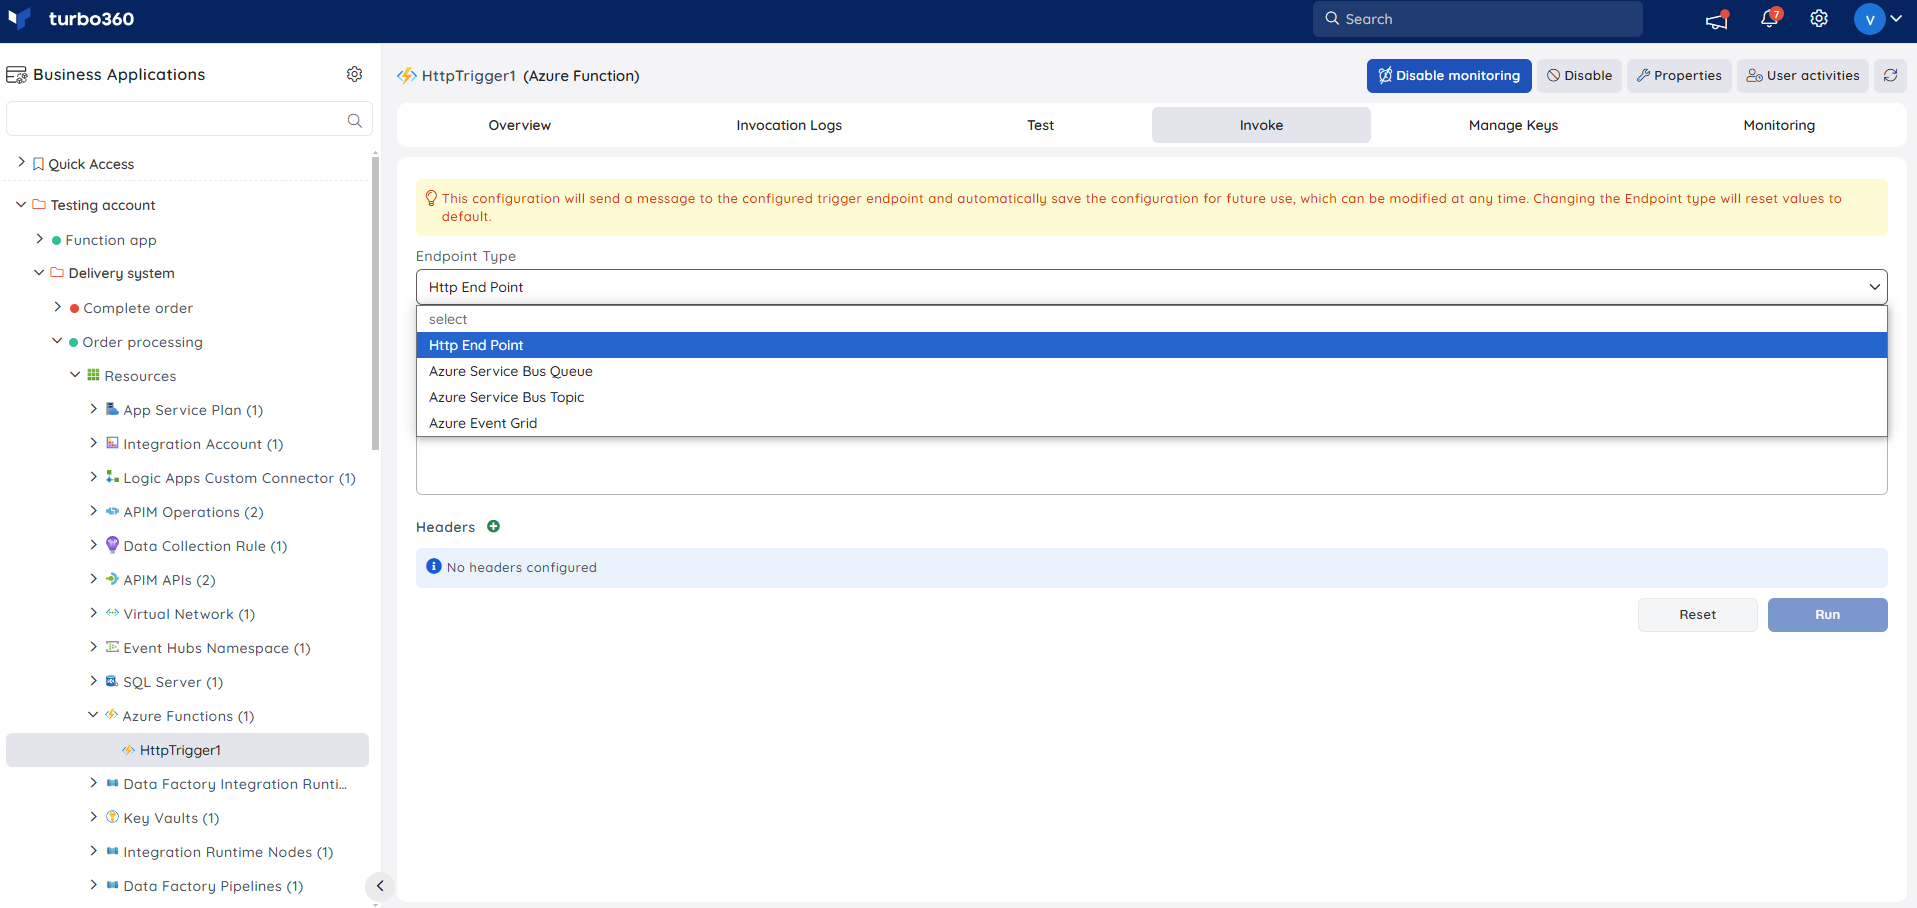
When a function invocation fails, you may need to reinvoke it by replaying the trigger message. Turbo360 supports invoking functions by sending a message directly to the function's trigger.
- Invoke — sends a message to the function's trigger. Use this when a failed invocation needs to be replayed after the root cause (such as a downstream service outage) has been resolved.
Supported trigger types: Service Bus Queue, Service Bus Topic, Event Grid, and HTTP.
To invoke a function:
- Open the Invoke Function screen.
- Provide the trigger details (connection string, queue name, or topic details depending on the trigger type).
- Send the message.
For example, for a Service Bus Queue-triggered function, provide the queue connection details and post the message from Turbo360.
View invocation logs
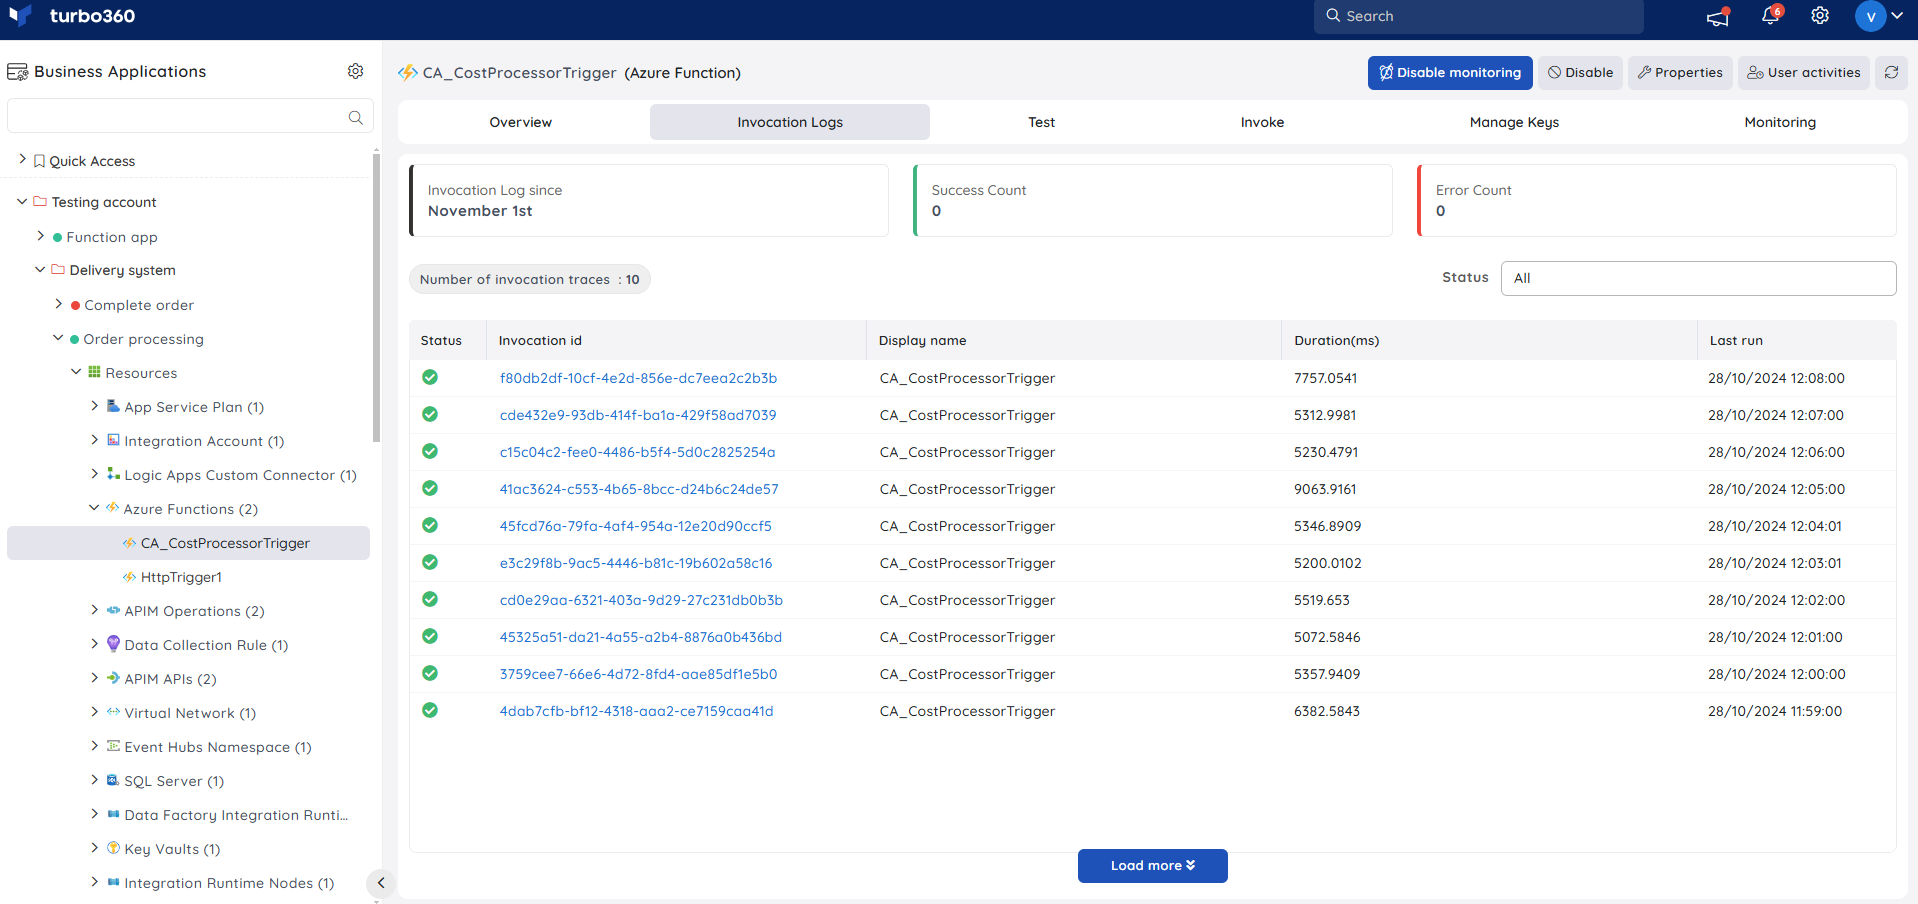
Turbo360 provides access to the invocation logs for individual Azure Functions.
- Filter logs by Succeeded or Failed state.
- Each log entry includes the invocation date, message, and log level.
Resource dashboard
Azure Function App
The Azure Function App resource dashboard surfaces execution and infrastructure metrics for the Function App host, giving you visibility into throughput, error rates, memory consumption, and I/O activity without opening the Azure portal.
| Widget | What it shows |
|---|---|
| Function Execution Count | Total number of function executions over the selected time range |
| Requests Count | Incoming HTTP request volume handled by the Function App |
| HTTP Errors | Count of HTTP 4xx and 5xx responses, indicating client or server-side failures |
| Data In vs Data Out | Inbound and outbound data transfer volumes, useful for detecting abnormal traffic patterns |
| Average Memory Working Set | Average memory consumed by the Function App process, helpful for identifying memory pressure |
| IO Read vs. IO Write | Read and write I/O operations, useful for spotting storage-bound performance issues |
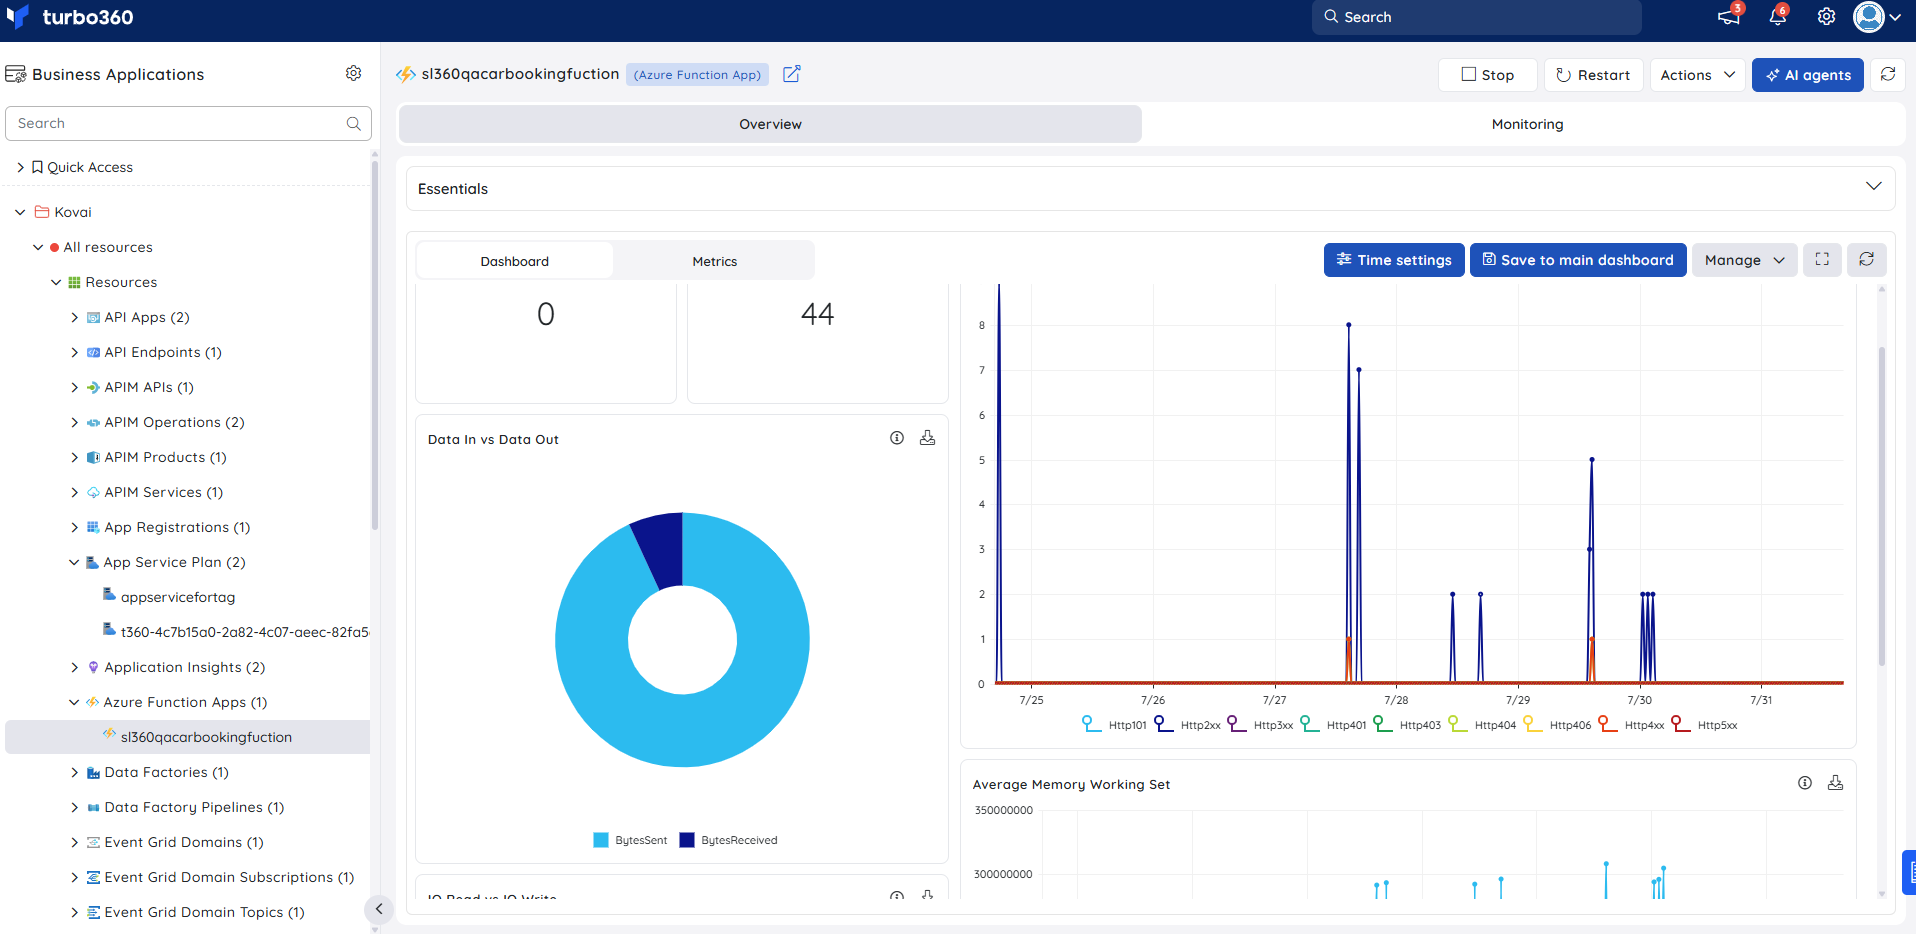
You can add, remove, or reconfigure widgets to focus on the metrics most relevant to your support scenario.
Azure Functions
To use resource dashboards for an individual Azure Function, the Application Insights resource created alongside the function deployment must be associated with the same Business Application.
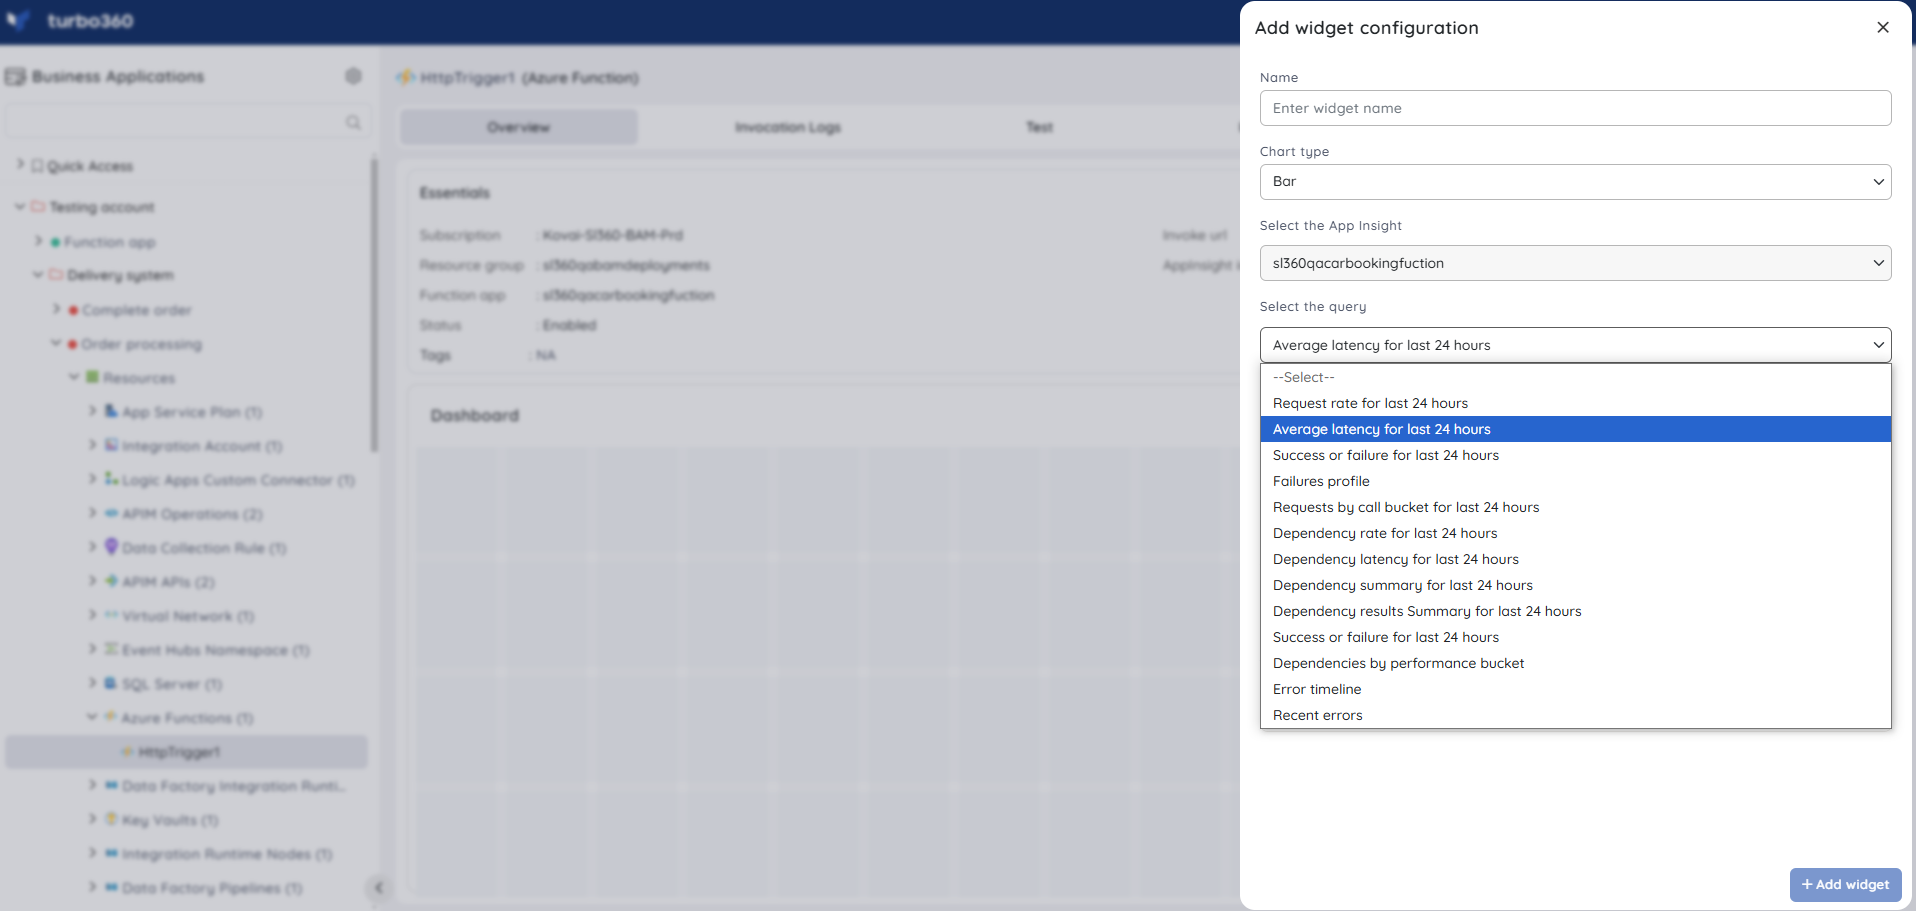
A default set of queries is available to create dashboard widgets using the associated Application Insights resource. The count chart type is not supported for Azure Function resource dashboards.
Azure Function resource dashboard widgets can only be created using the Application Insights resource deployed alongside the Azure Function. Creating dashboard widgets restricts access to additional Application Insights resources.
Metrics
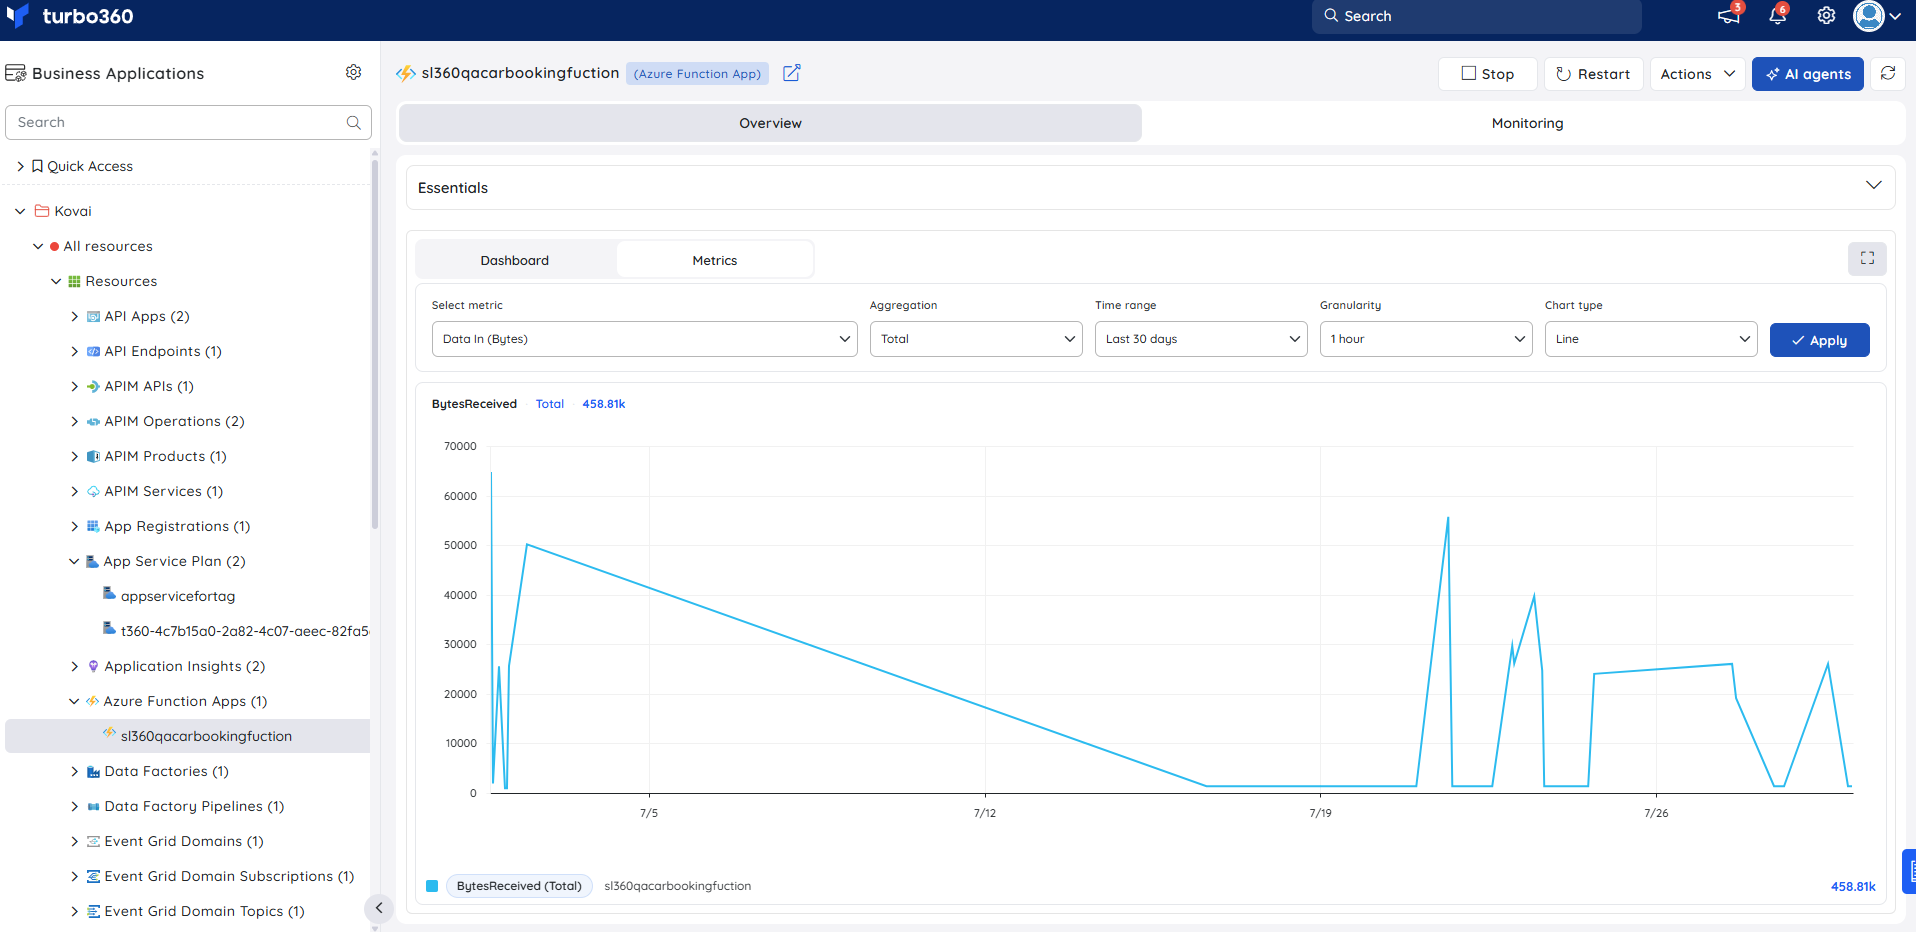
The Metrics tab lets you chart any Azure metric for your Azure Function App host directly in Turbo360, without switching to the Azure portal. Use it to visualize execution volume trends, memory growth over time, and HTTP error rates — particularly useful when identifying performance regressions after a deployment or diagnosing why a Function App is consuming more resources than expected.
Use the following controls to build your chart:
| Control | Description |
|---|---|
| Select metric | Choose the Azure metric to visualize (e.g. Function Execution Count, Requests, Http Errors, Average Memory Working Set, Data In, Data Out). |
| Aggregation | Set the aggregation method: Average, Min, Max, Total, or Count. |
| Time range | Set the time window for the data (e.g. Last 24 hours, Last 7 days). |
| Granularity | Set the data point resolution (e.g. 1 minute, 1 hour). |
| Chart type | Choose the visualization type: Line or Bar. |
Click Apply to render the chart.
Monitoring
You can configure availability status, state, instance, quotas, metrics, failure, and query monitoring rules for Azure Function App and Azure Function resources from the resource's Monitoring tab.
Monitoring rules are saved per resource. The monitoring state is updated after every monitoring cycle.
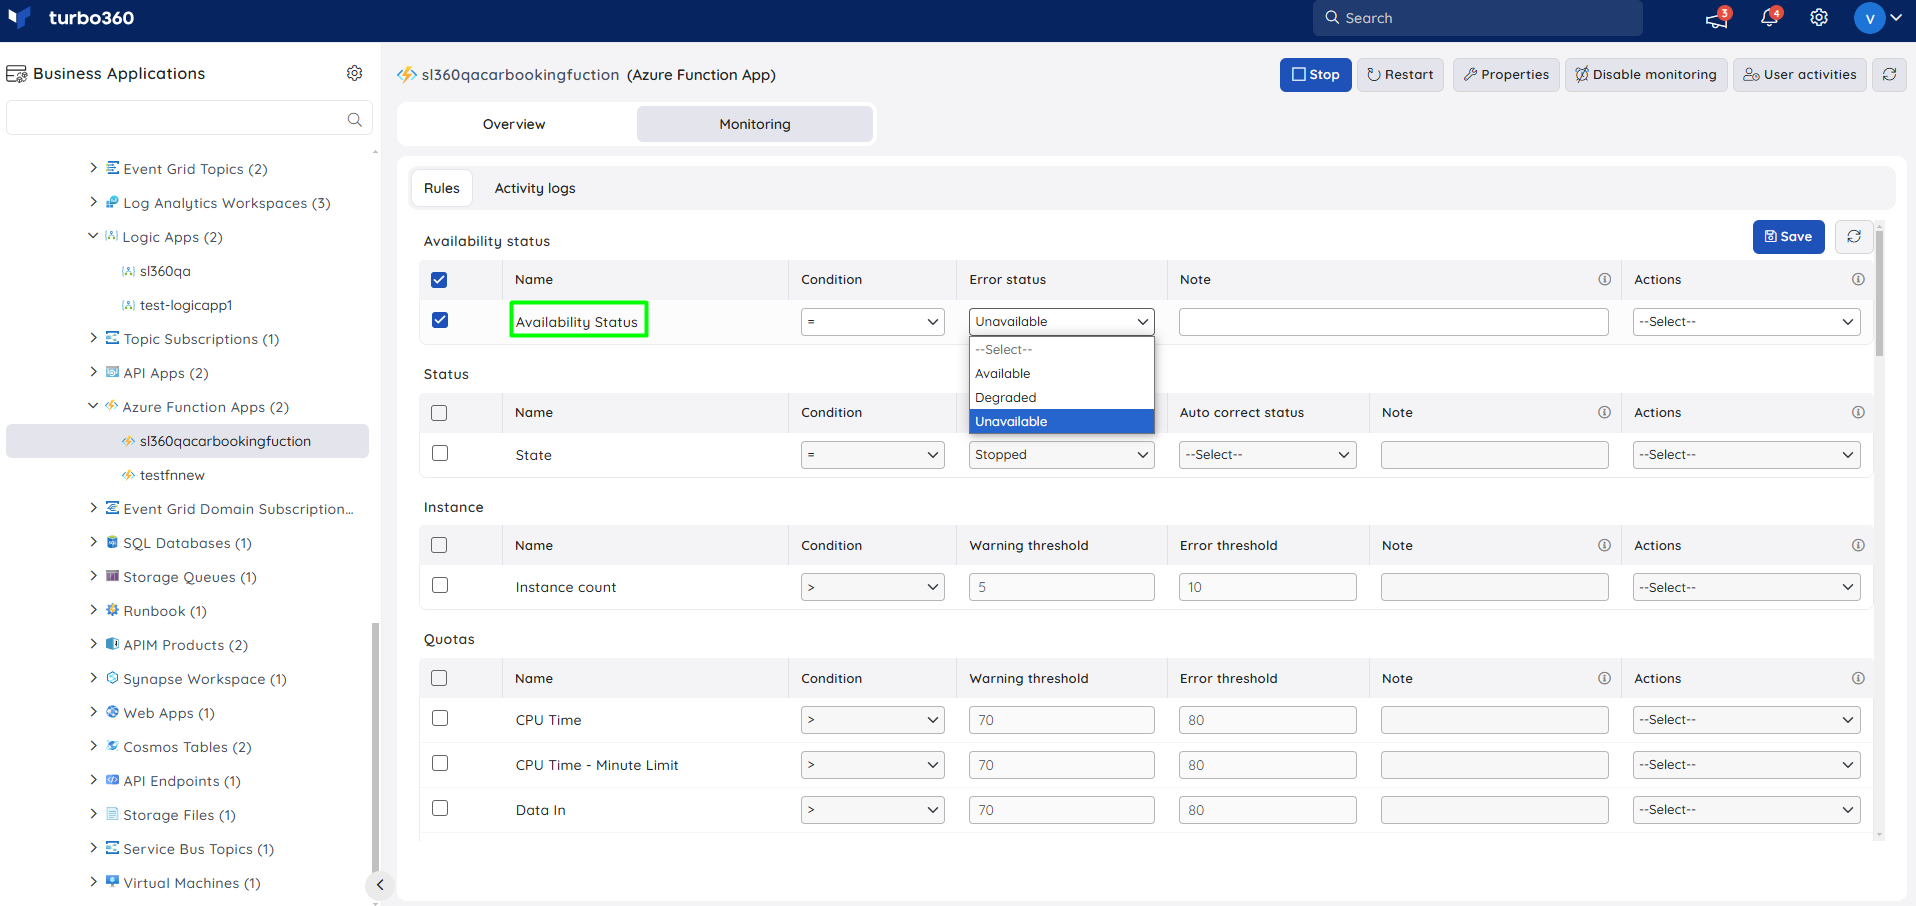
Availability status monitoring (Function App)
Tracks whether the Function App is reachable and responding. Use this when you need an alert if the Function App becomes unavailable due to a platform issue or misconfiguration.
- Navigate to Azure Function App > Monitoring.
- Configure the Availability status rule with the desired threshold.
- Click Save.
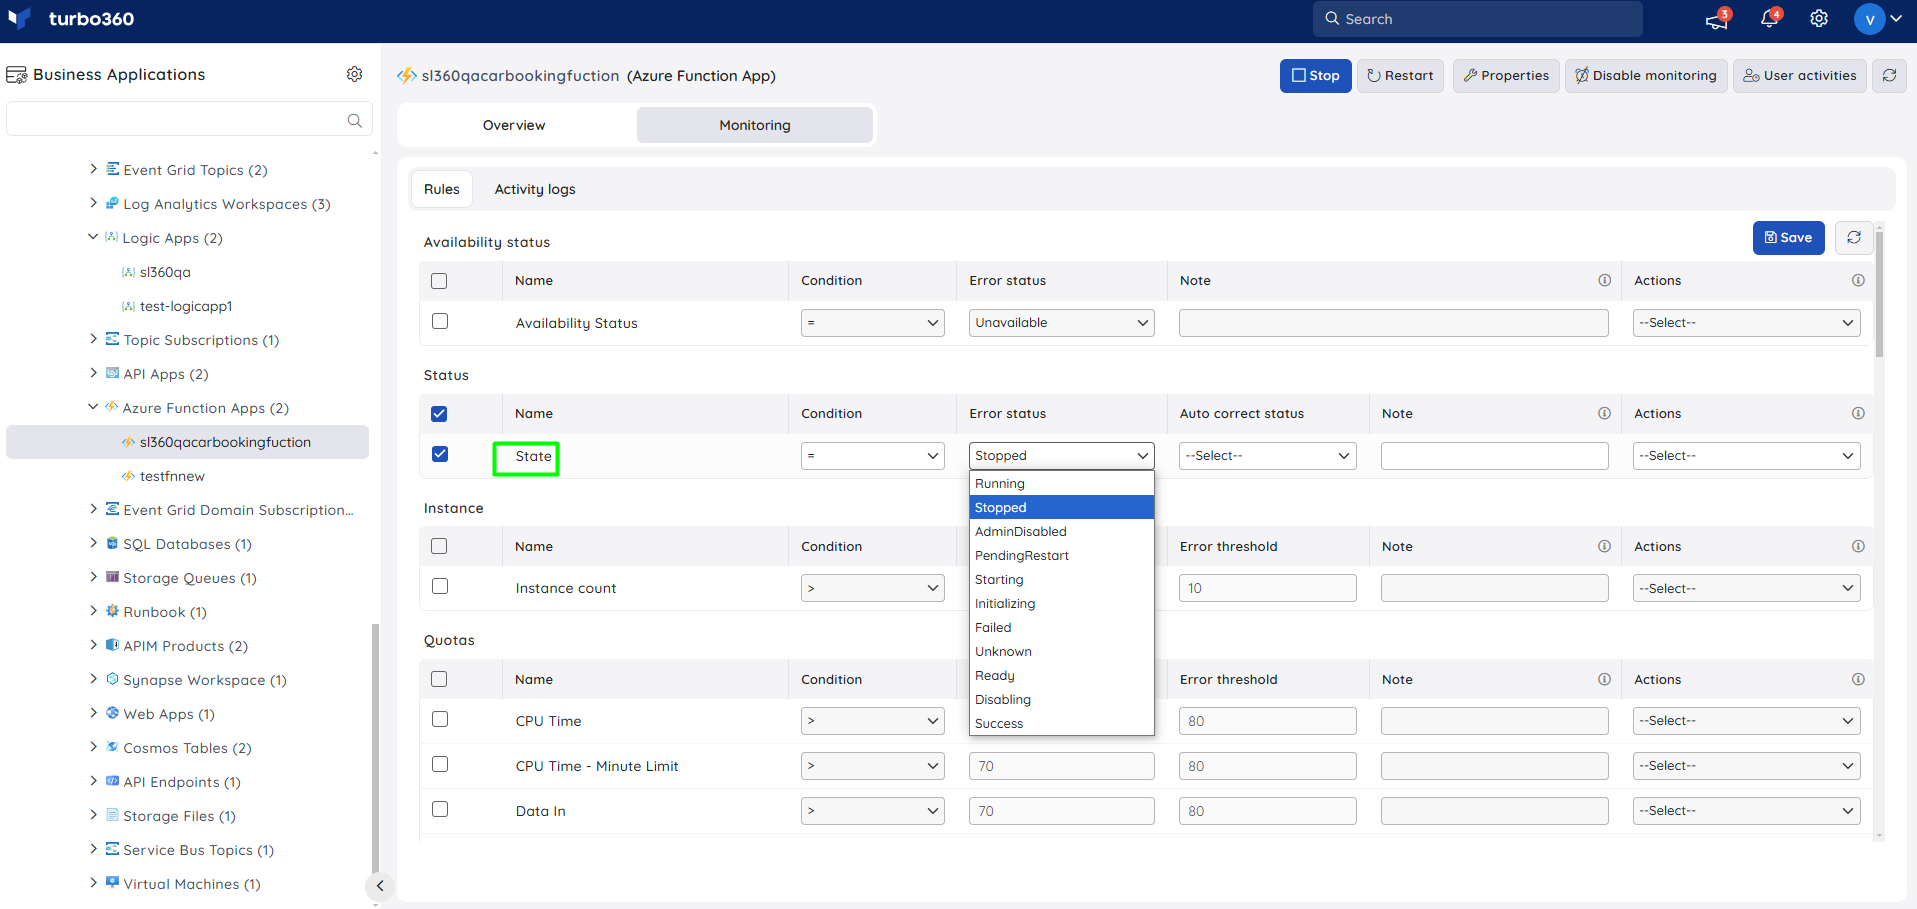
State monitoring (Function App)
Tracks the running state of the Function App host. Use this when you need an alert if the Function App enters a stopped or failed state unexpectedly.
- Navigate to Azure Function App > Monitoring.
- Configure the State rule under the Status category with the desired threshold.
- Click Save.
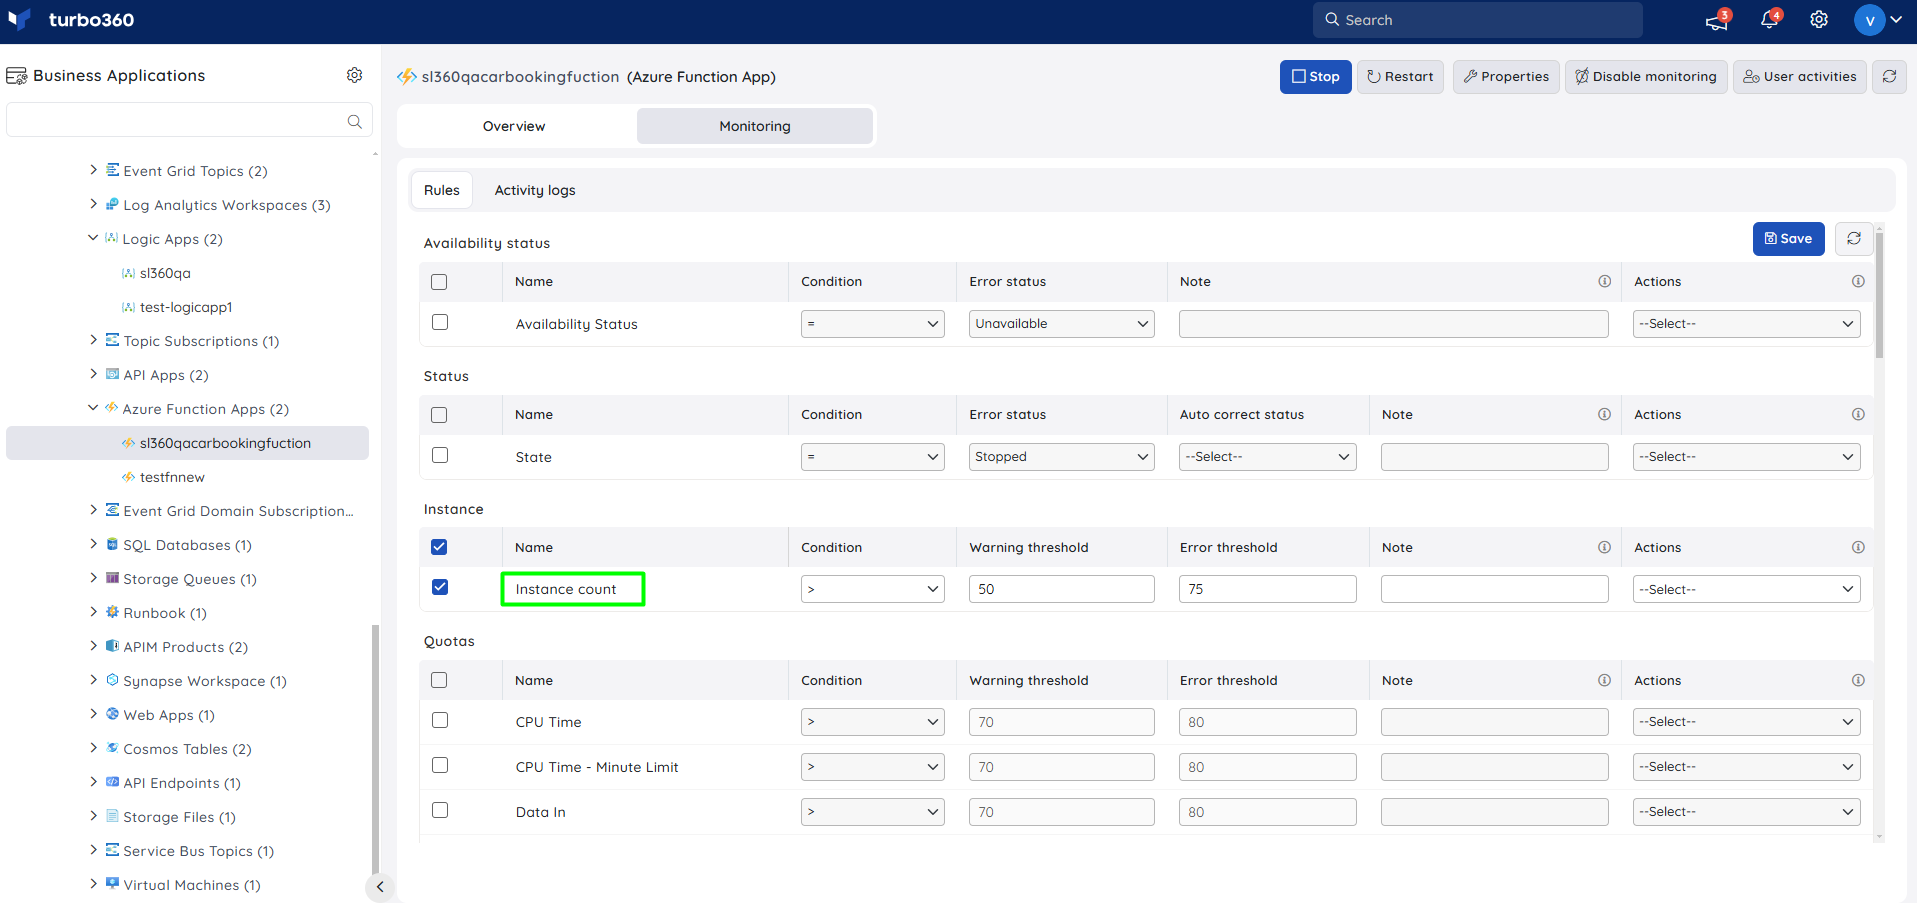
Instance monitoring (Function App)
Tracks the number of running instances of the Function App. Use this when you need an alert if the instance count drops below the expected minimum, indicating a scaling or availability issue.
- Navigate to Azure Function App > Monitoring.
- Configure the Instance threshold to determine the health state.
- Click Save.
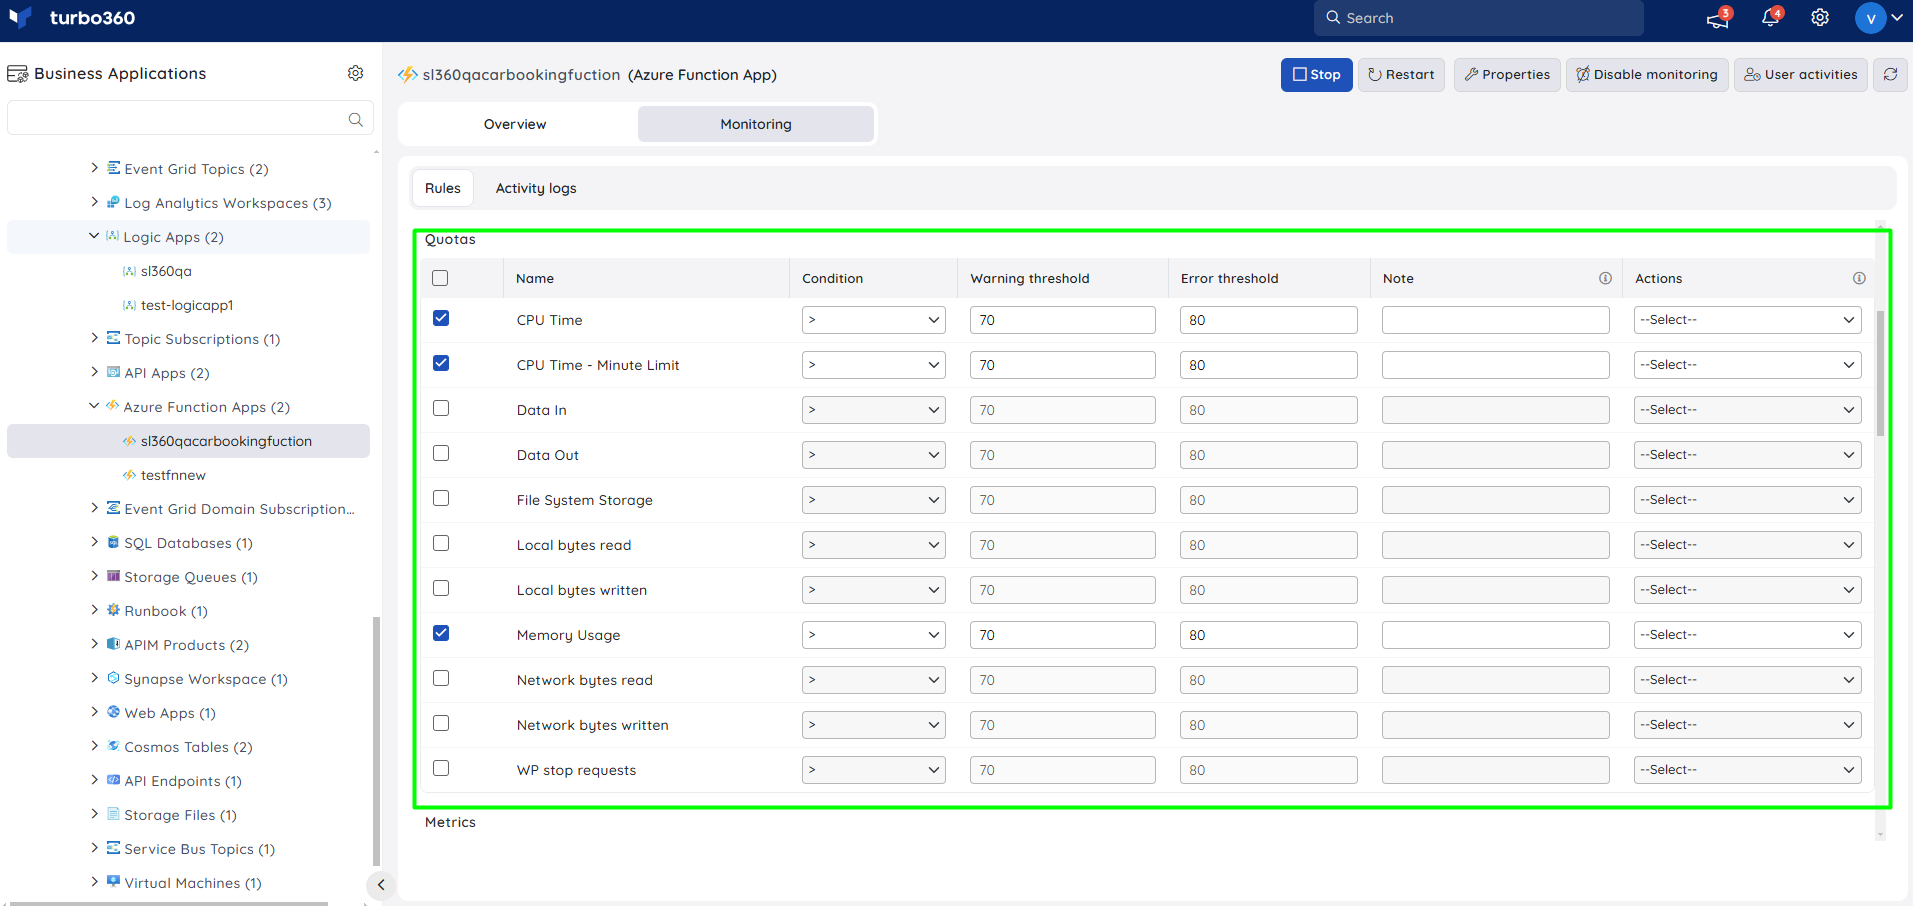
Quotas monitoring (Function App)
Tracks resource quota consumption for the Function App, such as CPU time and memory usage. Use this when you need an alert before the app reaches its plan limits and triggers throttling or stops.
- Navigate to Azure Function App > Monitoring.
- Configure the Quotas threshold to determine the health state.
- Click Save.
Metrics monitoring (Function App)
Tracks any Azure metric available for the Function App, such as execution count, response time, or error rate. Use this when you need threshold-based alerts on a specific performance indicator not covered by the built-in rule types.
- Navigate to Azure Function App > Monitoring.
- Configure the Metrics threshold to determine the health state.
- Click Save.
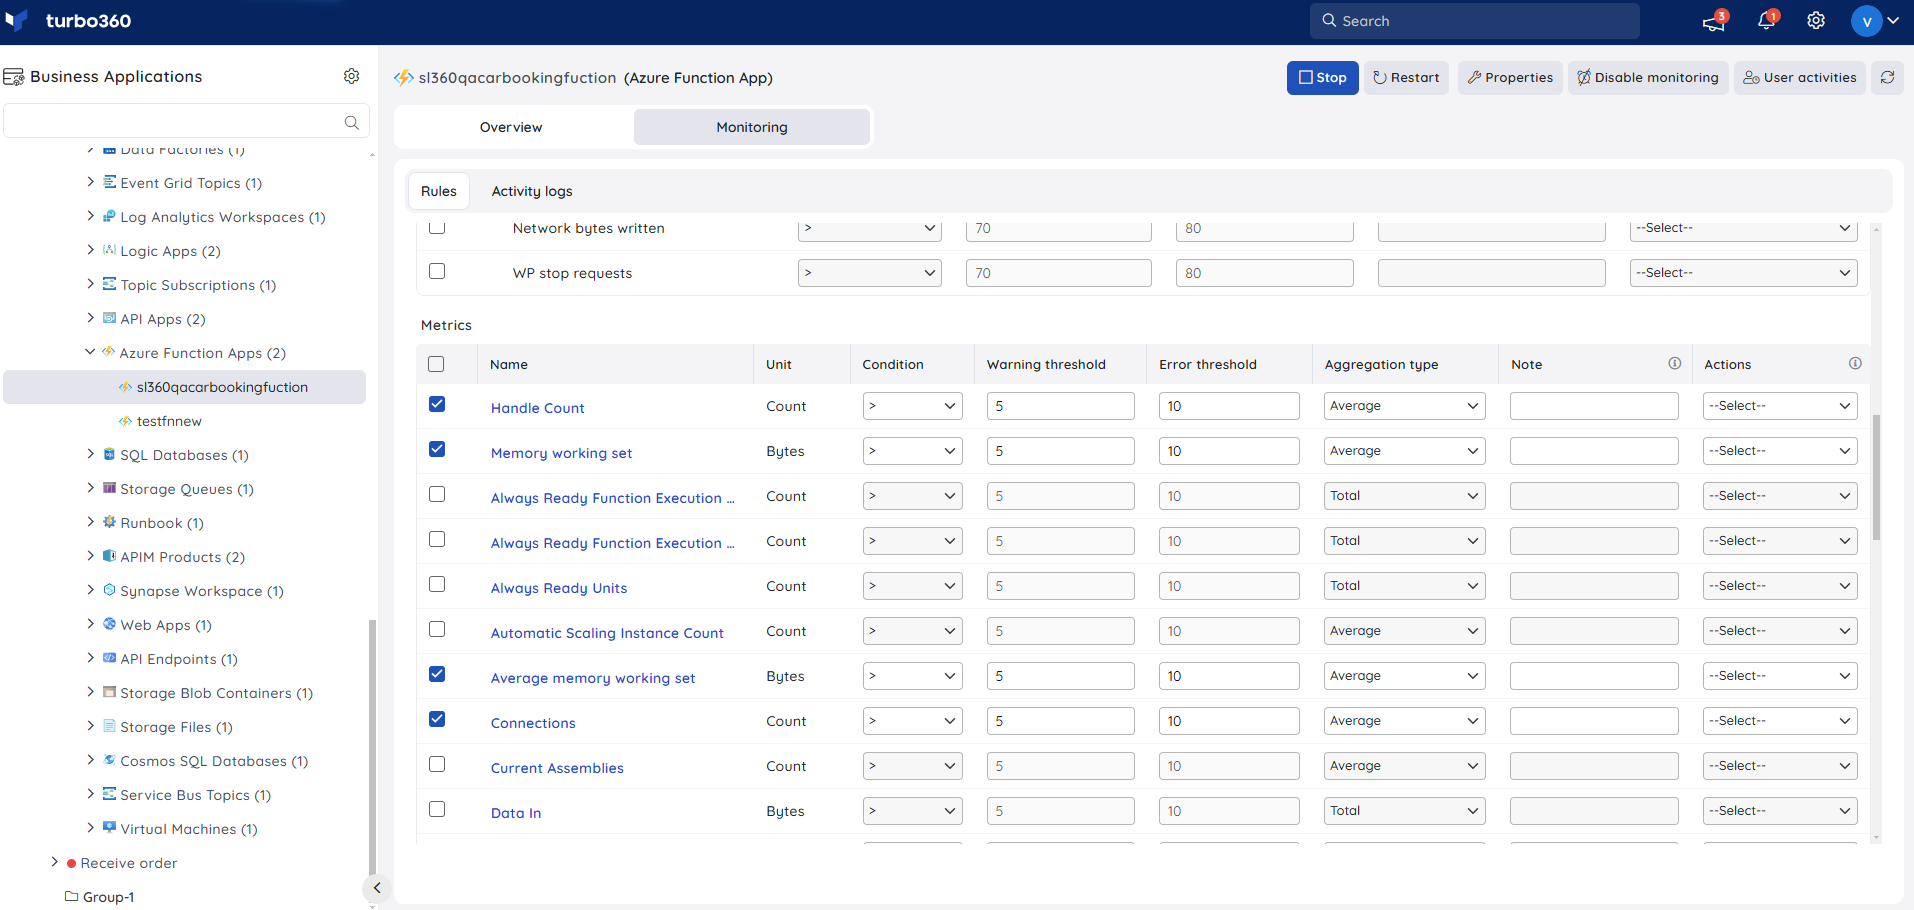
You can provide a threshold for any metric name directly, defining the rule to be violated when the metric value meets that threshold.
State monitoring (Azure Function)
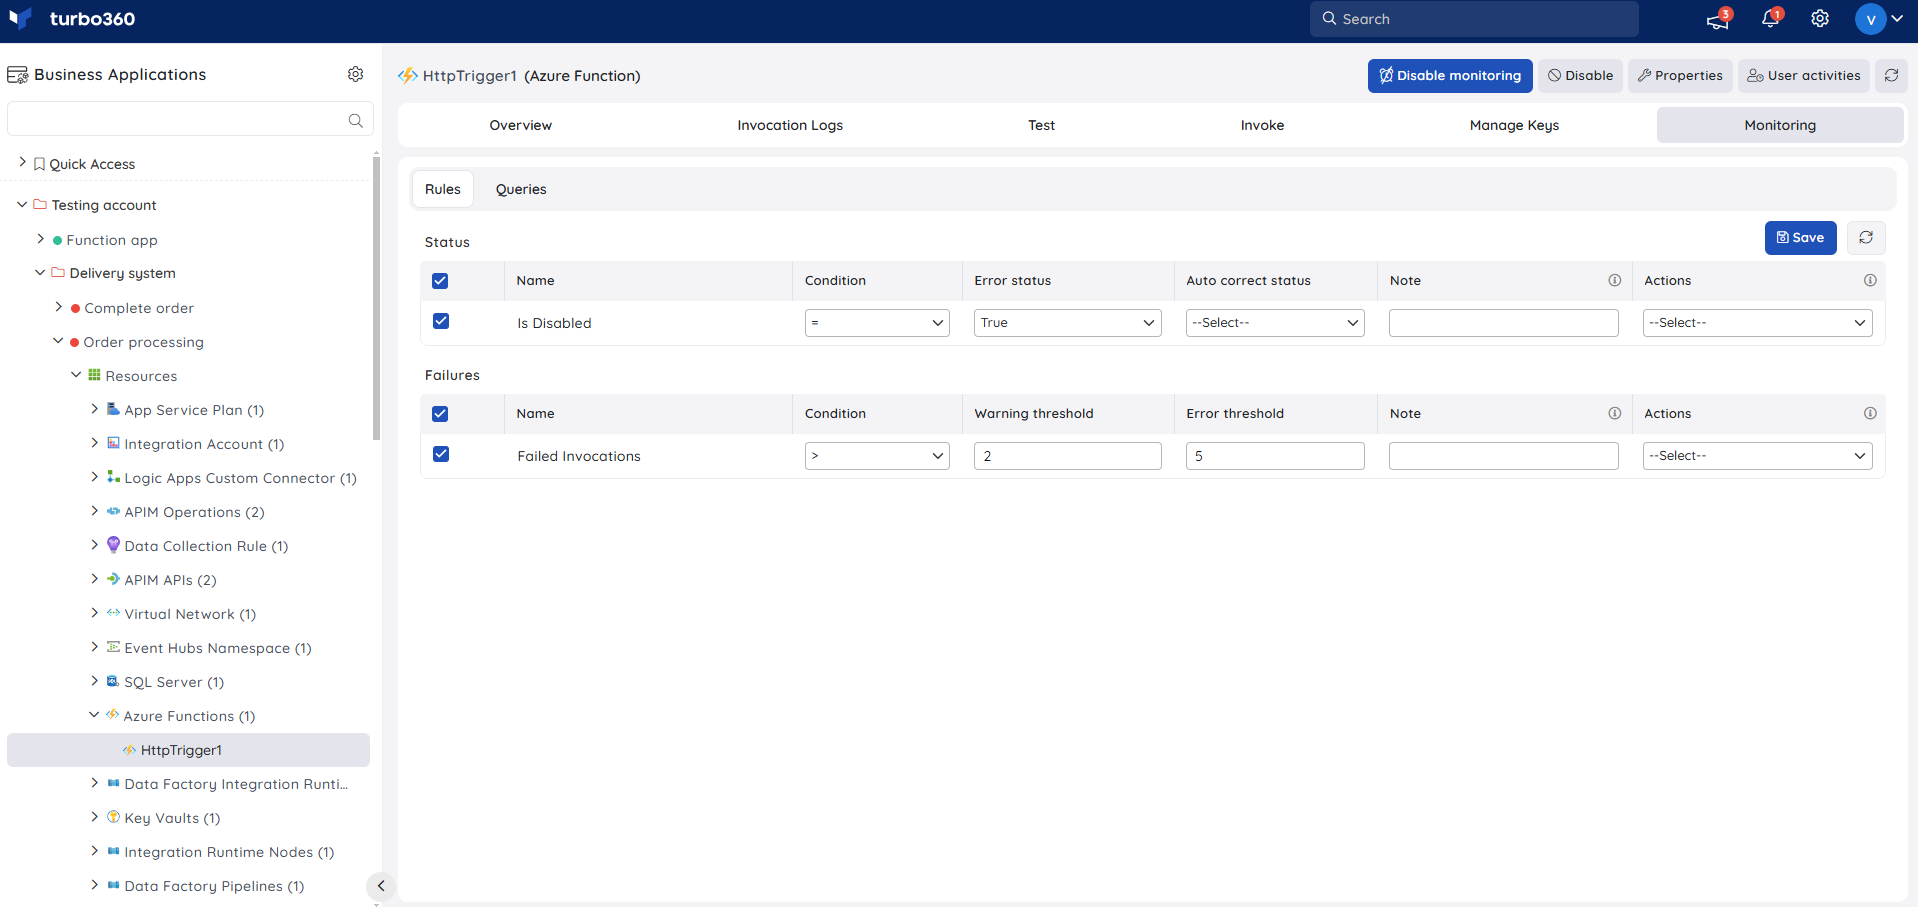
Tracks the enabled or disabled state of an individual function. Use this when you need an alert if a function is unexpectedly disabled or enters a failed state.
- Navigate to Azure Function > Monitoring.
- Configure the threshold value for the State rule to determine the health state.
- Click Save.
Failure monitoring (Azure Function)
Tracks failed invocations for an individual function. Use this when you need an alert as soon as invocation failures exceed a threshold, so you can investigate or replay trigger messages promptly.
- Navigate to Azure Function > Monitoring.
- Select Failed invocations under Failures and configure the threshold values.
- Click Save.
Query monitoring (Azure Function)
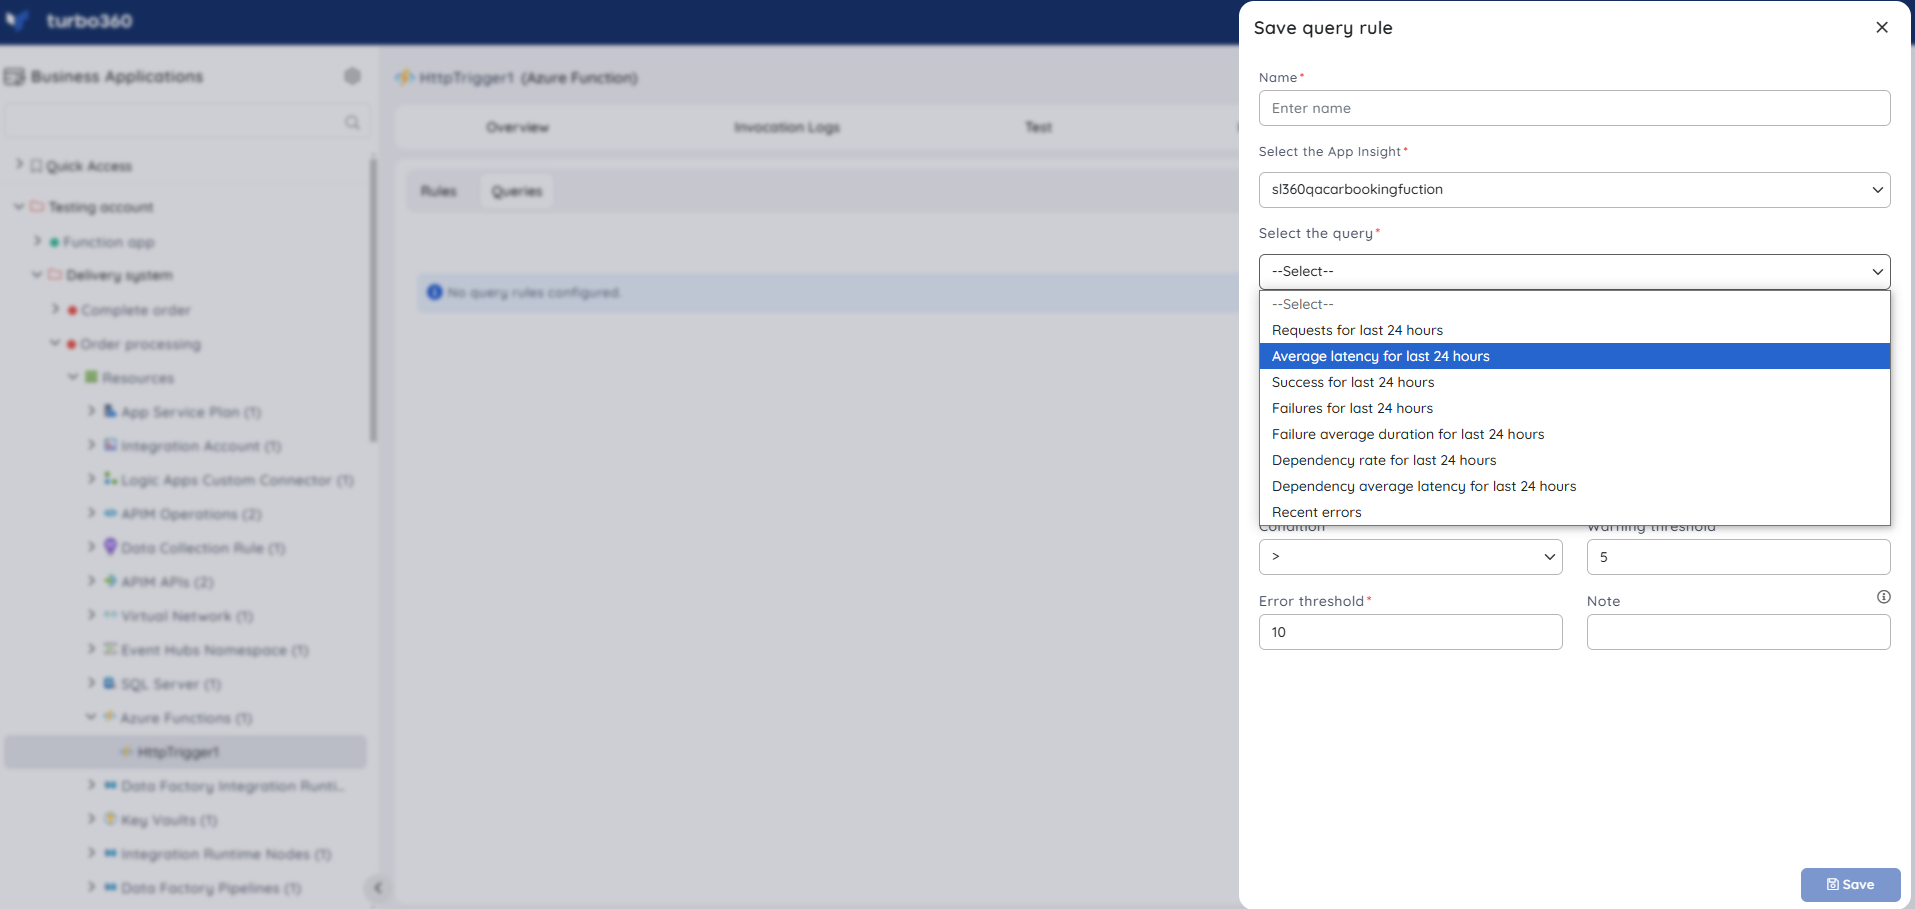
Runs a custom Application Insights query on a schedule and alerts when the result meets a configured threshold. Use this when you need to monitor a metric or pattern not covered by the built-in rule types, such as average response latency or a specific dependency failure rate.
- Navigate to Azure Function > Monitoring and switch to the Queries tab.
- Click Add.
- Enter a name for the query rule.
- Choose an Application Insights resource to fetch query data.
- Enter the query manually or select one from saved queries using Open from saved queries.
- Select the preferred time range.
- Click Execute to run the query.
- Select the required query columns and configure the threshold values.
- Click Save.
Limitations
- Azure Function resource dashboard widgets can only be created using the Application Insights resource deployed alongside the Azure Function. You cannot use other Application Insights resources for this purpose.
- The count chart type is not supported for Azure Function resource dashboards.
- Trigger invocation is not supported for Timer-triggered functions.
Troubleshooting
Monitoring state not updating after saving a rule
Cause: The monitoring cycle has not yet completed.
Fix: Wait for the next monitoring cycle. Monitoring state is reflected after each cycle completes.Invocation logs not appearing
Cause: The Application Insights resource associated with the Function App may not be added to the Business Application in Turbo360.
Fix: Add the Application Insights instance to the same Business Application as the Azure Function App, then reload the invocation logs.Invoke trigger fails to send the message
Cause: The trigger connection details may be incorrect, the trigger type is Timer (not supported), or the user does not have the Manage permission for Azure Function.
Fix: Verify the connection string, queue name, or topic details in the Invoke Function screen, confirm the trigger type supports manual invocation, and check that the user's role includes Manage for Azure Function.Resource dashboard widgets not loading for Azure Function
Cause: The Application Insights resource was not associated with the Business Application, or a different Application Insights resource was selected after initial configuration.
Fix: Ensure the correct Application Insights resource (the one deployed with the function) is associated with the Business Application. Reassociate if needed.Function App state monitoring alert firing when app is running
Cause: The state rule threshold may be configured incorrectly, or there is a temporary health status inconsistency reported by Azure.
Fix: Review the State rule configuration under Azure Function App > Monitoring and verify the function app's actual state in the Azure portal.
Related articles
Was this article helpful?