

Monitoring a Business Application
- 12 Aug 2026
- 12 Minutes to read
- Print
- DarkLight
- Download PDF
Monitoring a Business Application
- Updated on 12 Aug 2026
- 12 Minutes to read
- Print
- DarkLight
- Download PDF
Article summary
Did you find this summary helpful?
Thank you for your feedback!
Overview
The monitoring capabilities in Business Applications module lets you monitor the state and metrics of every Azure resource grouped inside a Business Application, from a single integrated view instead of the Azure portal.
Turbo360 groups distributed Azure resources — often spread across multiple subscriptions — into a Business Application, so you can apply consistent monitoring rules and thresholds across the whole solution rather than per resource.
Business value
Centralized Business Application monitoring reduces the time it takes to detect and respond to issues across a distributed solution, since you don't need to check each Azure resource individually in the Azure portal. Configurable thresholds, auto-correction, and automated tasks let teams resolve common failures without manual intervention.
Prerequisites
- The Azure resources you want to monitor must already be associated with the Business Application.
- To reuse a shared rule set across multiple resources, the relevant Monitoring profile must already be created and mapped to the Business Application.
- To receive alerts, at least one notification channel or recipient email must be configured.
Required permissions
Working with Business Application monitoring requires the Monitoring feature permission:
- Read — view monitor settings.
- Manage — toggle monitoring, edit monitor settings, and edit monitoring metrics and status for an individual resource, provided the user also has at least Read access to that resource.
.png)
To update monitoring rules from the Monitoring tab within an individual resource, a user needs at least Read permission for that resource and the Monitoring feature permission set to Manage.
.png)
Working with monitoring profiles requires the separate Monitoring profile feature permission (Read/Manage). Configuring notification channels and escalation policies used for alerting requires the account-level Manage notification channels and Manage escalation policy permissions, respectively.
.png)
A user with the Contributor or Owner role is additionally required to update the Summary monitoring configuration for Business Applications.
Dependencies
- Monitoring profiles, if used, must be configured and mapped to the Business Application before profile-based rules apply.
- Notification channels and escalation policies must be configured in advance to receive alerts and route notifications.
How it works
Manage monitoring profiles
Profiles assigned to a Business Application are visible from Business Application > Monitoring > [Profile], or managed from Settings > Monitoring Settings > Monitoring profiles.
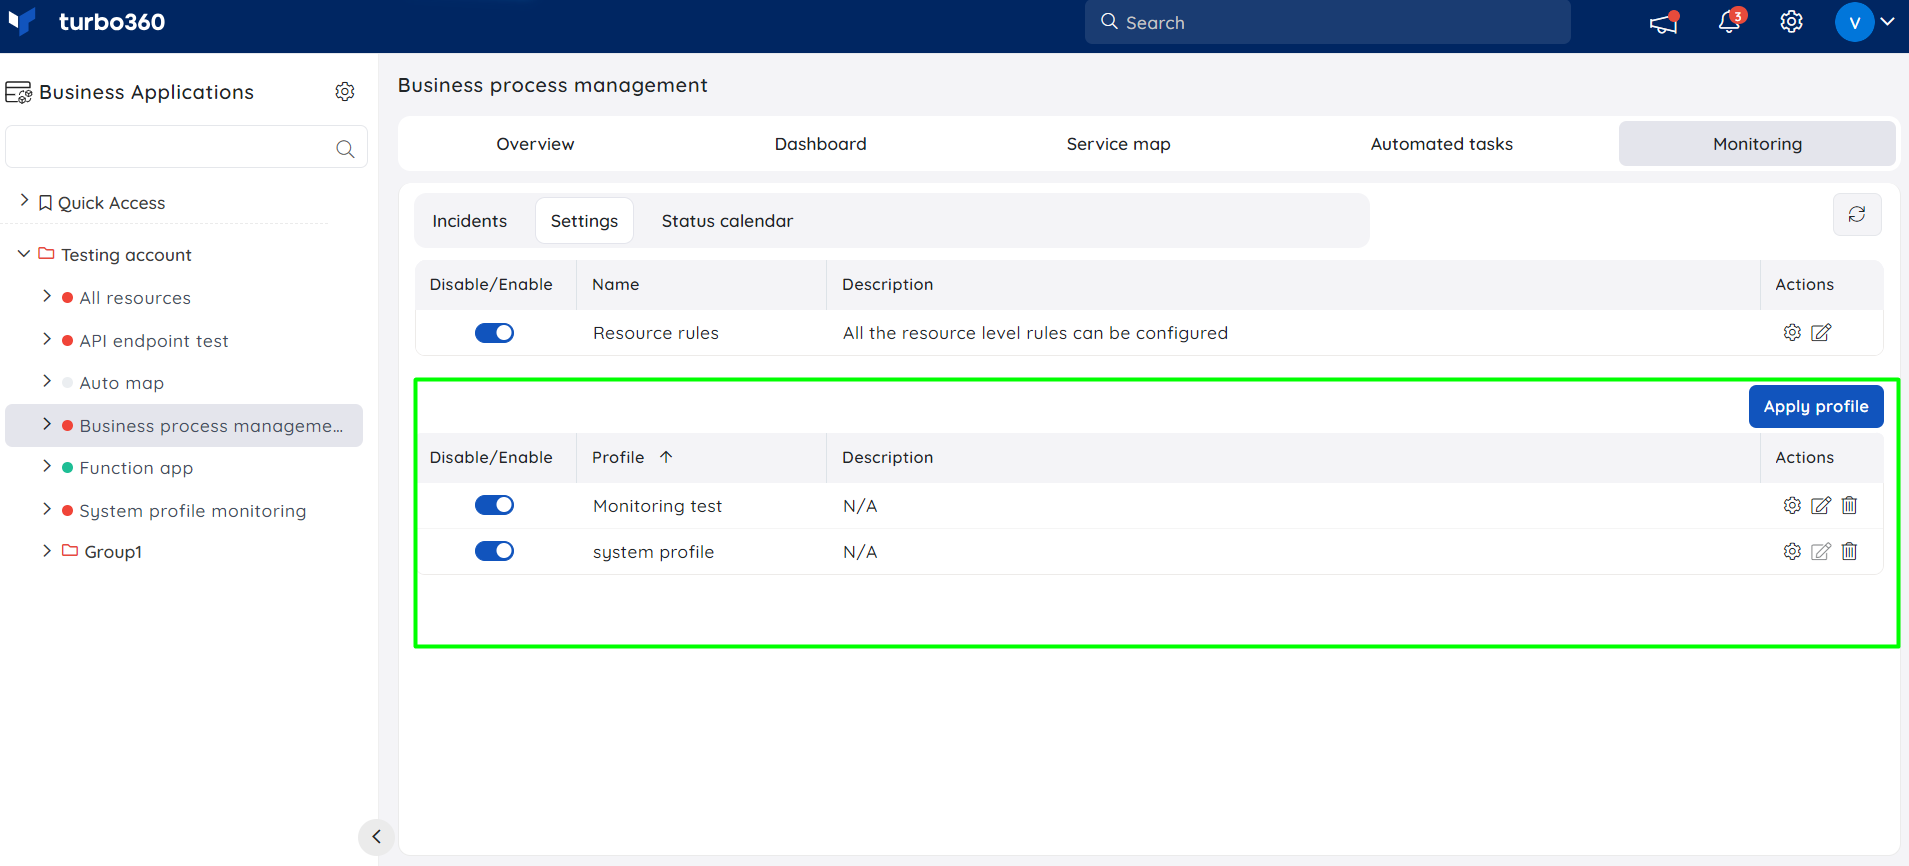
Click here to know more about monitoring profiles.
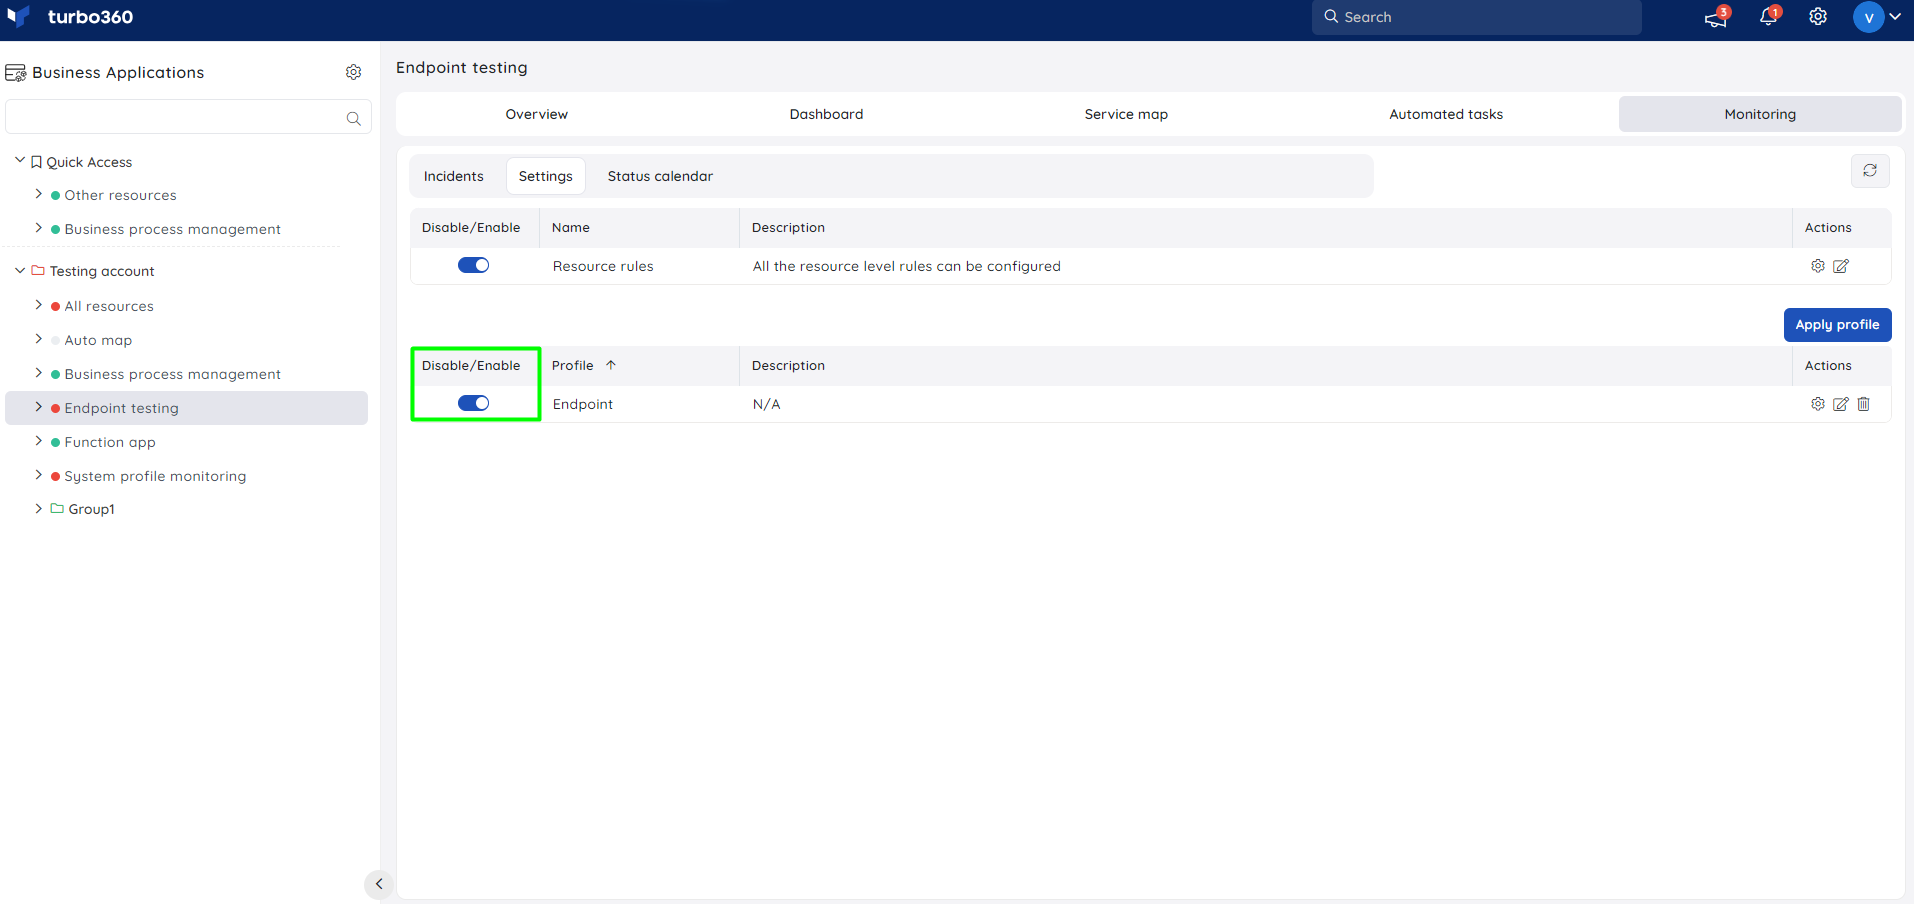
Enabling or disabling the Monitoring toggle for a profile only affects monitoring based on the rules configured within that profile.
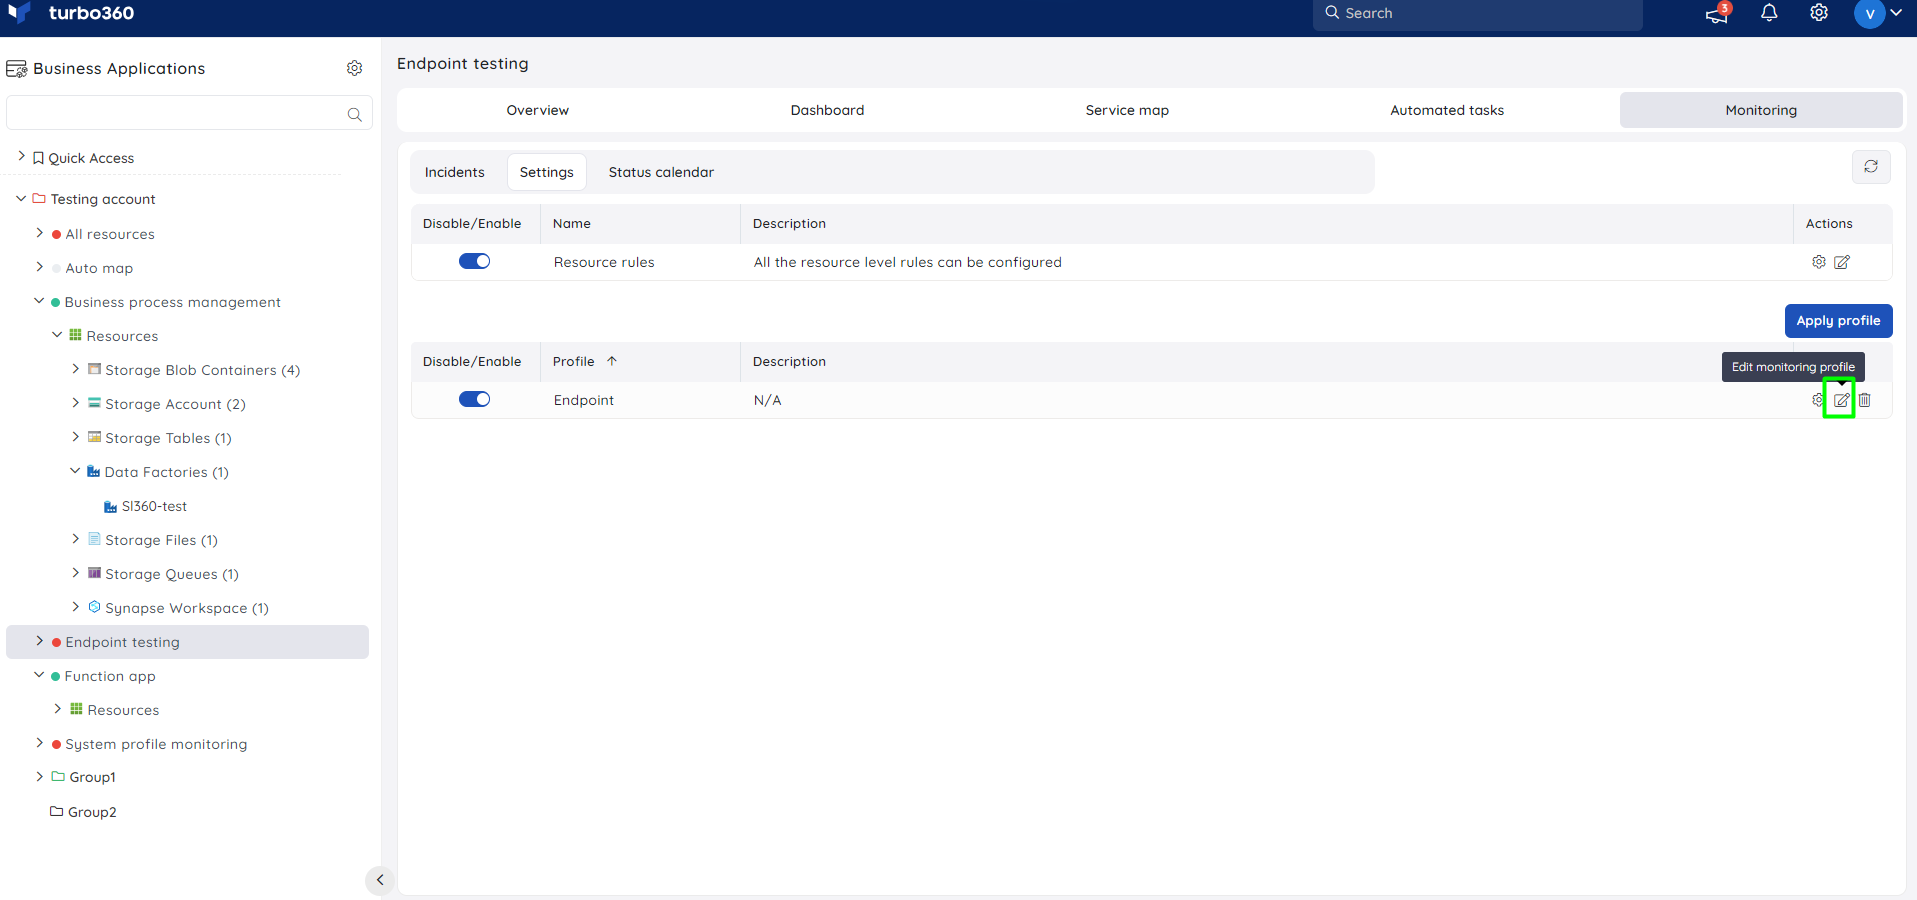
To manage profile rules, go to Settings > Monitoring Settings > Monitoring profiles, or open the Monitoring section of a Business Application the profile is mapped to, then click the Edit icon to update the profile. Changes apply to the original profile and are reflected across every Business Application configured with it.
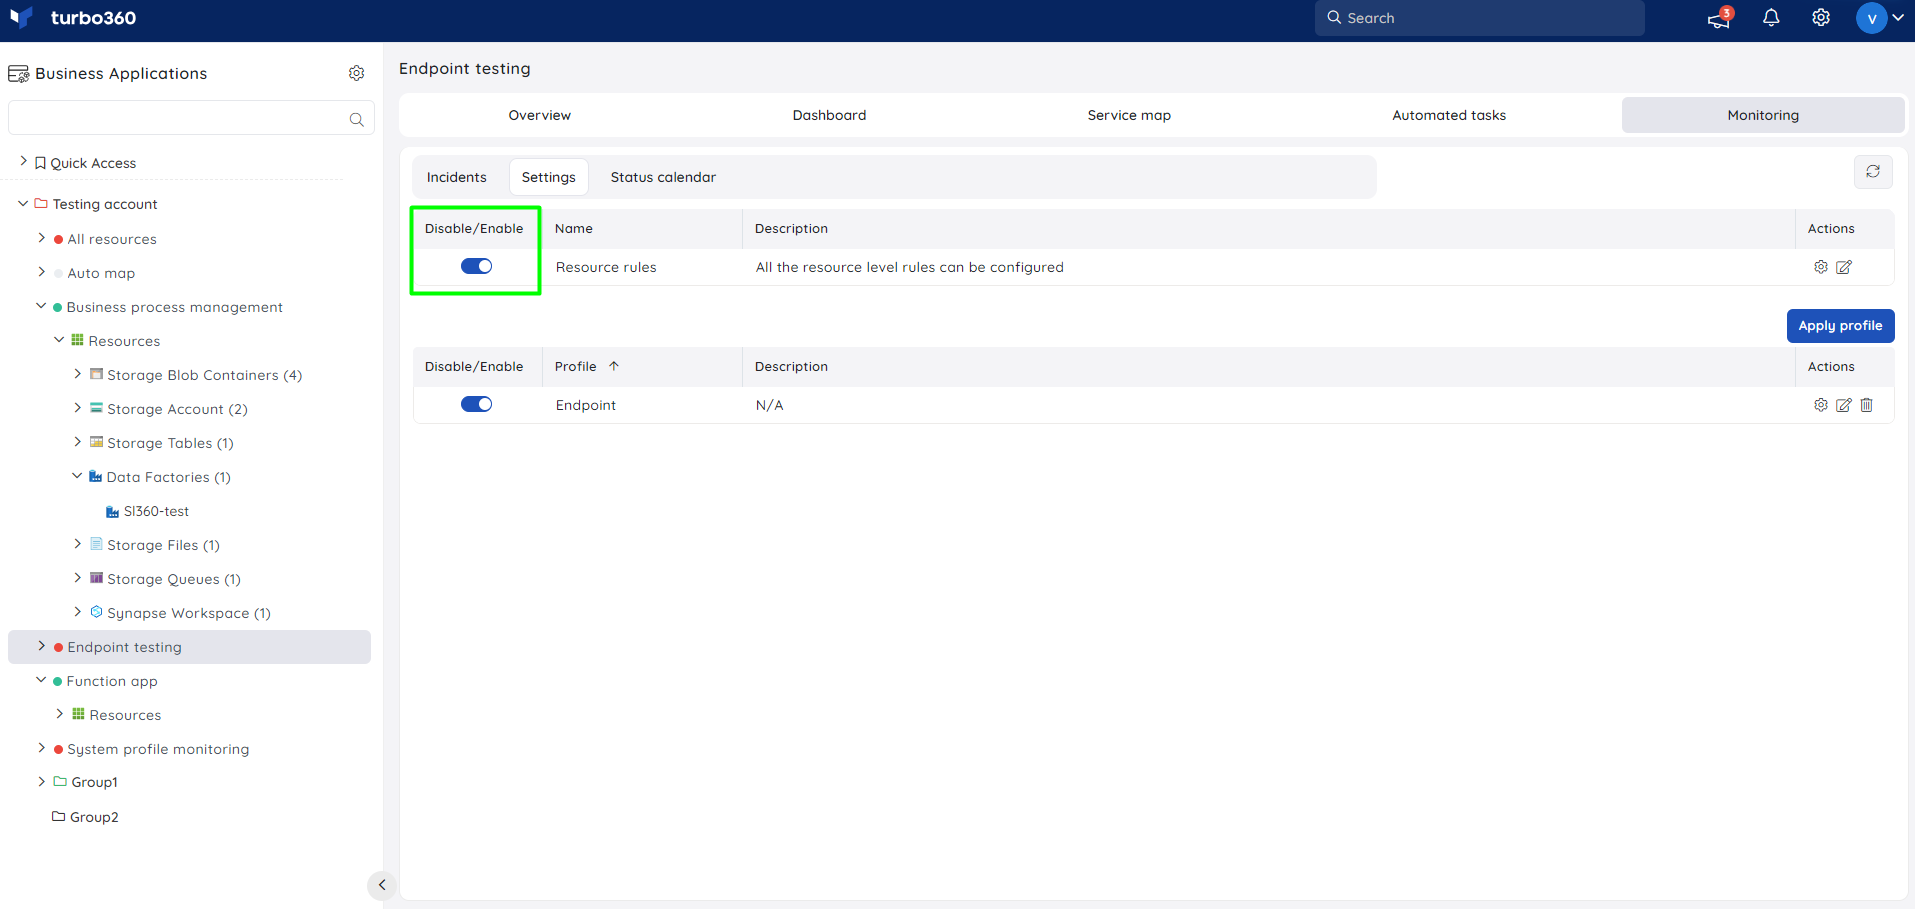
Enable or disable resource rules
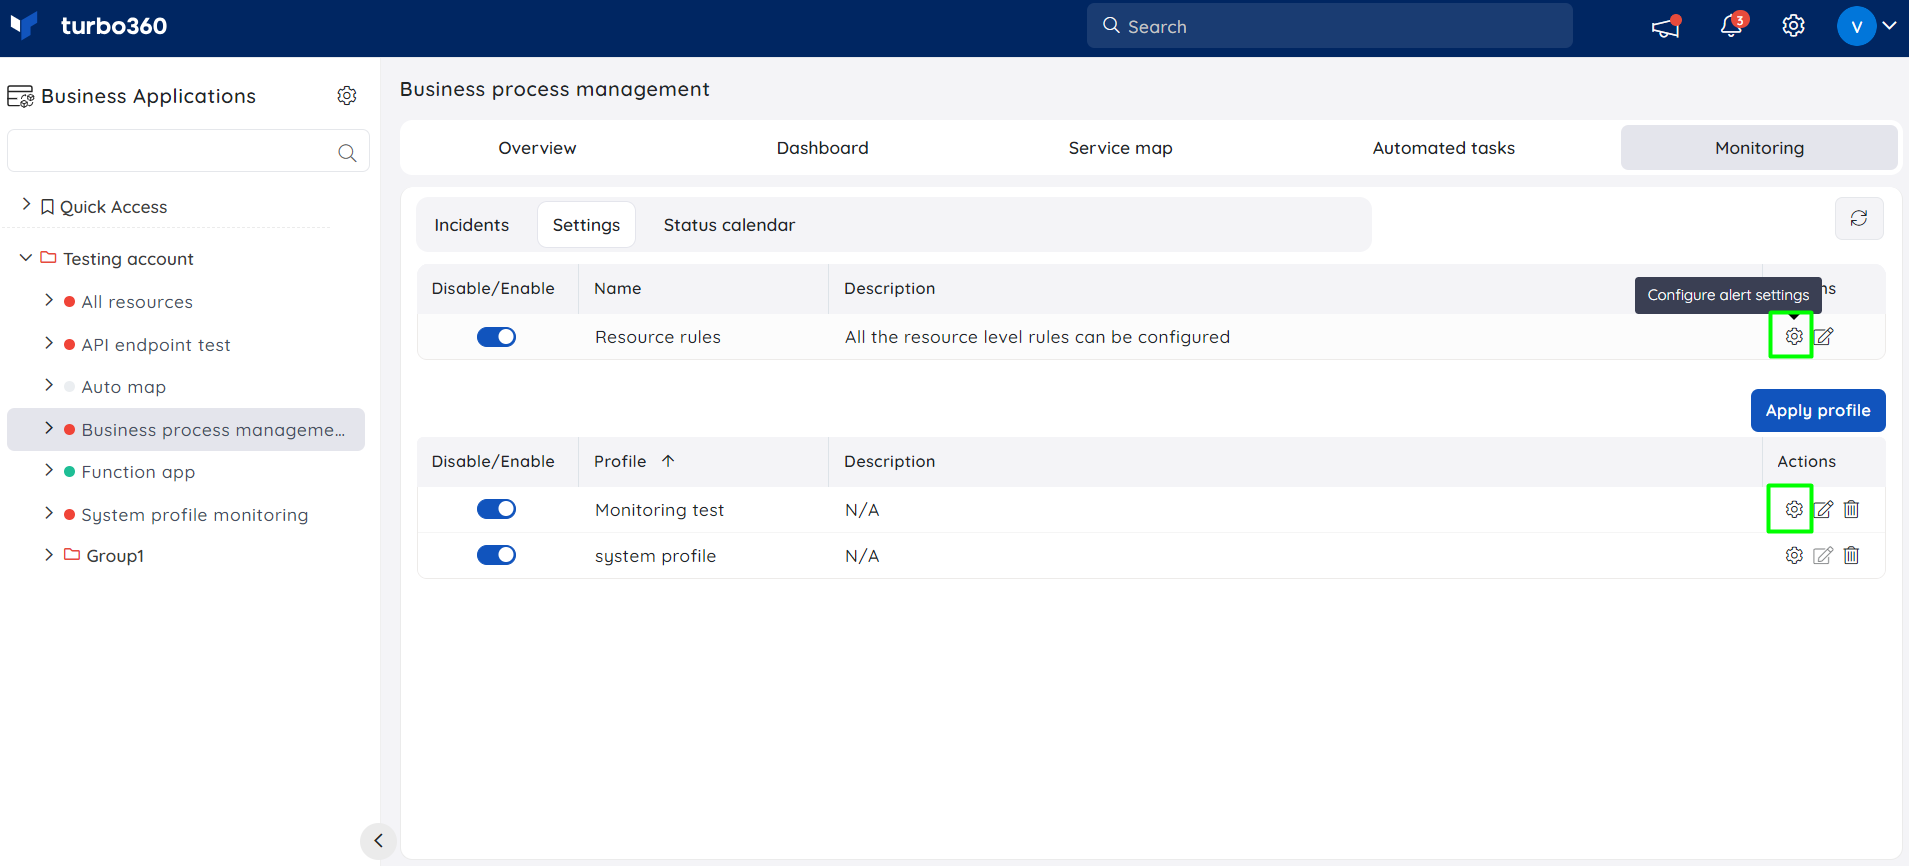
The Monitoring toggle for Resource rules, available from Business Application > Monitoring > Settings > Resource rules, enables or disables resource monitoring for the rules configured at each resource level.
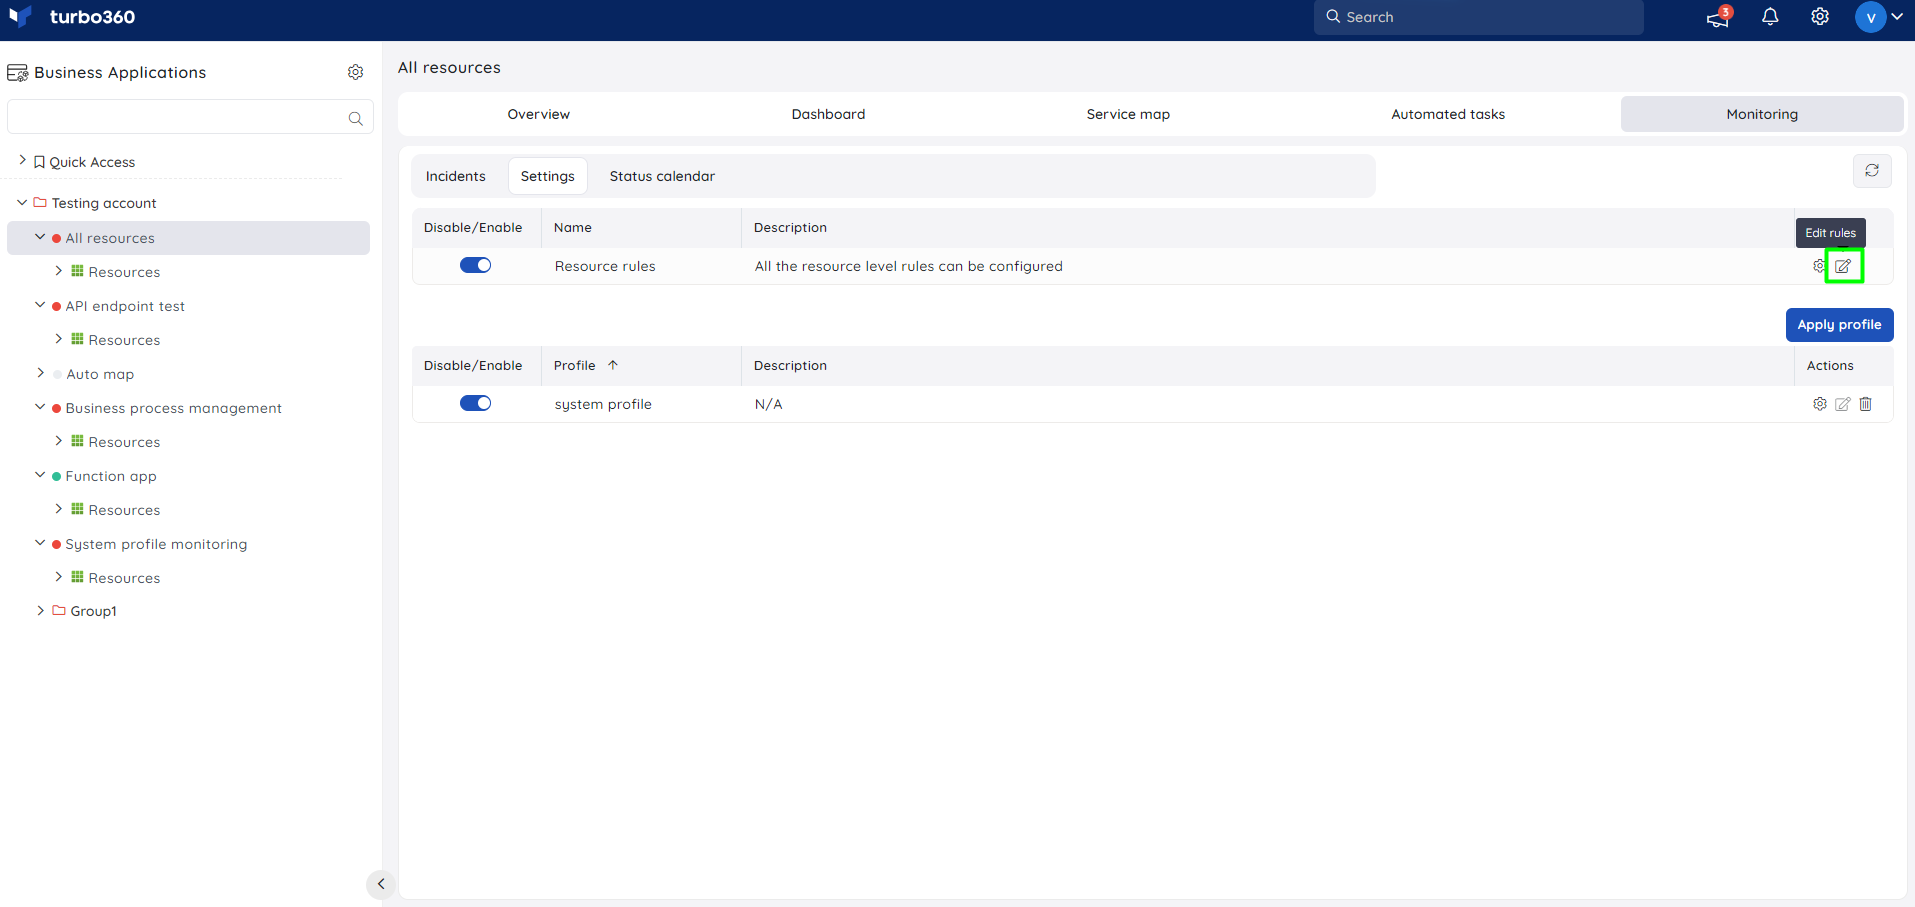
To manage resource rules for all associated resources from a single location, go to Monitoring > Settings within the Business Application and click Edit next to Resource rules.
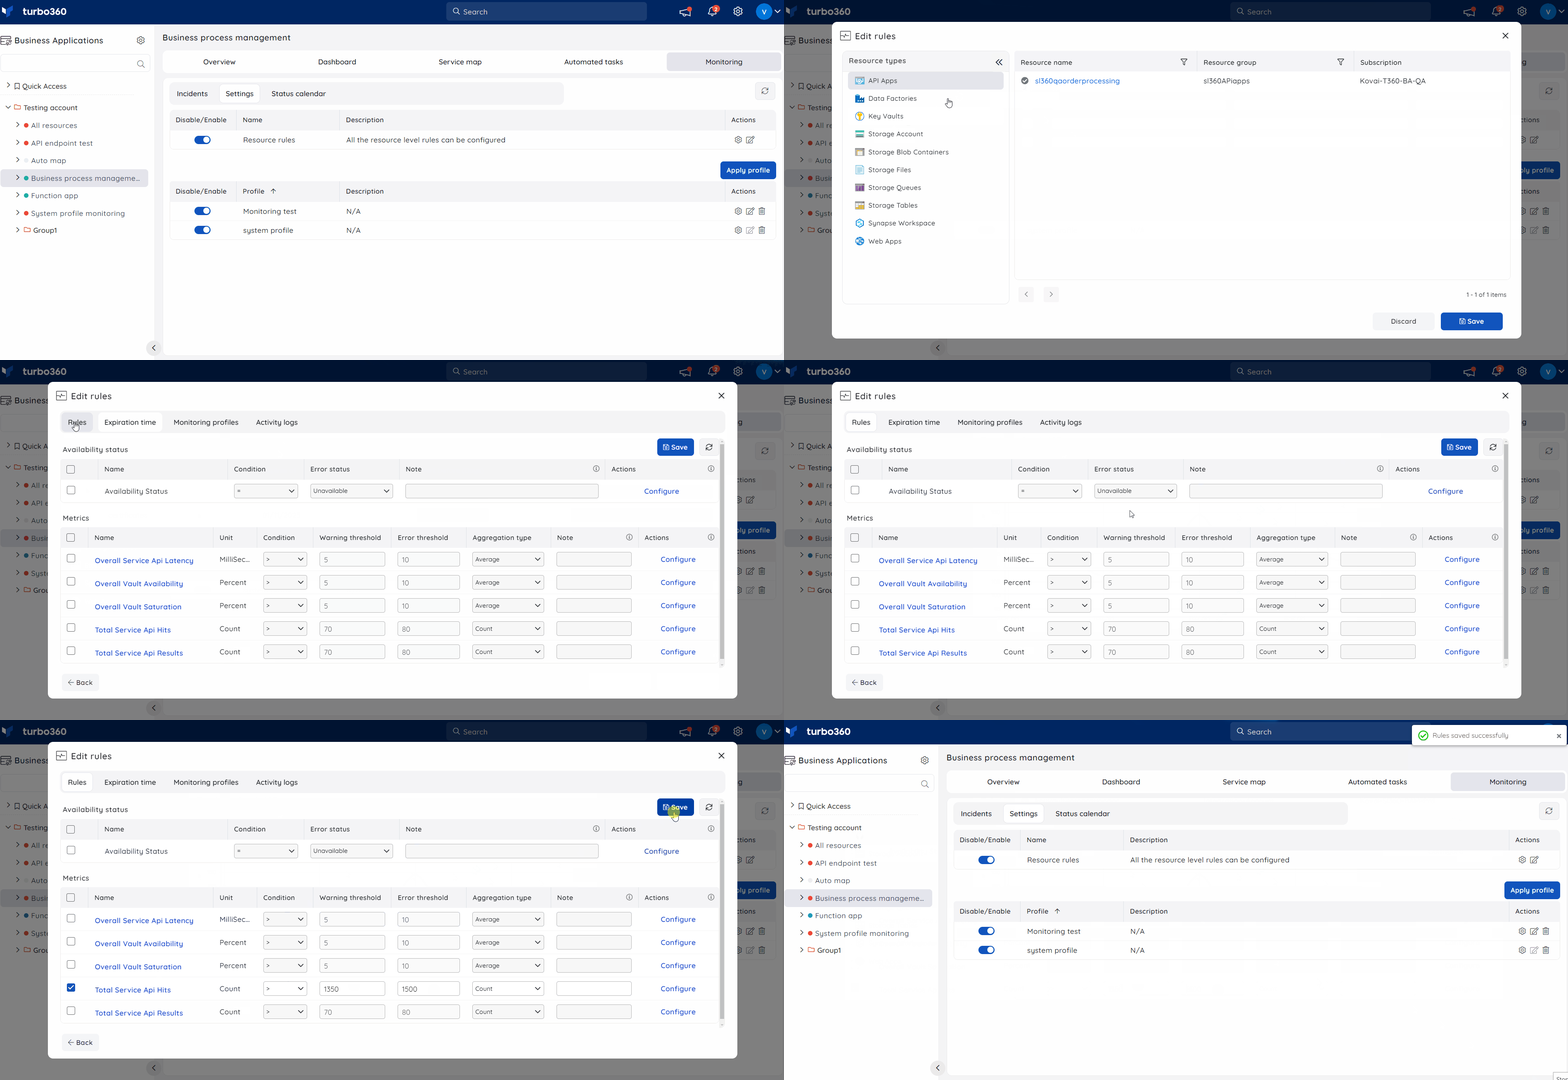
Resources with rules configured are marked in green. Click a resource to view its resource rules and any profiles mapped to it.
The green marking is based only on resource-level rules.
Toggle monitoring for the entire Business Application
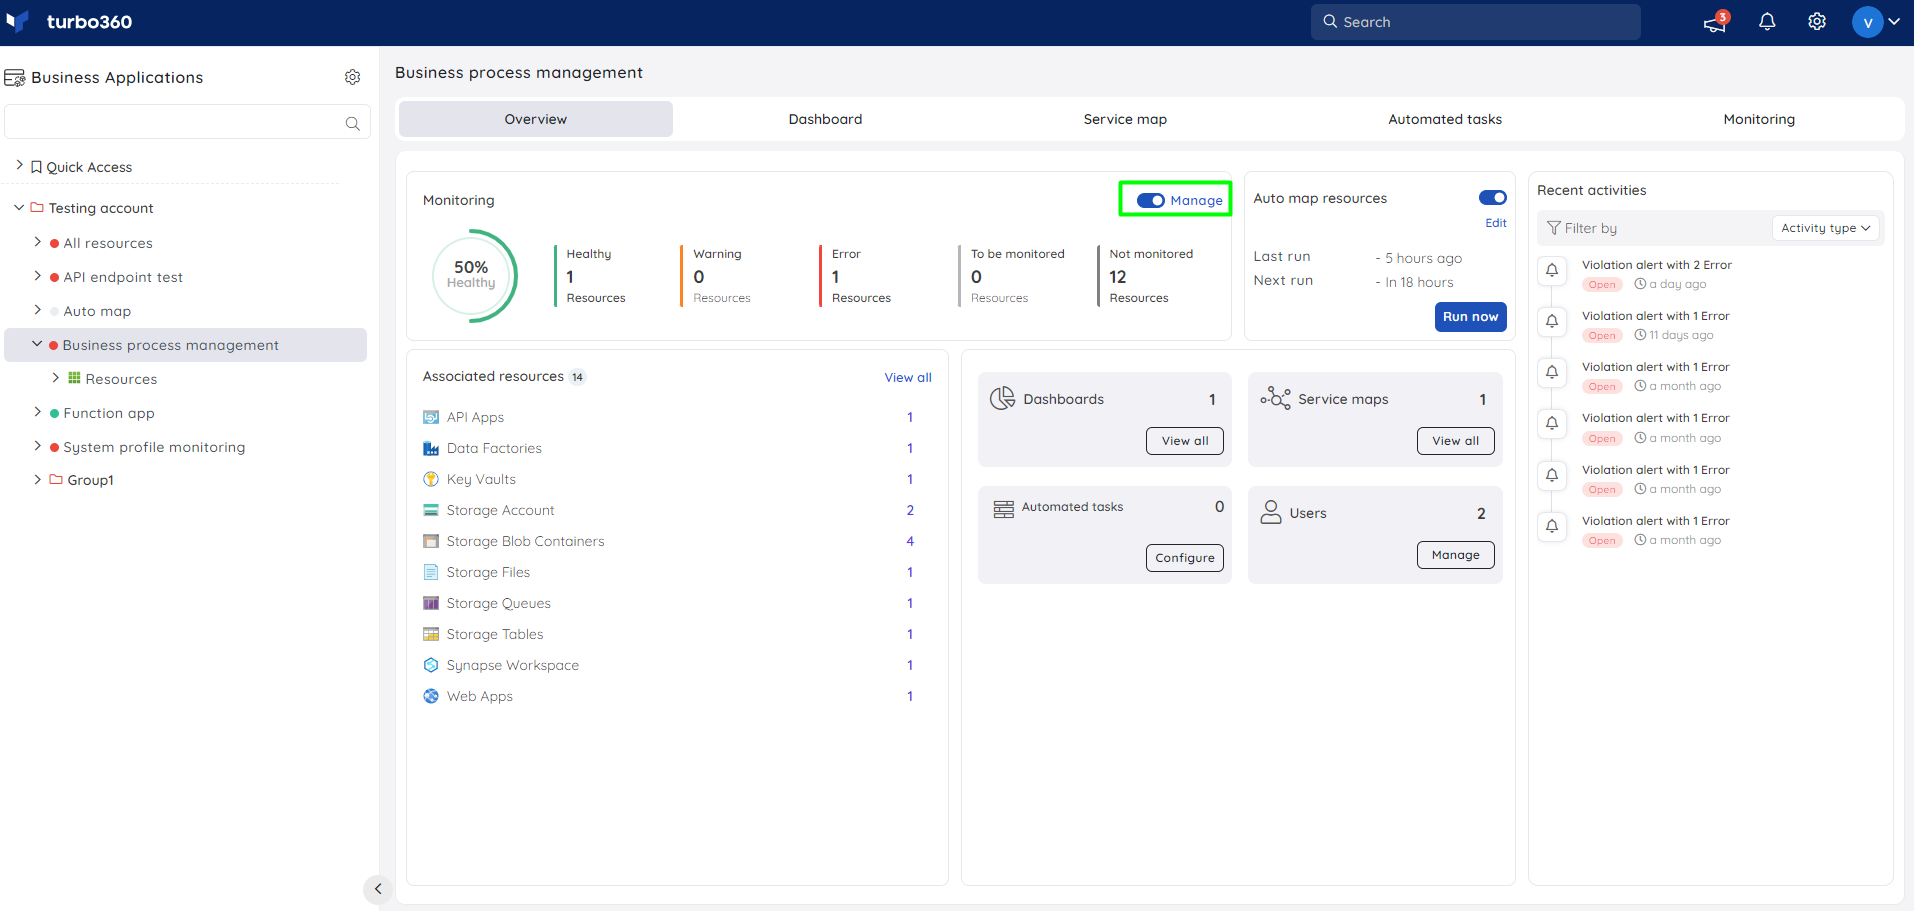
Enabling or disabling monitoring from Business Application > Overview completely enables or disables resource monitoring for that Business Application, regardless of how many monitoring profiles are configured.
View monitoring rule status
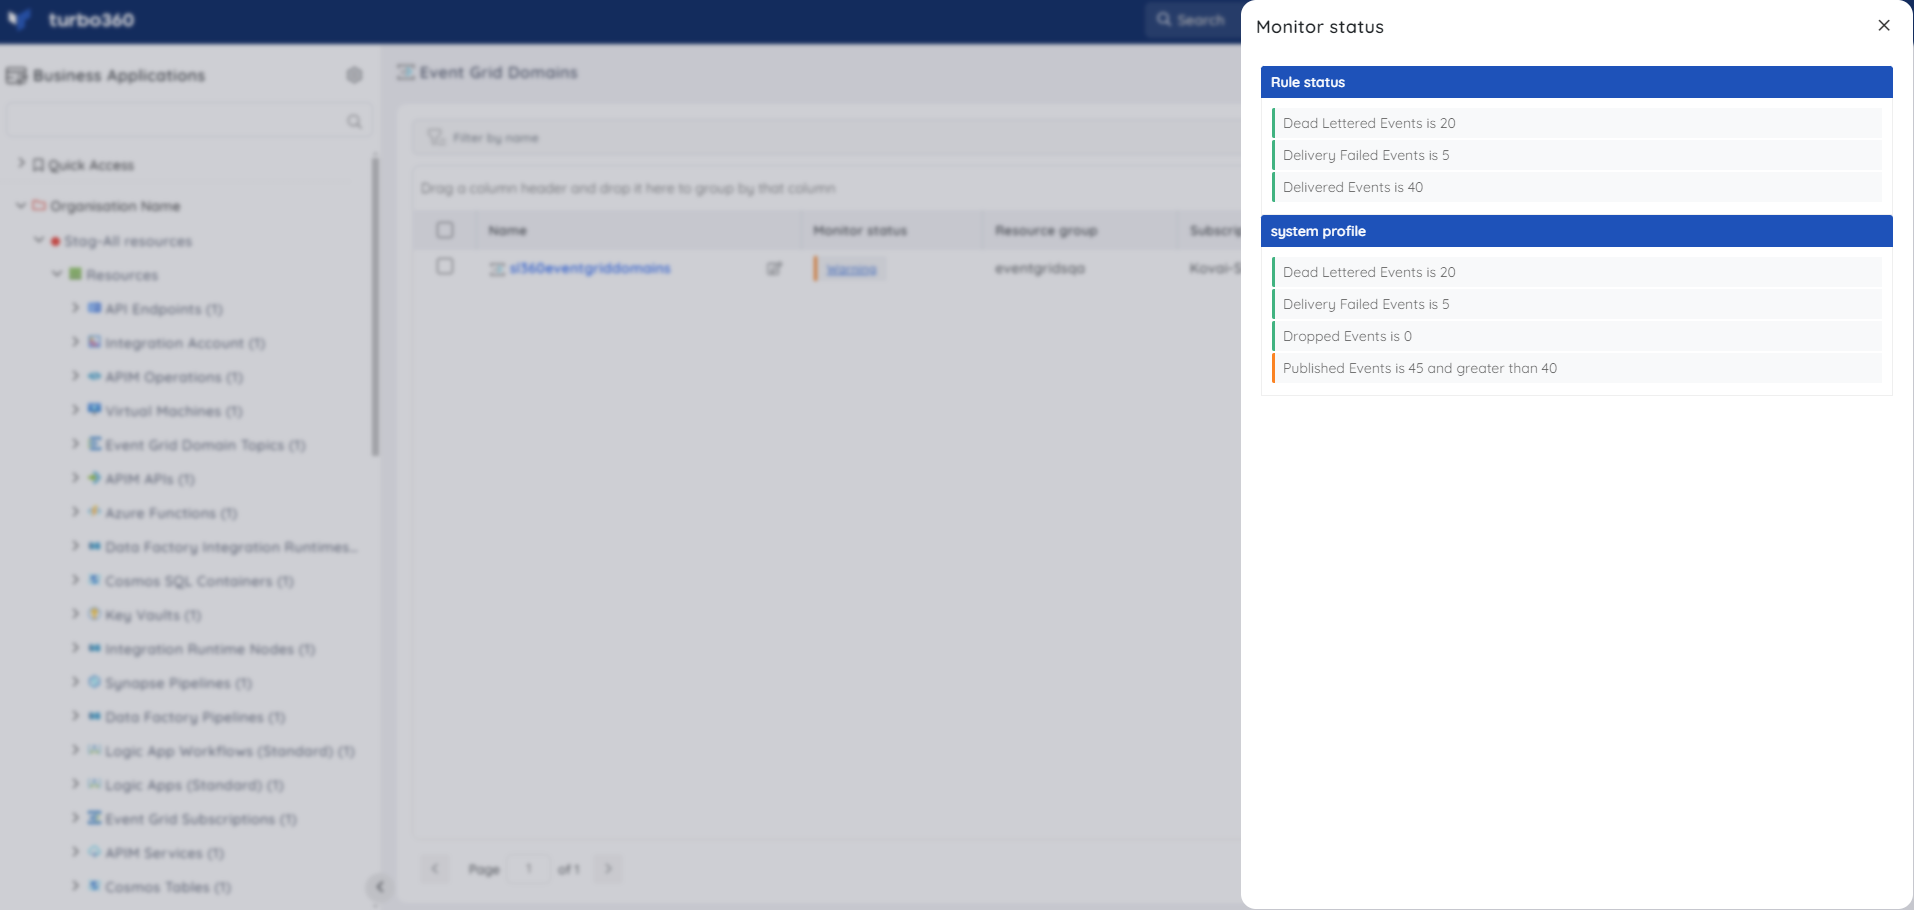
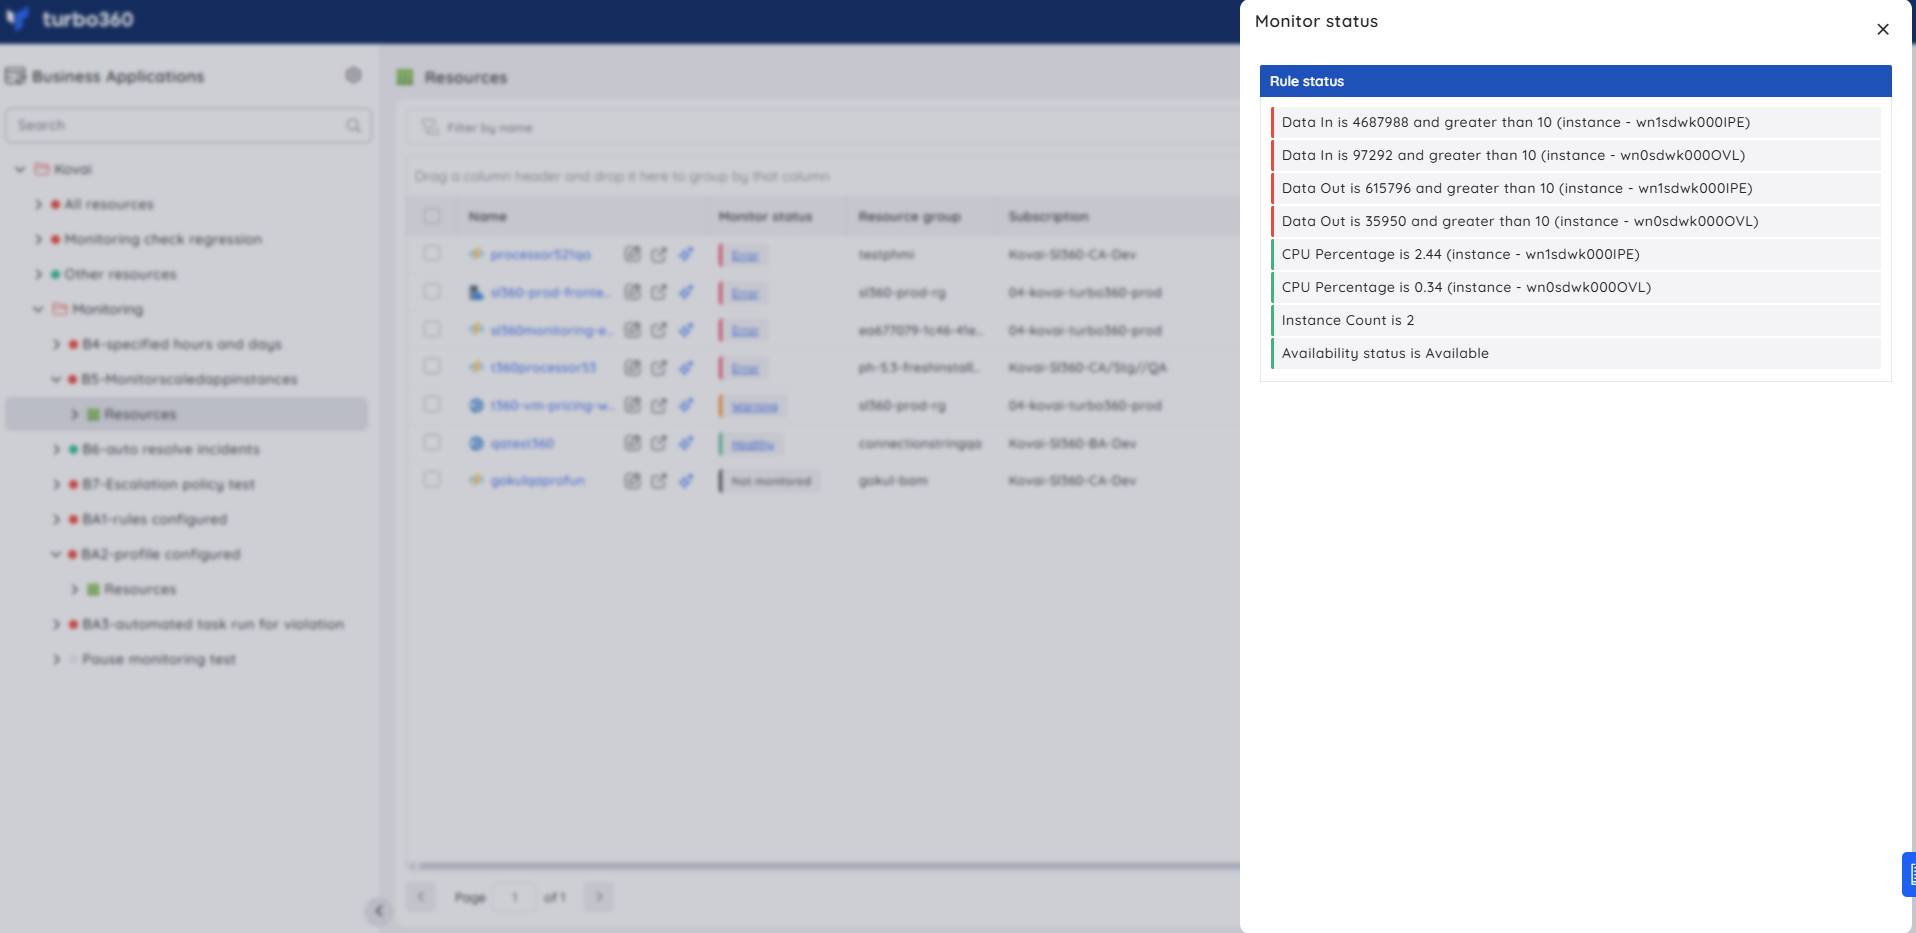
The monitoring status of a resource can be viewed from Business Application > Resources > [Resource] monitoring status, where all associated resources are listed. Clicking a resource's monitoring status displays the status of its configured rules. Status from a profile is headed with the profile's name; status from individual rule configuration is headed Rule status.
The image below shows the monitor status of an Event Grid Domain resource, with rules configured at the resource level and through a system profile:
Update resource monitoring state
The monitoring state of a resource can be updated from Business Application > Resources > [Resource].
- Enable monitoring enables monitoring for the resource using its configured rules or applied Monitoring profiles.
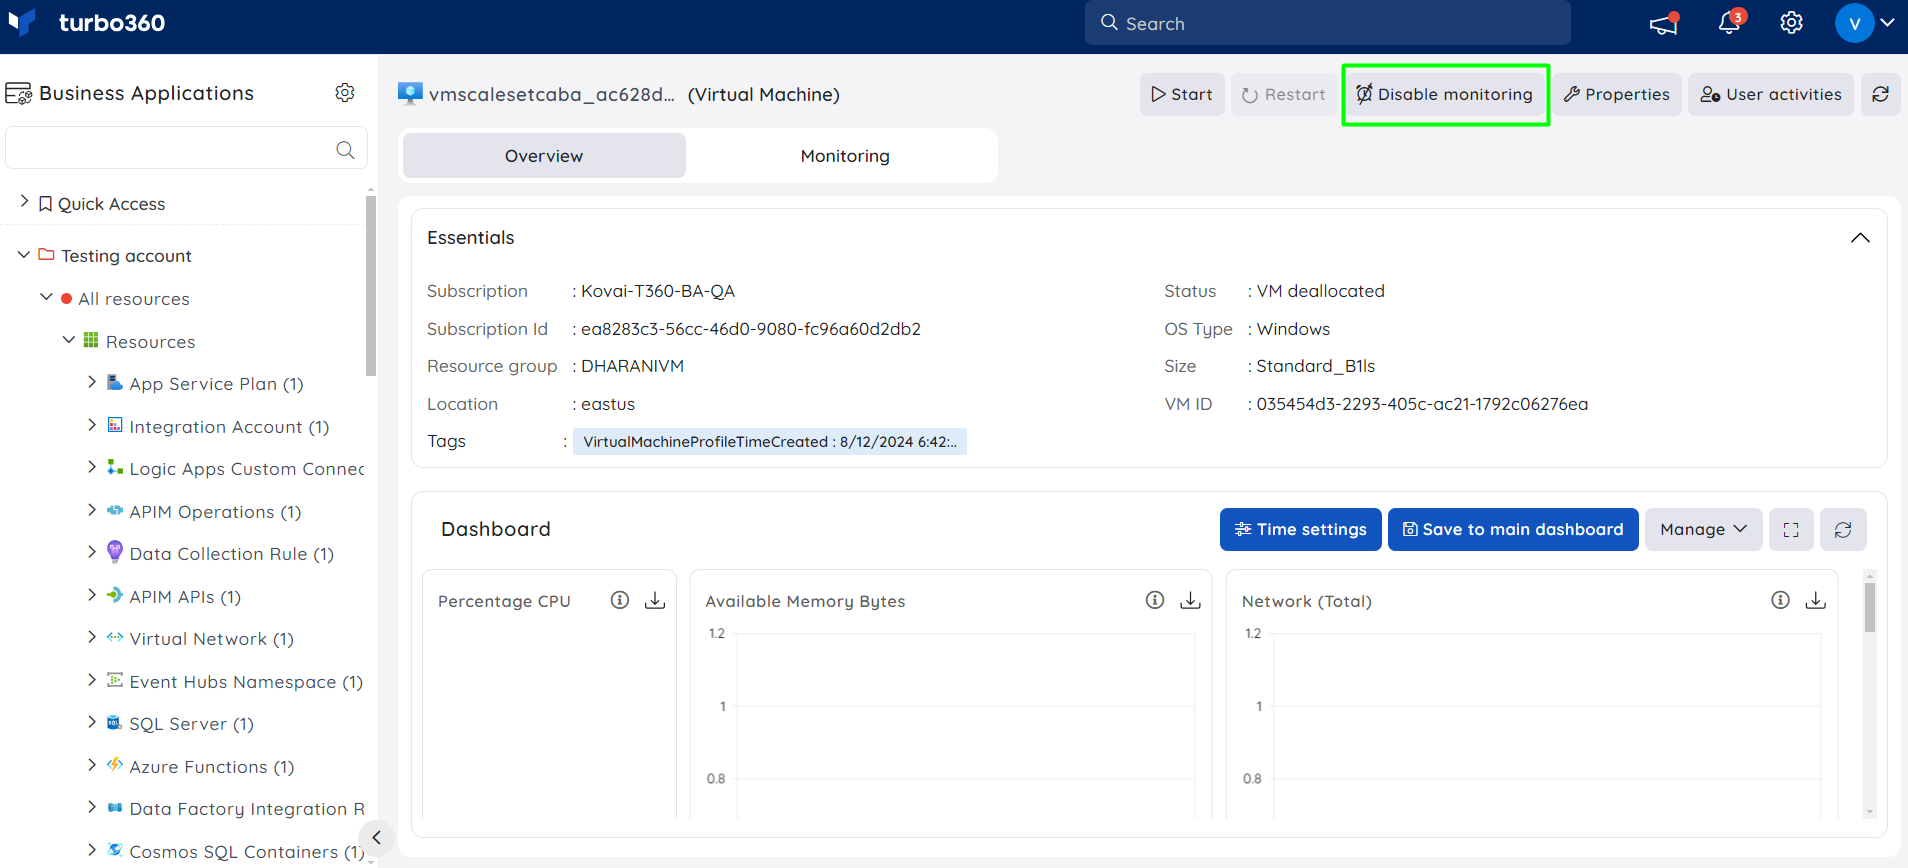
- Disable monitoring completely disables monitoring for the resource, regardless of any rules configured through a Monitoring profile or individual rule configuration.
The image below shows the option to disable monitoring for a Virtual machine resource currently being monitored:
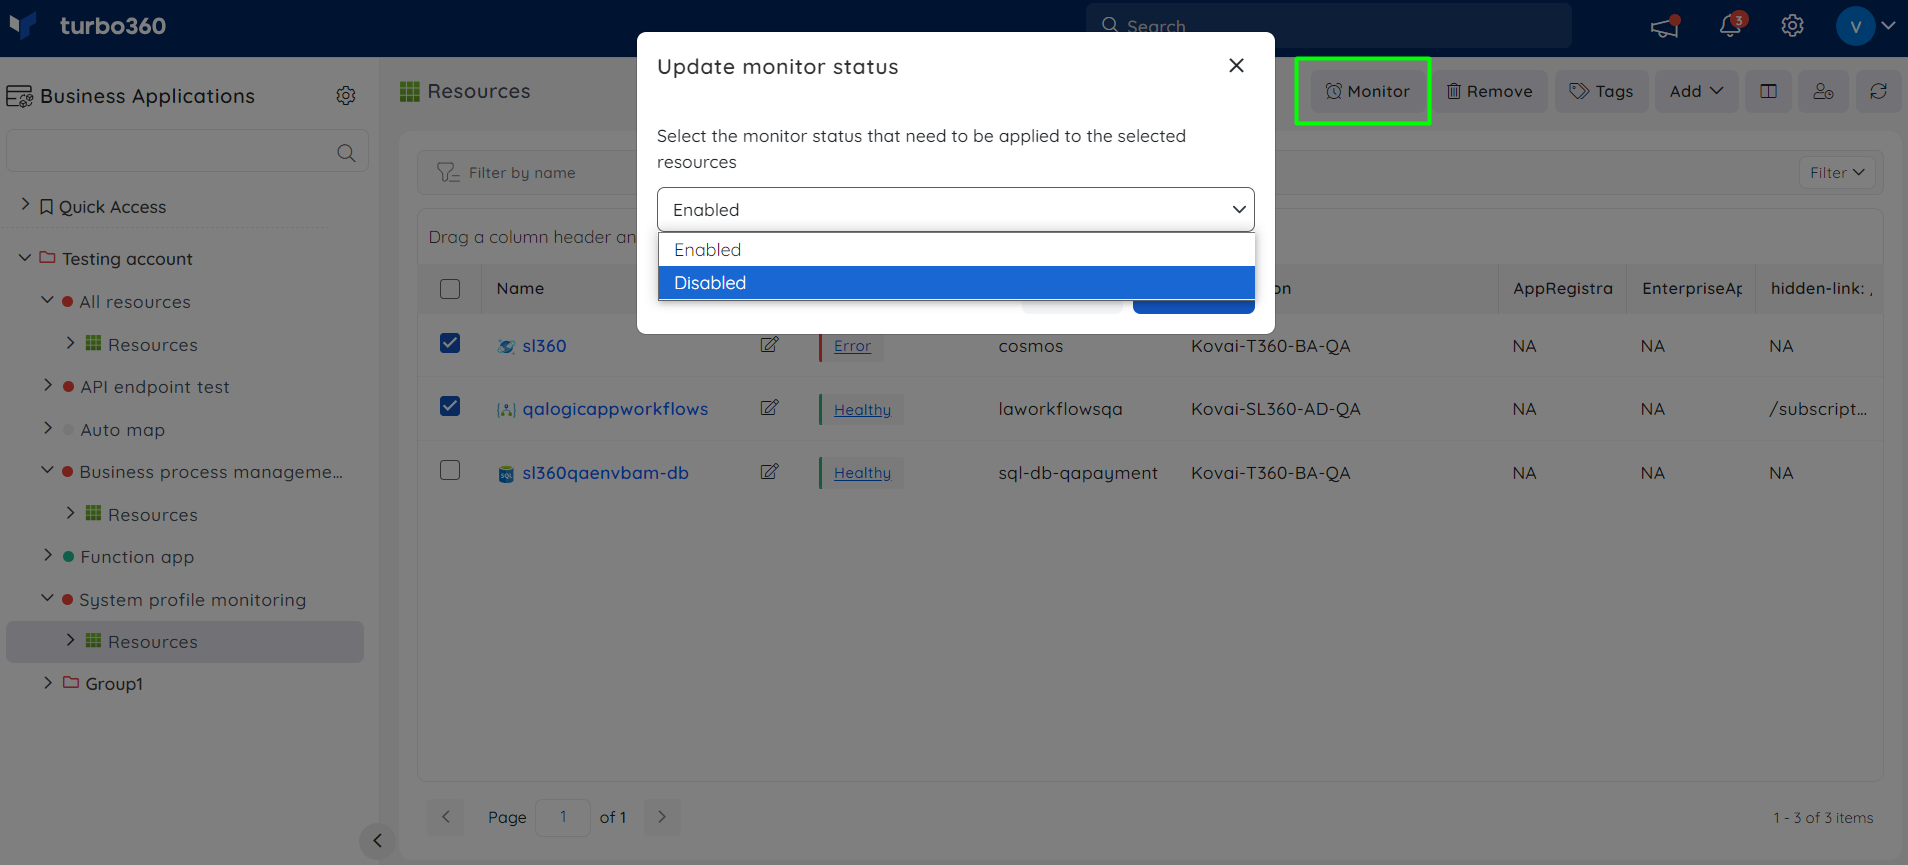
The monitoring state of resources can also be updated for multiple resources at once from Business Application > Resources, regardless of resource type: select multiple resources, click Monitor, choose the required monitoring state, then click Update.
Silent monitoring
You can monitor a Business Application without configuring any notification channels or recipient email addresses. In this mode, Turbo360 evaluates all configured rules at every monitoring cycle and updates the health status of each resource — but no alert notifications or incidents are dispatched to any channel.
The resource monitoring status is still reflected in the Business Application card, Resources section, and Service Map section based on the configured monitoring frequency. This lets teams use Turbo360 as a passive health dashboard without requiring notification infrastructure to be set up first, or in environments where alerting is intentionally suppressed.
Note:
Silent monitoring applies only to outbound notifications. Rule evaluation and resource health status updates continue as normal regardless of whether notification channels are configured.
Status calendar
You can view the historical summary of a Business Application's alert status in a calendar format from Business Application > Monitoring > Status calendar, alongside the Incidents and Settings tabs. Data from the past 30 days is always accessible for reference, and you can use the Week, Month, or Day view options to change the calendar's time range.
.png)
Summary alerts
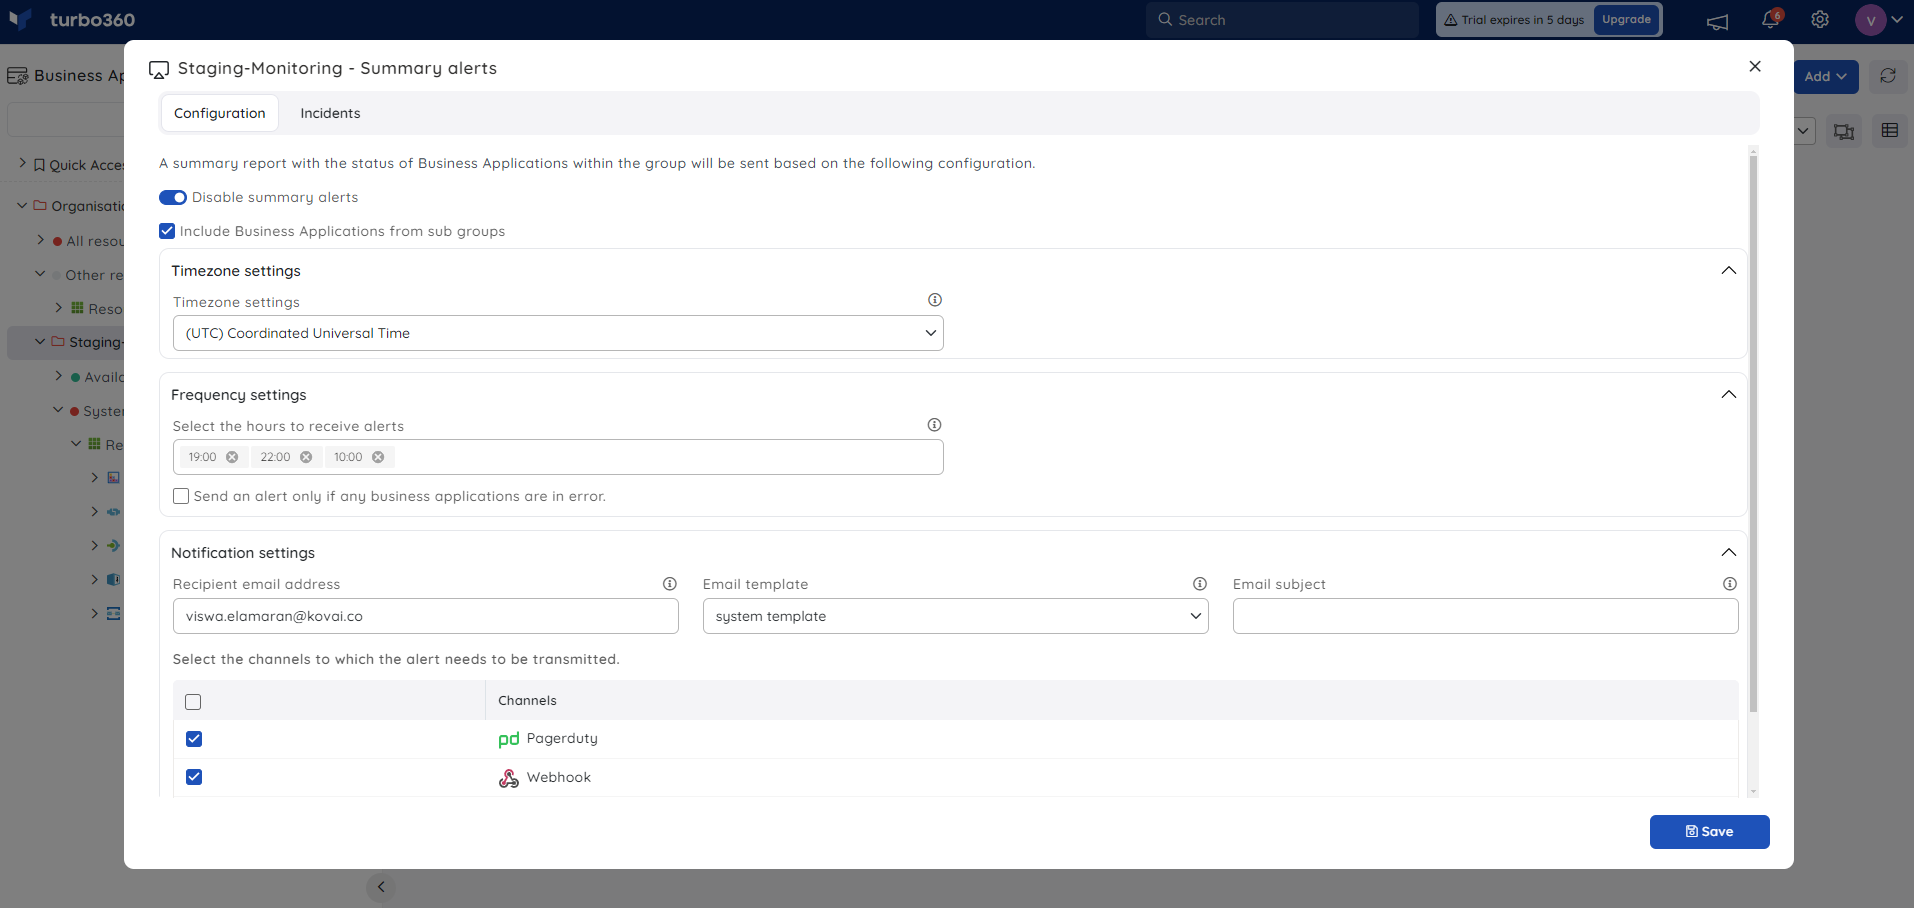
The health report summary for Business Applications within a Business Group can be enabled from Tree view > [Business Group] > Context menu ( ⋮ ) > Summary alerts.
.png)
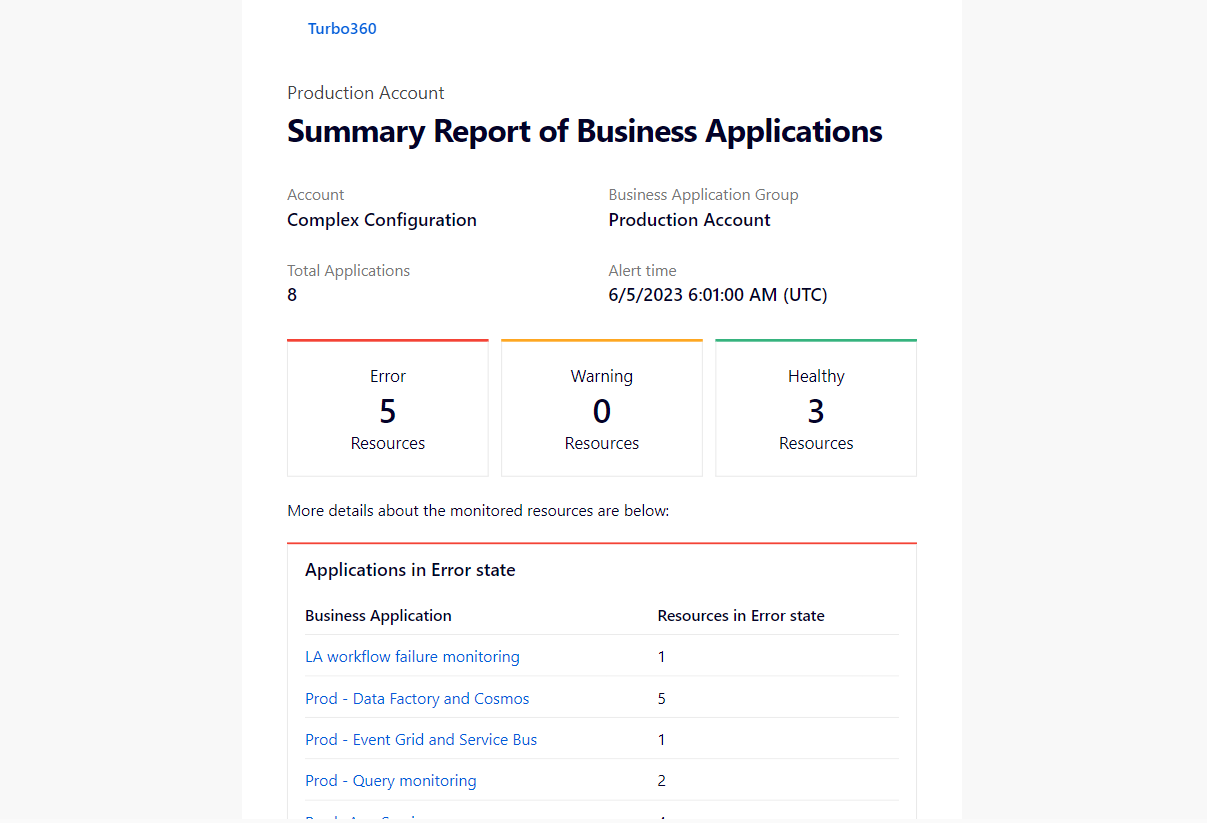
The summary alert provides in-depth information about the health status of all Business Applications in the associated Business Group, with a breakdown of health status counts for the available resources. The monitoring summary of sub-groups within a Business Group can also be included by enabling Include Business Applications from sub groups.
Clicking the Business Application name in the Summary Alert navigates you directly to its Overview section — this navigation is available only in the email notification.
The image below shows the Summary alert for Business Applications, received through Turbo360 mail:
Configuration
Monitoring settings are managed from Business Application > Monitoring > Settings > Settings icon, next to Resource rules or the mapped profile.
.png)
| Setting | Description |
|---|---|
| Timezone | Sets the timezone used for resource monitoring evaluation for the Business Application. |
| Rules evaluation frequency | All associated resources are monitored according to this frequency. |
| Aggregation period | All resource metrics are aggregated using each metric's Primary Aggregation Type, based on this period. |
| Auto resolve incidents | When enabled, alert incidents automatically close once all resources in the Business Application move from error to healthy in the next monitoring cycle, and an up alert is sent to configured channels. |
| Monitor scaled app service instances | When enabled, scaled instances as well as default instances are monitored for Web apps, Function apps, and App service plans. |
| Days | Monitoring alerts for the configured frequency and aggregation period are generated only on the selected days of the week. |
| Hours | Monitoring alerts for the configured frequency and aggregation period are generated only during the selected hours of the day. |
| Include healthy rules in the report | Includes healthy rules alongside violated rules in violation reports. |
| Include all identified issues | Includes all previously identified issues in the alert, instead of ignoring issues already reported. |
| Status report — hours and frequency | Generates a status report covering aggregated resource data over the configured aggregation period, only at the selected hours. |
| Status report — error only | When enabled, sends a status report only when a monitored rule is in error status. |
| Email address | Recipients for alerts. Comma-separated addresses each receive a separate alert and email count; semicolon-separated addresses receive a single combined alert and email count. |
| Notification channels | Third-party channels already configured in Settings can be selected to receive alerts in addition to, or instead of, email. When neither email addresses nor notification channels are configured, monitoring continues silently — rules are evaluated and resource health status is updated per the configured frequency, but no alerts or incidents are dispatched. |
Auto resolve incidents
Auto resolve incidents controls whether an open alert incident closes automatically once the underlying issue has cleared, removing the need to manually verify recovery and close the incident yourself.
When Auto resolve incidents is enabled:
- An open incident automatically closes once every resource within the Business Application moves from an error state to a healthy state during the same monitoring cycle. Evaluation is scoped to the entire Business Application, not just the resource that originally triggered the incident — if even one other resource in the Business Application is still in an error state, the incident remains open.
- An up alert is sent to all configured notification channels, confirming that the Business Application has returned to a healthy state. This gives your team a clear, timestamped signal that the issue is resolved, without anyone needing to check the dashboard manually.
When Auto resolve incidents is disabled:
- Incidents remain open indefinitely once triggered, even after the underlying resources recover. They stay open until a user manually closes them from the incident view.
This setting determines whether incident closure is a manual task or a self-managing one. For teams running many Business Applications, enabling Auto resolve incidents prevents a backlog of stale, already-resolved incidents from accumulating and keeps the incident list focused on issues that genuinely still need attention. Teams that require a human review step before any incident is marked resolved — for example, to confirm root cause or document remediation — may prefer to leave it disabled and close incidents manually instead.
Because resolution is evaluated at the Business Application level, a Business Application with many monitored resources only auto-resolves once all of them are healthy simultaneously in the same monitoring cycle — not as each individual resource recovers.
Monitor scaled app service instances
Azure App Service Plans, Web apps, and Function apps can scale out to run multiple instances behind the scenes to handle load. By default, Turbo360 monitors only the default instance of these resources. Monitor scaled app service instances extends monitoring coverage to every instance currently running, not just the default one.
When Monitor scaled app service instances is enabled:
- Both the default instance and any scaled-out instances of Web apps, Function apps, and App service plans are monitored. Metrics and rule evaluation cover the full set of running instances, so an issue occurring only on a scaled instance — rather than the default one — is still detected.
When Monitor scaled app service instances is disabled:
- Only the default instance is monitored. Scaled instances are excluded from monitoring entirely; metrics and rule evaluation do not account for them, even while they are actively running and serving traffic.
This setting matters because scaling behavior changes which instance is actually handling a given request at any moment. Without it enabled, a resource could be reporting healthy at the default instance while one or more scaled instances are degraded or failing — a gap that's easy to miss in a high-traffic Business Application that scales out frequently. Enabling it gives you complete visibility regardless of how many instances are currently running, at the cost of monitoring more instances overall.
The screenshot below shows how Turbo360 breaks down monitor rule violations for an App Service Plan resource, with each rule result mapped to its corresponding instance:
The status report time period is completely independent of the rules evaluation frequency.
Permission behavior
A user with Manage access to the Monitoring feature permission can toggle monitoring, edit monitor settings, and configure rules for a resource — but only if that user also holds at least Read access to that resource. A user with only Read access can view monitor settings but cannot make any changes.
Monitoring profile actions are controlled separately through the Monitoring profile permission (Read/Manage); a user can have different access levels for resource-level monitoring versus profile-based monitoring — for example, Manage on resource monitoring but only Read on profiles, or vice versa.
Configuring notification channels requires Manage notification channels, and configuring escalation policies requires Manage escalation policy — both account-level permissions independent of the Monitoring feature permission. A user must additionally hold the Contributor or Owner role to update the Summary monitoring configuration for Business Applications.
Example scenario
An operations team groups the Azure resources behind an order-processing solution — including a Logic App and a Service Bus Queue — into a single Business Application. They configure an Availability Status rule on the Logic App with an Error threshold, map a shared Monitoring profile across both resources for Metric-based checks, and configure an Automated task to restart the Logic App when the Availability Status rule is violated. When the rule breaches its threshold, the team receives an email alert with a resolution note, and the Logic App's status is auto-corrected without anyone needing to open the Azure portal.
Troubleshooting
Alerts are not being received for a violated rule
Cause: No email recipients or notification channels are configured in the Monitoring alert settings.
Fix: Add at least one recipient email or notification channel under Monitoring > Settings.A resource shows as monitored but no alerts are generated
Cause: Monitoring is disabled at the Business Application level from the Overview toggle, overriding all resource and profile rules.
Fix: Enable monitoring from the Business Application Overview.Alert incidents are not closing automatically after resources recover
Cause: Auto resolve incidents is disabled in the Rule settings.
Fix: Enable Auto resolve incidents under Monitoring > Settings.Resource health status is not updating even though monitoring is enabled
Cause: The monitoring frequency has not elapsed since monitoring was enabled, or the Business Application is running in silent monitoring mode with no notification channels configured and the status has not yet refreshed in the UI.
Fix: Wait for at least one monitoring cycle to complete. Resource health status in the Business Application card, Resources section, and Service Map section updates after each cycle regardless of whether notification channels are configured.
FAQs
What's the difference between resource-level rules and monitoring profiles?
Resource-level rules are configured individually per resource. Monitoring profiles let you apply the same rule set across multiple resources or Business Applications, and updates to the profile apply everywhere it's mapped.Does disabling monitoring at the Business Application level stop automated tasks tied to rule violations?
Disabling monitoring at the Business Application level stops all rule evaluation for that Business Application, so rule violations are no longer detected and automated tasks tied to those violations will not be triggered. Existing scheduled automated tasks are not affected by this toggle and continue to run as scheduled, since they are not tied to monitoring rule evaluation.Can I monitor a Business Application without setting up notification channels?
Yes. Notification channels and recipient email addresses are optional. When neither is configured, Turbo360 evaluates all configured rules at every monitoring cycle and updates resource health status as normal — no alerts or incidents are dispatched. This is referred to as silent monitoring and is useful for observing resource health before committing to a notification strategy.
Related articles
Was this article helpful?