

Architecture
- 05 Aug 2026
- 6 Minutes to read
- Print
- DarkLight
- Download PDF
Architecture
- Updated on 05 Aug 2026
- 6 Minutes to read
- Print
- DarkLight
- Download PDF
Article summary
Did you find this summary helpful?
Thank you for your feedback!
Overview
Business Applications is a Turbo360 module built on a cross-subscription, application-centric architecture. It abstracts the resource boundaries enforced by Azure — subscriptions, regions, resource groups — and presents a named, logical container that maps directly to a line-of-business solution. This article describes how that architecture is structured, what each layer does, and how the components interact at runtime.
Business value
Enterprises running Azure integration solutions typically scatter resources across multiple subscriptions and resource groups for governance or billing reasons. This structure makes sense at the infrastructure level but creates a blind spot at the operations level: no single view, no unified health signal, and no way to act on a solution as a whole.
Business Applications addresses this by introducing an application layer above the Azure resource hierarchy — so operations teams can monitor, manage, and respond at the solution level, not the resource level. The result is faster incident detection, fewer manual context switches, and consistent governance across solutions.
How it works
Architectural layers
Business Applications is organized into three conceptual layers that work together from connection through to alerting.
.png)
Layer 1 — Azure connectivity (service principal)
Everything starts with a service principal. When you create a Business Application, you authenticate against one or more Azure subscriptions using a service principal with the appropriate access scope. You can grant access at the full-subscription level or restrict it to specific resource groups. This scope determines which Azure resources are visible and manageable within the Business Application.
A single Turbo360 organization can hold multiple Business Applications, each authenticated via its own service principal or sharing a previously registered one from another module. Service principals are validated at creation time and reused for all subsequent resource queries and management operations.
Layer 2 — Resource grouping and association
Once a subscription is connected, you select the Azure resources that constitute the solution. Business Applications supports over 40 Azure resource types — Logic Apps, Service Bus queues and topics, Azure Function Apps, Event Hubs, Event Grid, Data Factory pipelines, Key Vault, Virtual Machines, API Management, and more.
Resources are organized in a parent/child relationship within the resource picker. Selecting a parent resource type automatically pre-loads its child resource types. The Associate all child resources option lets you include all child resources of a selected parent in a single operation. Selected resources are stored as the membership of the Business Application and polled or queried according to the monitoring configuration.
Resources can come from different Azure subscriptions, regions, and resource groups. The Business Application holds them in a single flat membership list, decoupled from their underlying Azure organizational boundaries.
Layer 3 — Monitoring engine
The monitoring engine runs on a scheduled evaluation cycle configured per Business Application. It queries each associated resource's properties, metrics, status, and availability, then evaluates the results against configured threshold rules.
Rules follow one of four types:
| Rule type | What it evaluates |
|---|---|
| Property | The current value of a static resource property |
| Metric | An aggregated time-series value over a configurable aggregation period |
| Status | One of the available state values specific to that resource type |
| Availability Status | Whether the resource is currently available |
| Quota | Usage of App Service plan quotas (CPU time, memory, bandwidth) for Web Apps and Function Apps |
For metric rules, two threshold levels are supported — warning and error. When both are breached in the same evaluation cycle, the error threshold takes precedence for alert generation.
Monitoring settings are defined per Business Application and include evaluation frequency, aggregation period, timezone, violation report schedule (days and hours), and whether to auto-resolve incidents when the Business Application returns to healthy. These settings apply uniformly to all resource rules within the Business Application, or independently to rules defined within a monitoring profile.
Monitoring profiles
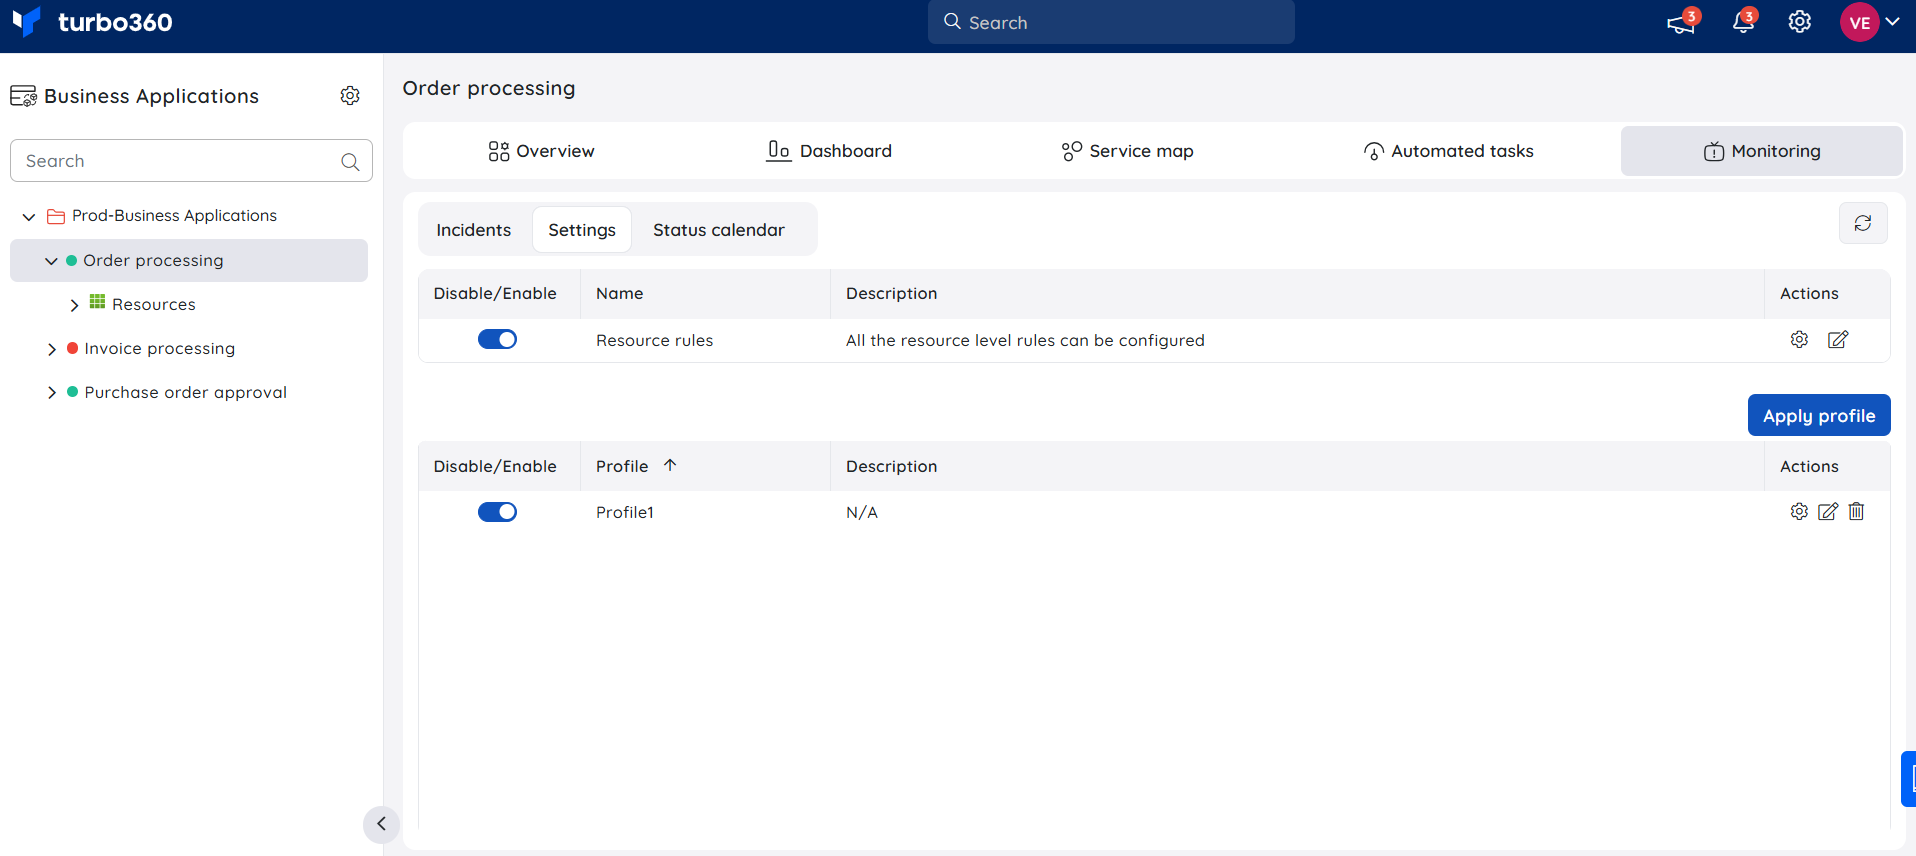
Monitoring profiles are reusable rule sets that can be applied to multiple Business Applications simultaneously. A profile defines rules centrally; editing the profile propagates changes to every Business Application using it. Per-resource customizations (such as resolution notes) are scoped to the individual resource without affecting the shared profile.
Each Business Application can use a combination of resource-level rules and one or more monitoring profiles. Both appear in the Monitoring → Settings view and each has its own enable/disable toggle.
Service map
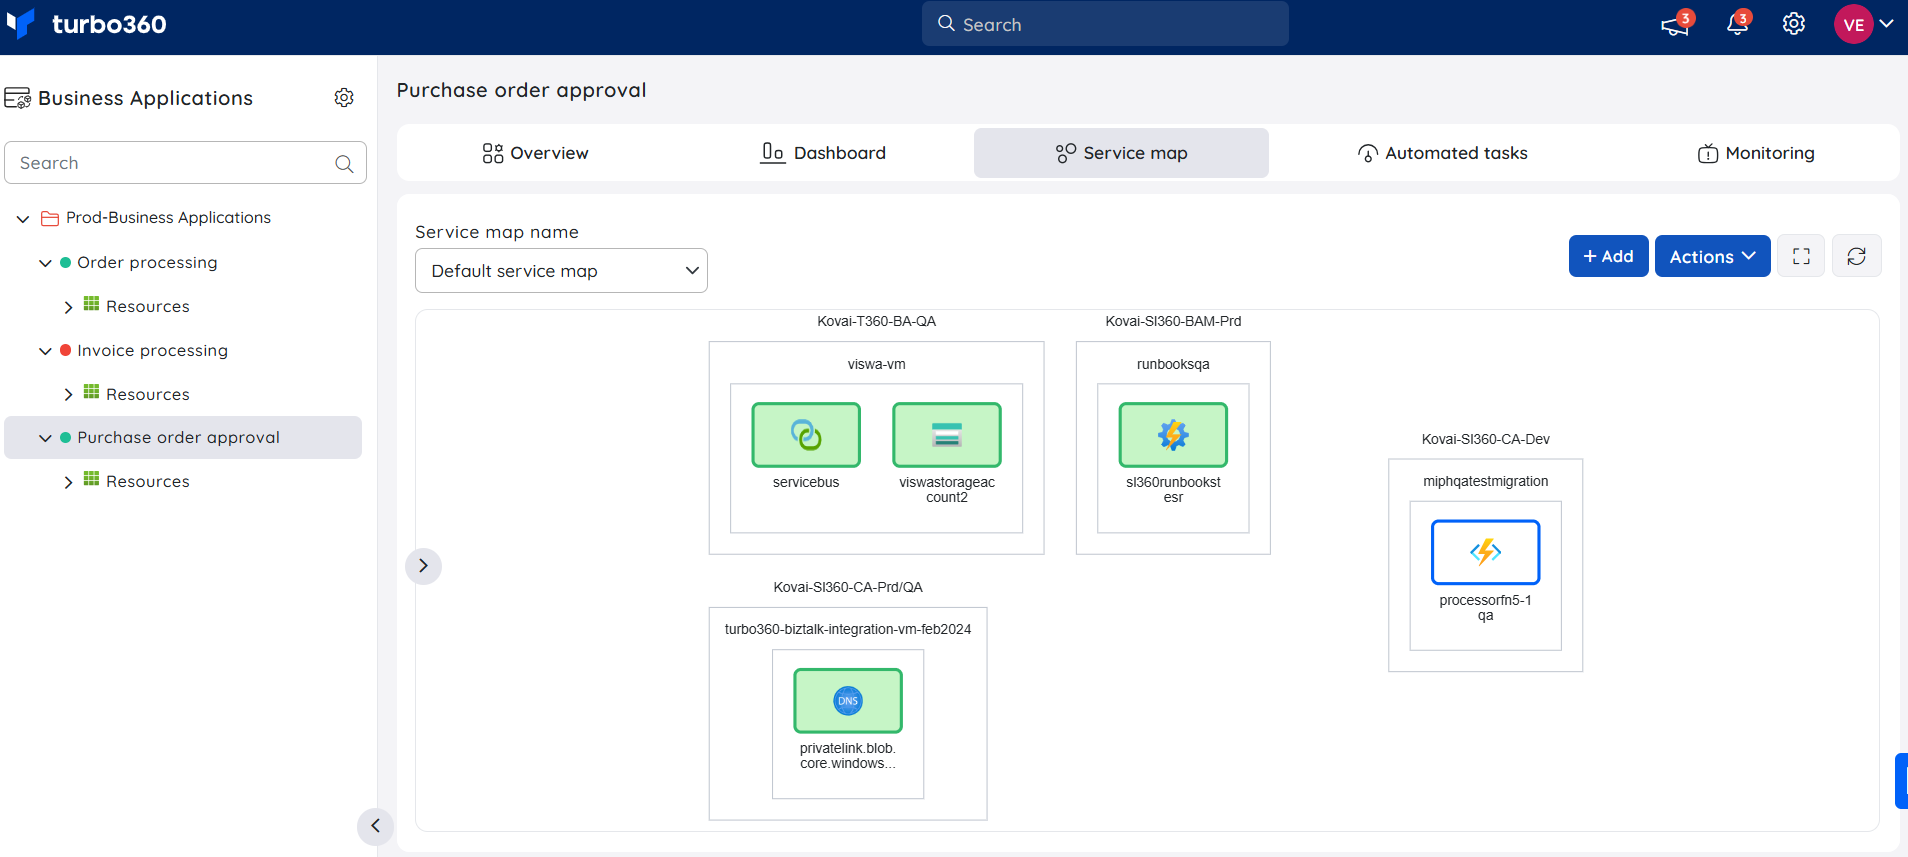
Each Business Application includes a service map — a visual dependency diagram of the associated Azure resources. The service map reflects real-time monitoring status, propagating health signals from individual resources into the diagram. This gives operations teams an immediate topology view of the solution alongside its current health state.
Alert delivery
When a monitoring rule is violated, alerts are dispatched to configured recipients. Delivery options include direct email addresses (comma-separated for individual emails, semicolon-separated for a single grouped email) and notification channels (Teams, PagerDuty, Slack, and others configured in Turbo360 settings).
If neither recipients nor notification channels are configured, monitoring continues silently — health state is still tracked and visible in the Business Application card, the Resources section, and the service map, but no external notification is sent.
Incidents are tracked separately and can be configured to auto-resolve when all resources in the Business Application return to a healthy state in the next evaluation cycle.
Automated tasks
Business Applications supports automated response actions linked to monitoring rule violations. An automated task — such as restarting a Logic App or purging a Service Bus queue — can be associated with any metric rule and will execute automatically when a violation is detected. Tasks are defined at either resource level or monitoring profile level and fire only on new violations; they do not re-trigger on sustained violations from prior cycles.
Automated tasks also support scheduled execution independent of monitoring. Both modes coexist within the same Business Application without interference.
.png)
Grouping and hierarchy
Business Applications can be organized into Business Application groups for portfolio-level visibility. A group can contain multiple Business Applications and can be nested.
Group-level summary alerts aggregate the health status of all Business Applications within the group — and optionally include sub-groups — and deliver a single consolidated health report on a configured schedule.
Real-world example: order processing solution
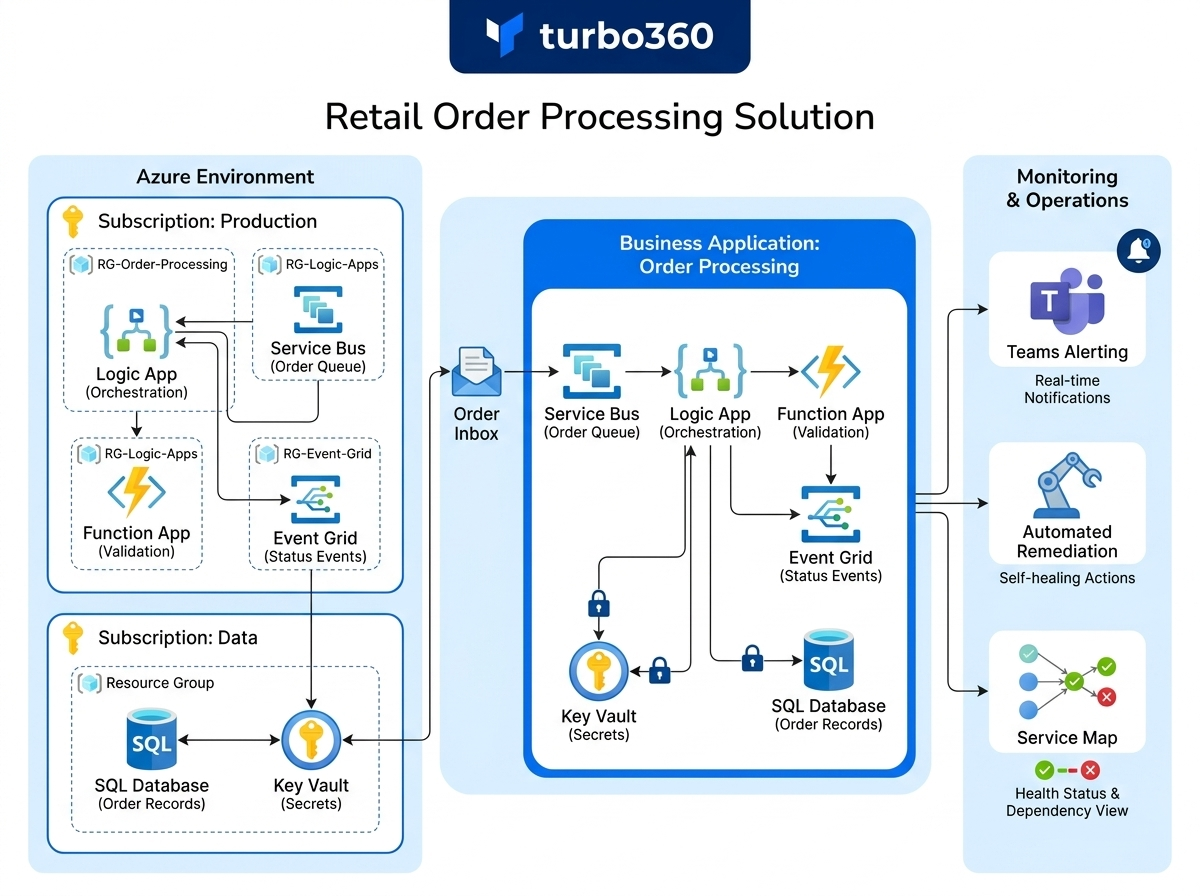
Consider a retail enterprise running an order processing solution on Azure. The solution spans two Azure subscriptions — one for production workloads and one for data — and uses the following resources:
- A Logic App to orchestrate the order workflow
- A Service Bus queue for incoming orders
- An Azure Function App to validate and enrich order data
- An Event Grid topic to publish order status events
- A SQL Database for order records
- A Key Vault for secrets used by the Function App
In the Azure portal, these six resources appear in separate resource groups across two subscriptions. There is no native way to view their combined health or act on them as a unit.
In Turbo360, an operations engineer creates a Business Application named "Order Processing" and associates all six resources. They configure monitoring rules — for example, a metric rule on the Service Bus queue to alert when the message count exceeds 500, and a status rule on the Logic App to alert when it enters a failed state. They map a monitoring profile that checks Function App error rates. The service map shows the solution topology, and monitoring status propagates in real time.
When the Logic App fails on a Thursday at 3:00 AM, the monitoring engine detects the status violation at the next evaluation cycle, sends an alert to the on-call Teams channel, and triggers an automated task that attempts to re-enable the Logic App. The engineer sees the incident in Turbo360, reviews the service map, and resolves it — all without touching the Azure portal.
Related articles
Was this article helpful?