

Chart library
- 05 Aug 2026
- 7 Minutes to read
- Print
- DarkLight
- Download PDF
Chart library
- Updated on 05 Aug 2026
- 7 Minutes to read
- Print
- DarkLight
- Download PDF
Article summary
Did you find this summary helpful?
Thank you for your feedback!
Overview
The Chart library is the central place in Cost Analyzer for creating and managing chart schemas. A chart schema is a saved set of filters, groupings, and configurations that defines how cloud spending data is visualized.
Saving a schema once and applying it across multiple cost management groups keeps cost analysis consistent and standardized, instead of rebuilding the same filters and chart settings every time.
Business value
A shared chart library removes repetitive setup work and keeps cost analysis consistent across teams and cost groups. Standardized schemas reduce the chance of misconfigured views and make it faster to onboard new cost groups to the same reporting standard.
Prerequisites
You need access to Cost Analyzer and an existing cost group to apply a chart schema to.
Required permissions
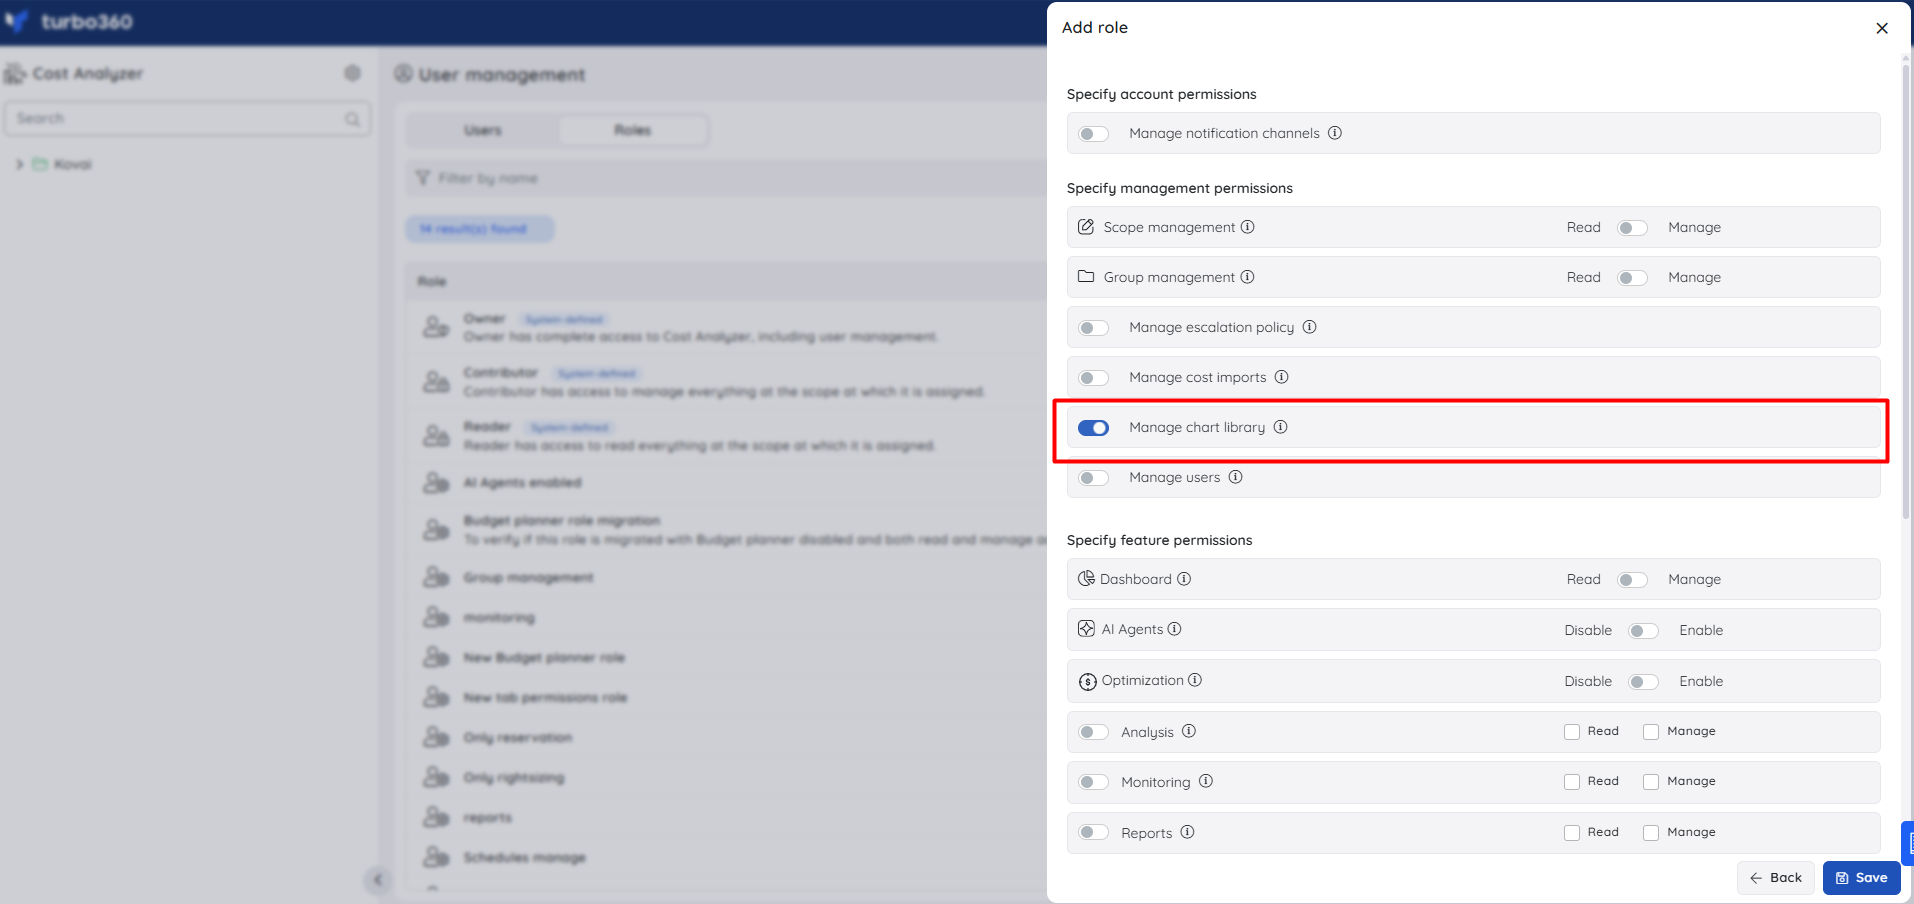
To manage chart schemas, a role must have the Manage chart library permission enabled. An administrator can grant this permission during role creation without assigning broader access.
| Role | Access |
|---|---|
| Account owner, Owner, Contributor | Full access — can create, edit, clone, export, import, and delete chart schemas |
| Custom role with Manage chart library | Can create, modify, delete, import, and export chart schemas; can be scoped to a specific group or subgroup |
How it works
- A chart schema stores filters, groupings, and chart configuration as a single reusable object.
- The Subscription filter is always excluded from a schema. When a schema is applied to a cost management group, it applies to all subscriptions within that cost management group.
- Applying a schema to a cost management group saves it as an Analysis view under Saved views.
- Checking Pin to tabs while creating a schema pins the resulting Analysis view directly in Cost Analysis, in addition to saving it to Saved Views.
- Editing a saved schema only changes the schema itself — it does not retroactively update charts already applied to a cost management group or pinned in an Analysis view.
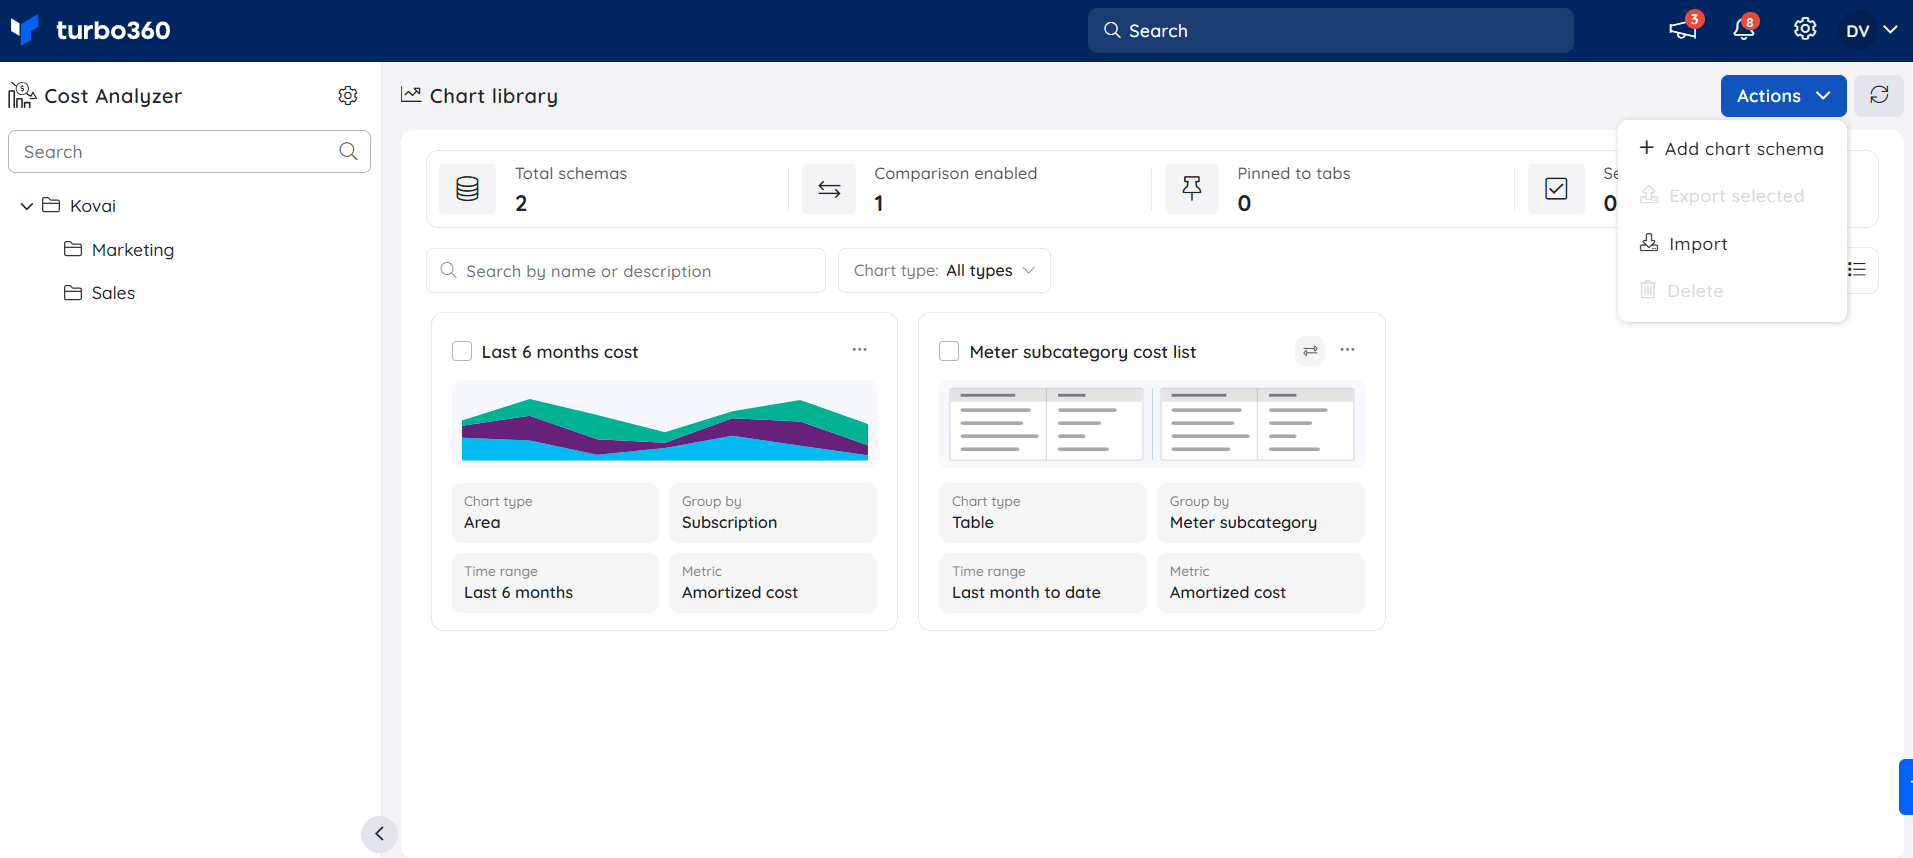
- Schemas can be filtered by chart type (Area, Column (stacked), Column (grouped), Bar (stacked), Bar (grouped), Line, Table) or searched by name or description.
- The Total schemas, Comparison enabled, Pinned to tabs, and Selected counters above the schema list summarize the state of the Chart library at a glance.
- Schemas can be viewed as cards or as a table using the grid view and list view toggle in the top-right of the Chart library.
- Selecting the Comparison chart icon on a schema overlays it with other selected schemas for side-by-side review, and updates the Comparison enabled counter.
Steps
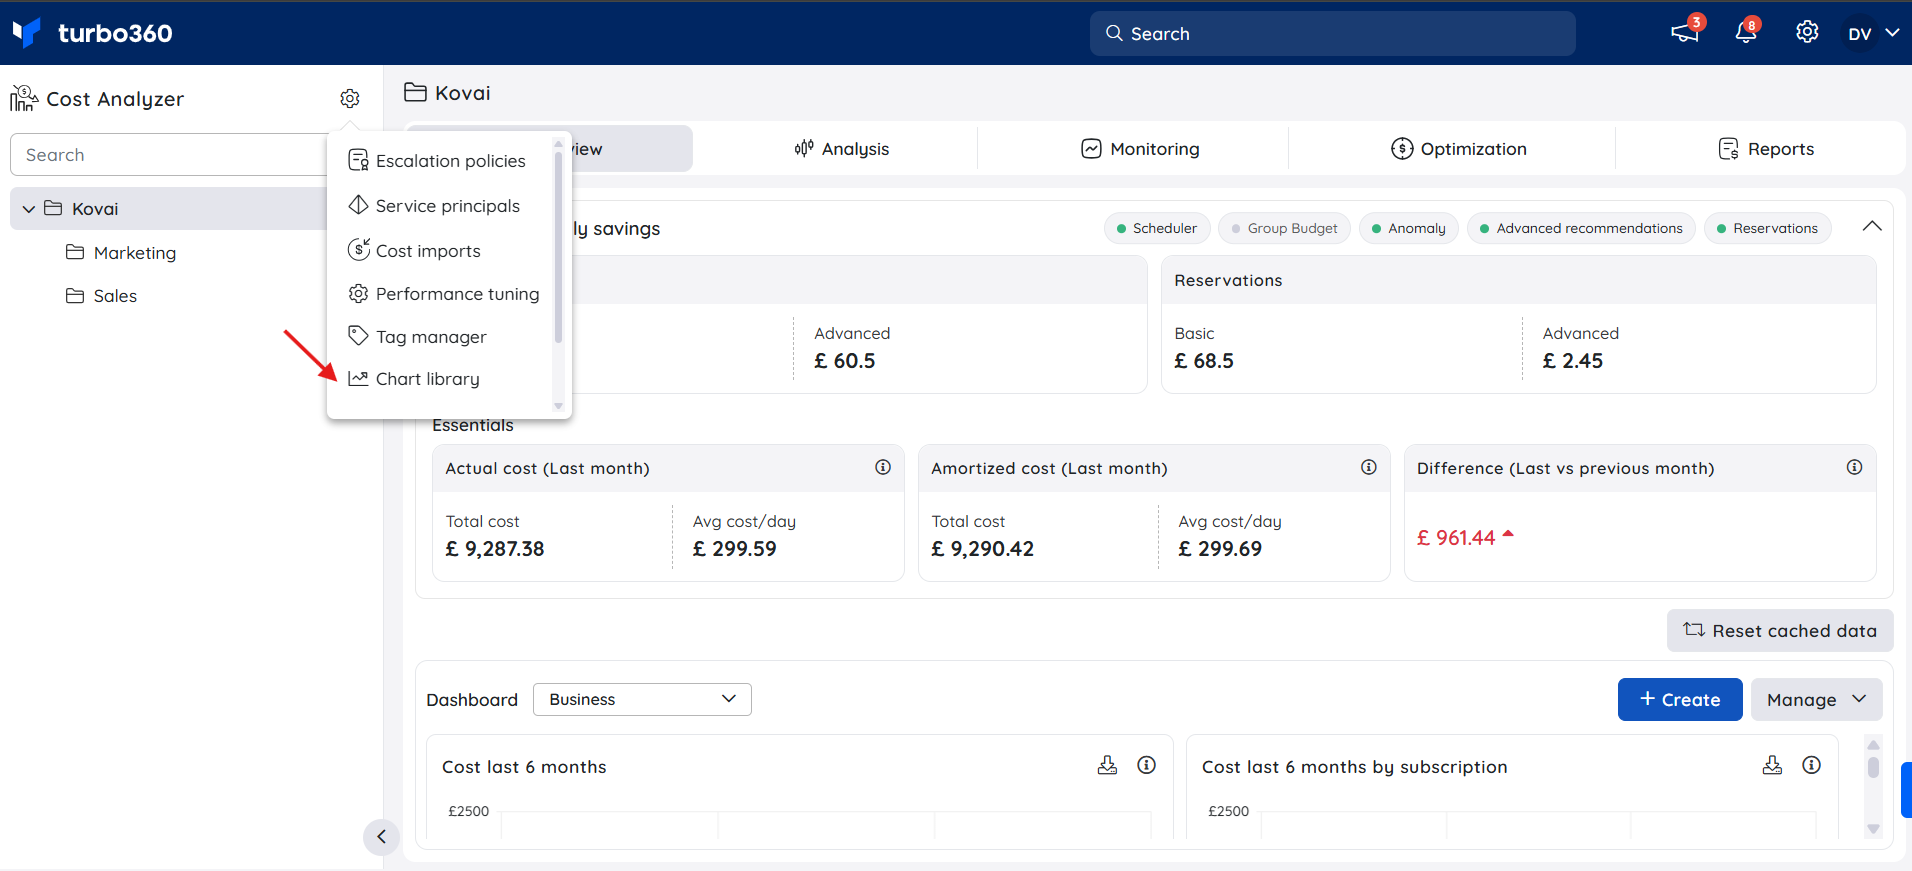
Use the following steps to create, edit, clone, export, import, apply, delete, and use chart schemas. Navigate to Settings > Chart library to get started.
Create a chart schema
Creating a chart schema captures a set of filters, groupings, and chart configuration as a reusable object you can apply to any cost management group.
- Navigate to Settings > Chart library. If the library is empty, select + Add chart schema. Otherwise, click Actions > Add chart schema.
- Enter a unique name and a description to distinguish the schema from others.
- Enable Comparison chart to preview the schema in a comparison format.
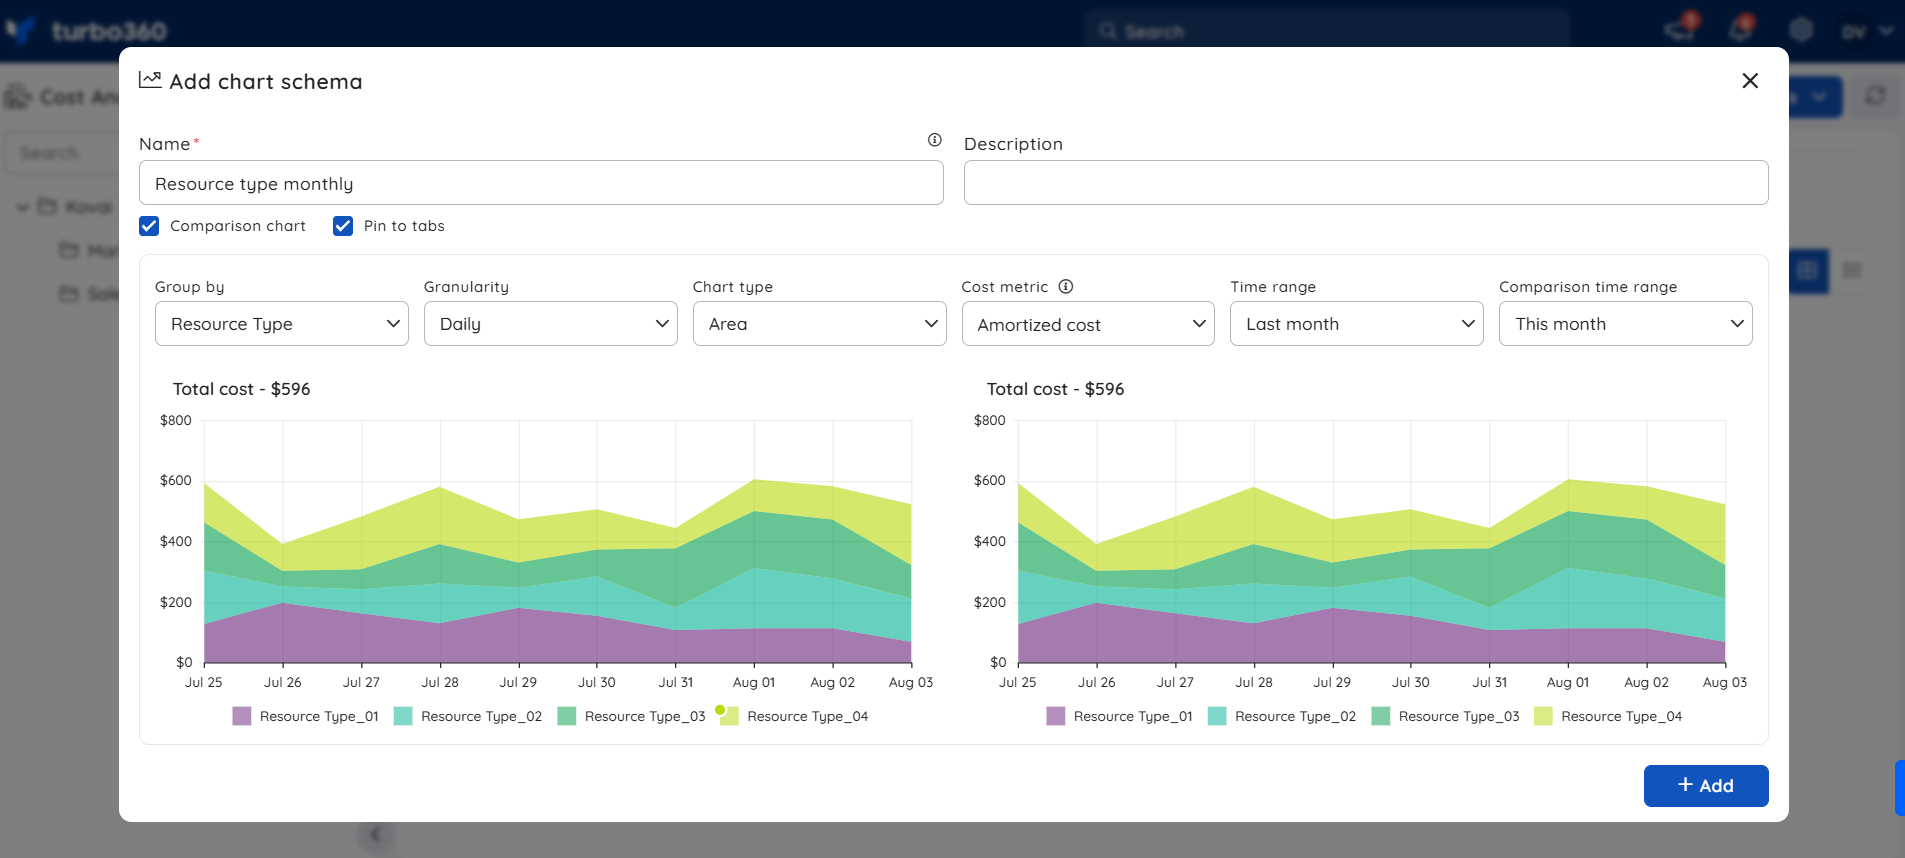
- Check Pin to tabs to pin the schema as an Analysis view within the associated cost group.
Checking Pin to tabs pins the Analysis view with the applied schema in Cost Analysis and saves it to Saved views.
- Configure the filters that should align cost details in a cost management group with this schema when accessed from the Cost library in the Analysis view.
The Subscription filter is excluded from the chart schema. When applied to a cost management group, the schema applies to all subscriptions within that cost management group from Cost Analysis.
- Click Add to create the schema in the Chart library.
Edit a chart schema
Editing a schema lets you update its filters or configuration — note that changes do not propagate to cost groups or Analysis views that already use the schema.
- Go to Settings > Chart library.
- Click the context menu.
- Select Edit.
- Make the required changes and click Update.
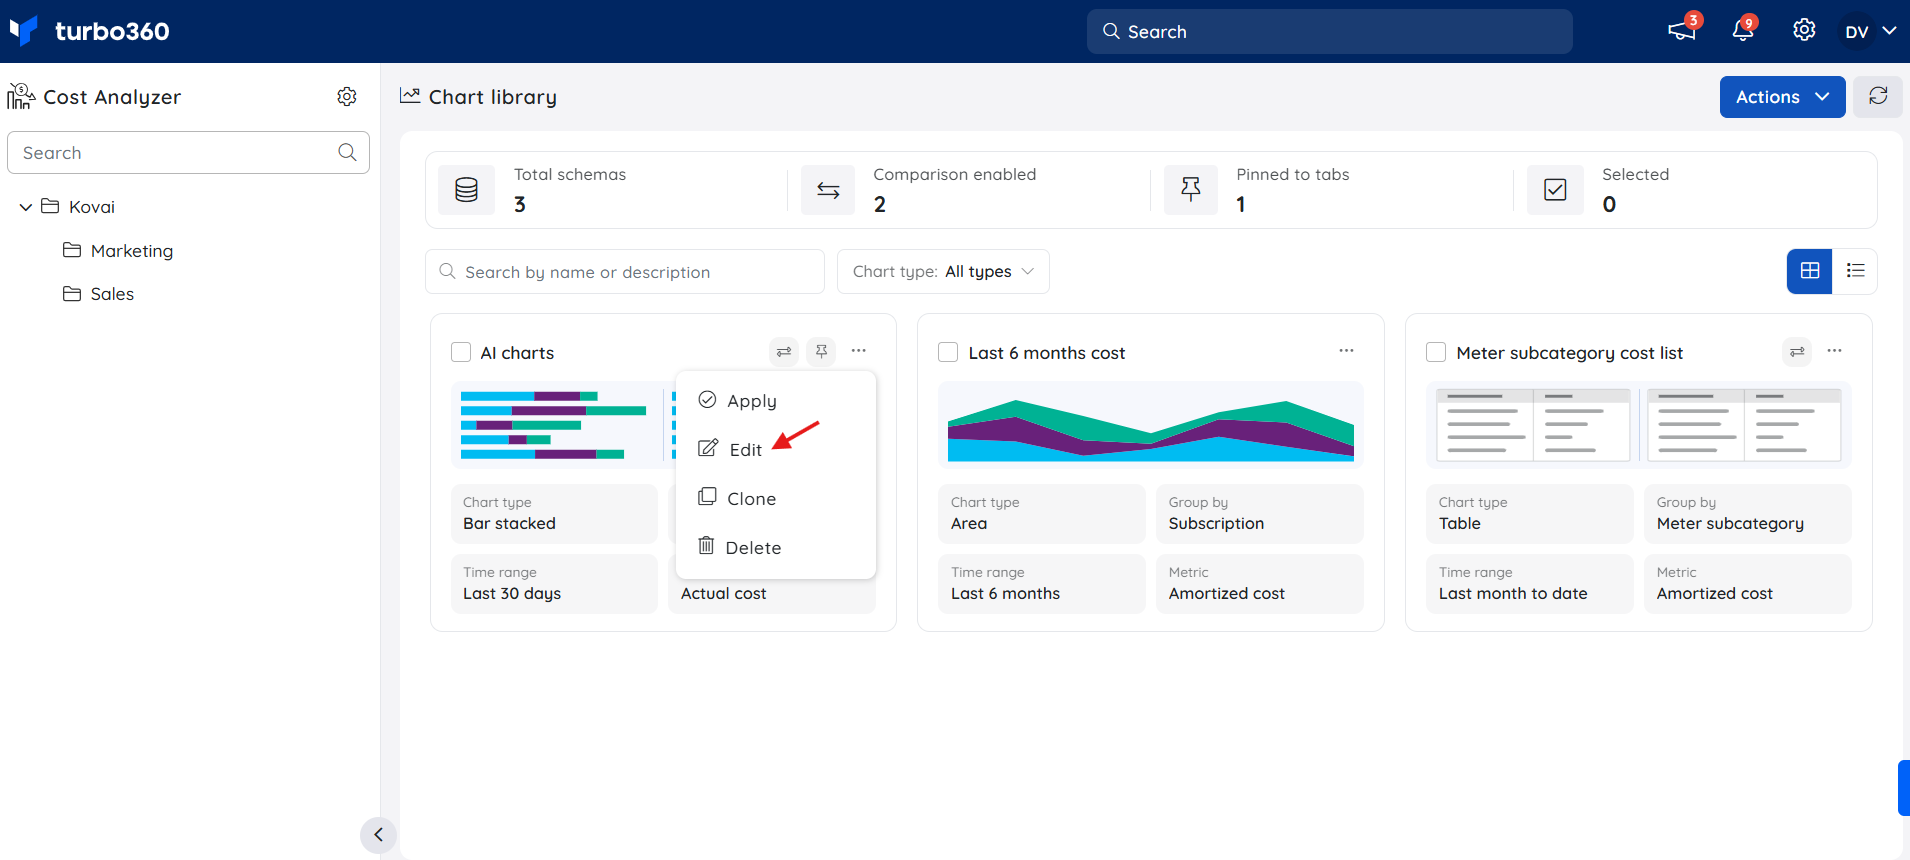
Modifications to an existing schema have no effect on charts already applied to a cost group, or those pinned in an Analysis view of a cost group.
Clone a chart schema
Cloning creates a copy of an existing schema, giving you a starting point to build a variation without modifying the original.
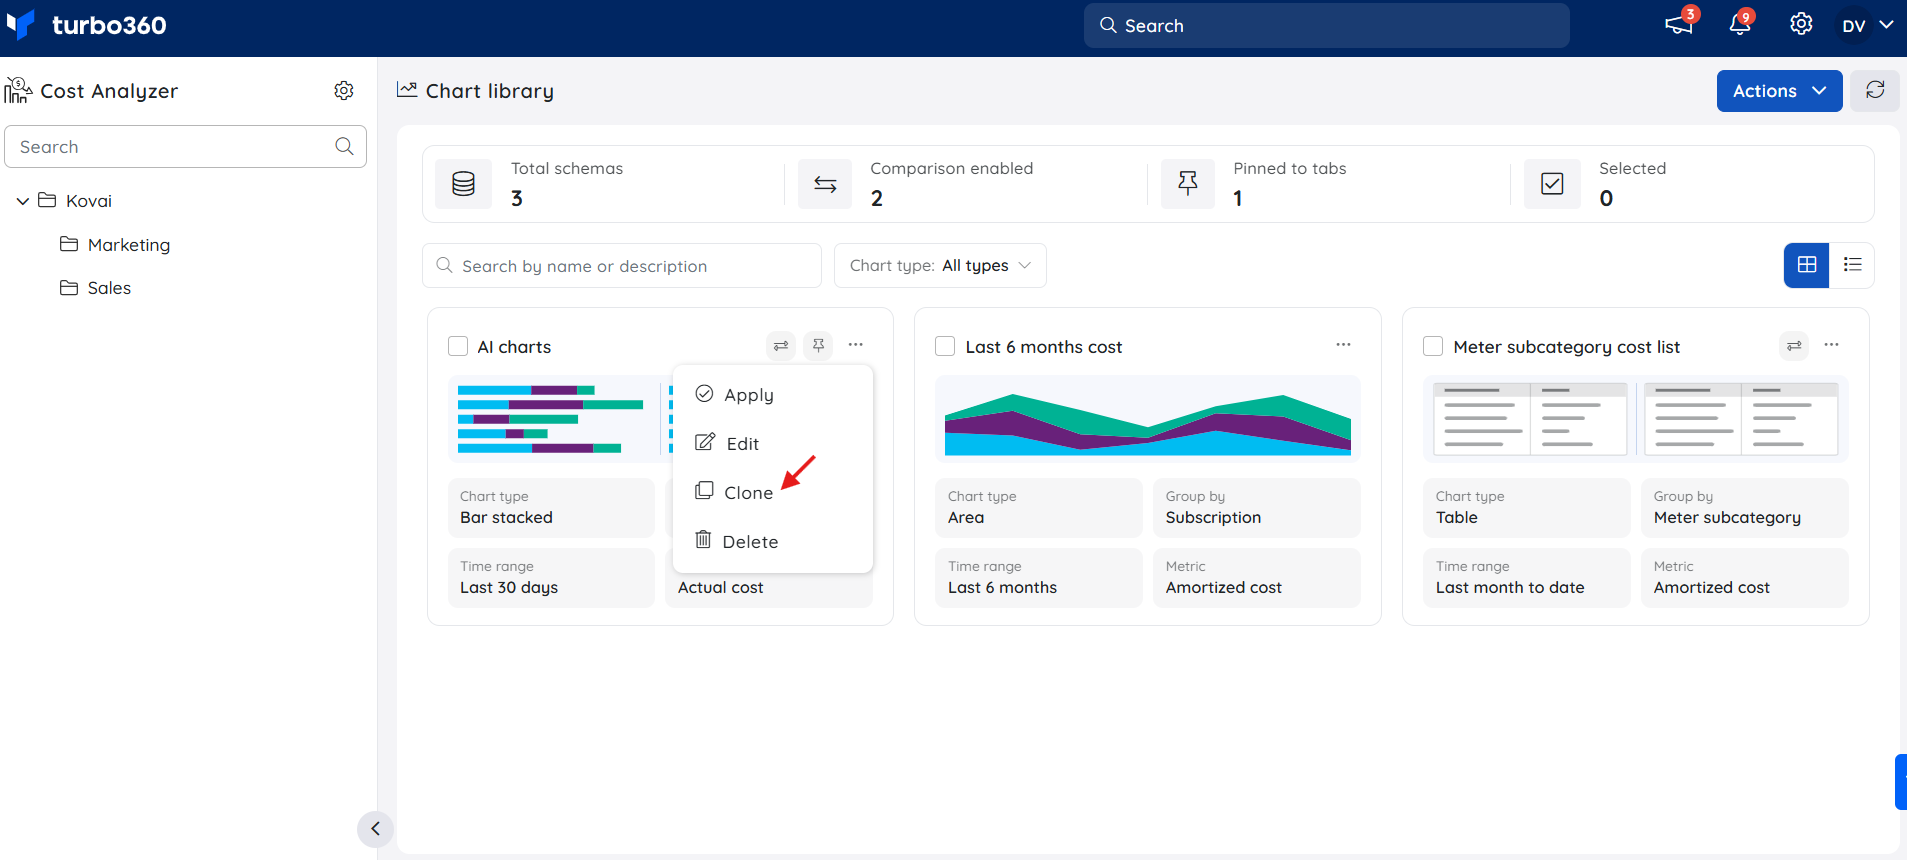
- Go to Settings > Chart library.
- Access the Context menu and select Clone.
Export a chart schema
Exporting a schema saves it as a JSON file so you can back it up or import it into another environment.
- Navigate to Settings > Chart library.
- Select the chart schema, or schemas to export.
- Click Actions > Export selected.
- Name the resulting JSON file and confirm by selecting Export.
.png)
Import a chart schema
Importing a schema loads a previously exported JSON file into the Chart library, making it available to apply to cost management groups.
- Navigate to Settings > Chart library.
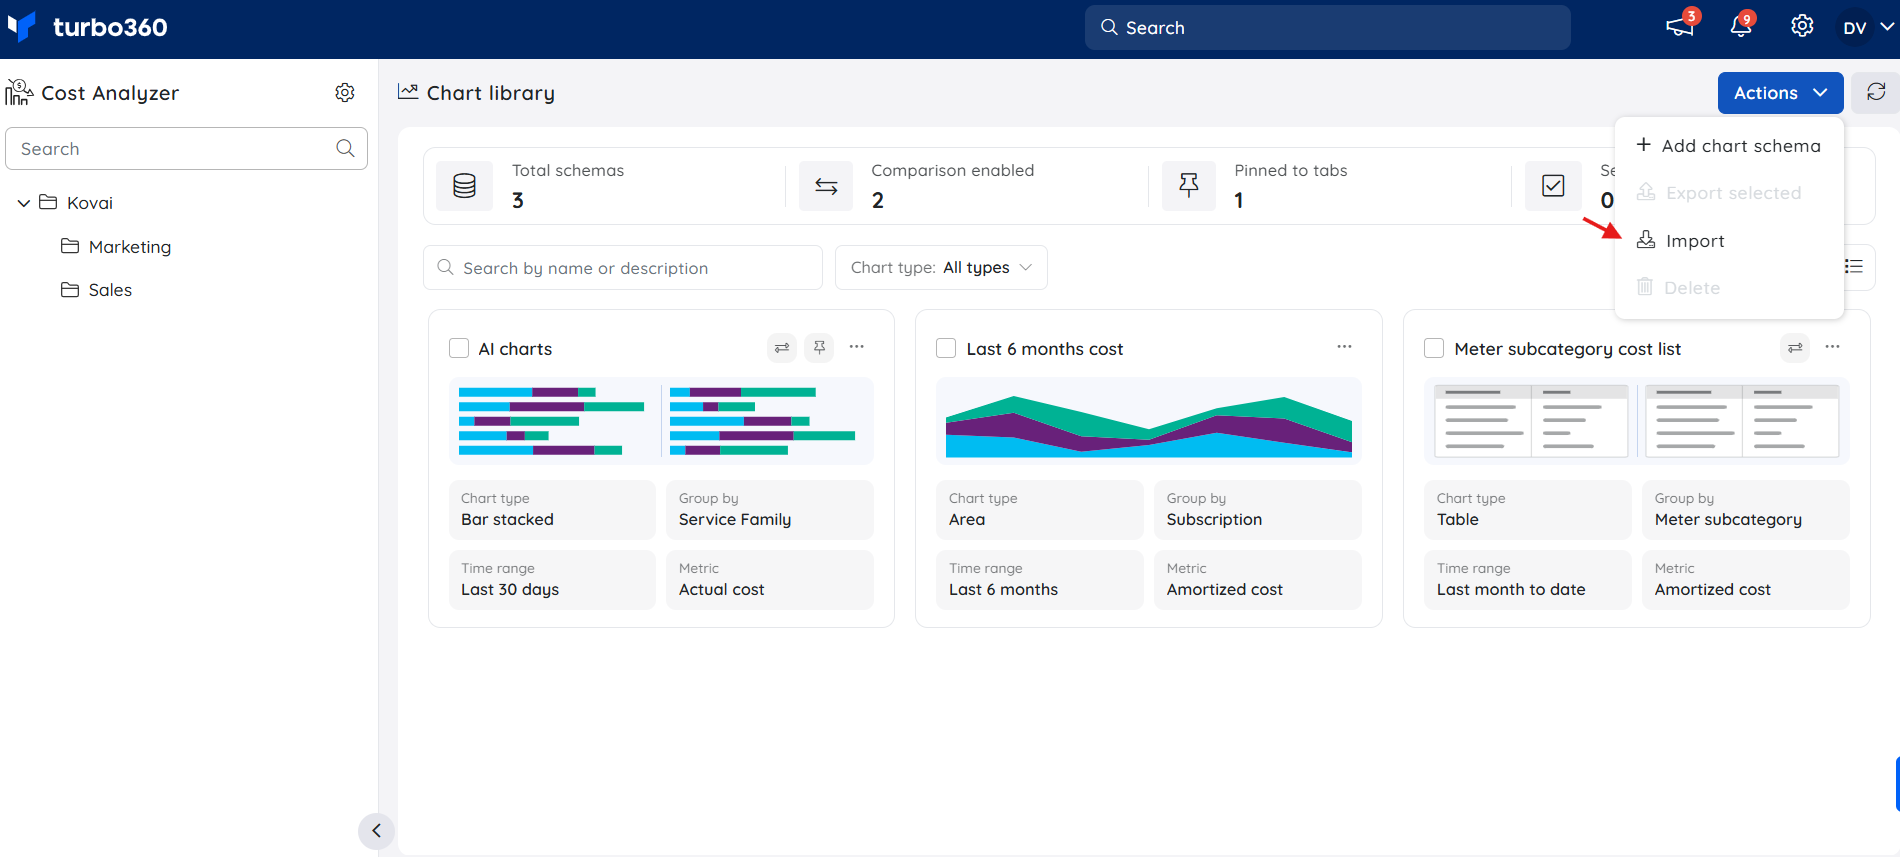
- Click Actions > Import.
- Browse and select the required JSON file from your device.
- Confirm by clicking Import.
Apply a schema to a cost management group
Applying a chart schema to a cost management group stores it as an Analysis view in Saved views.
- Go to Settings > Chart library.
- Click the Actions menu next to the desired schema.
- Select Apply.
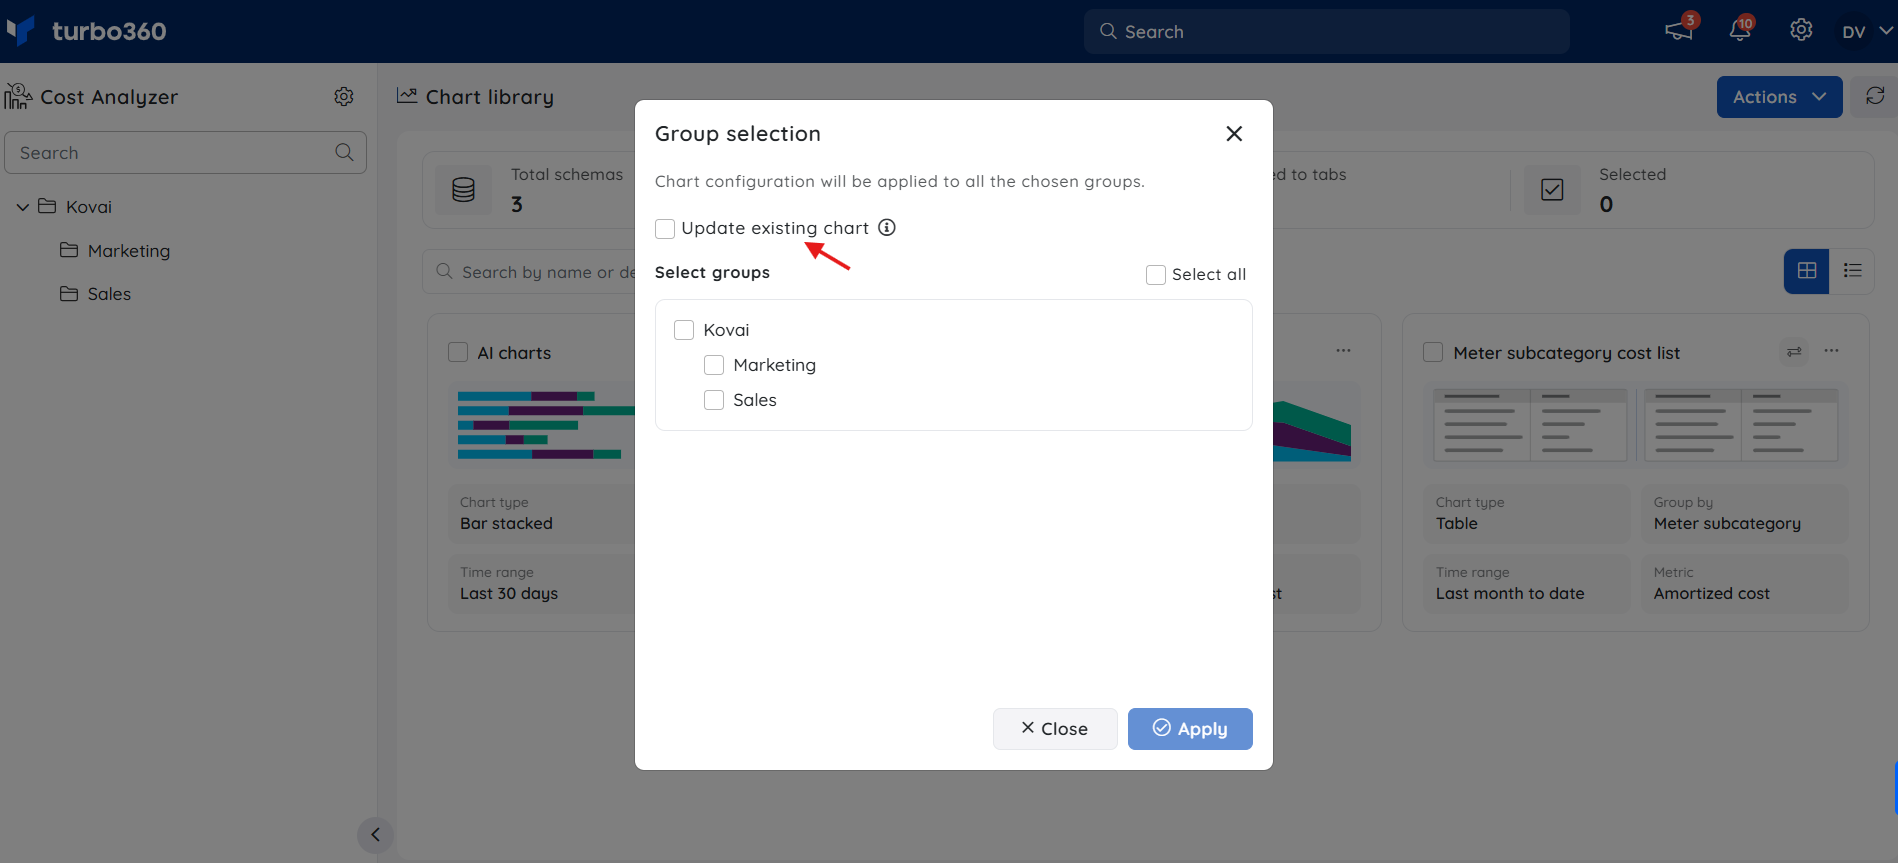
- Choose the cost groups to apply the schema to and store it as an analysis view.
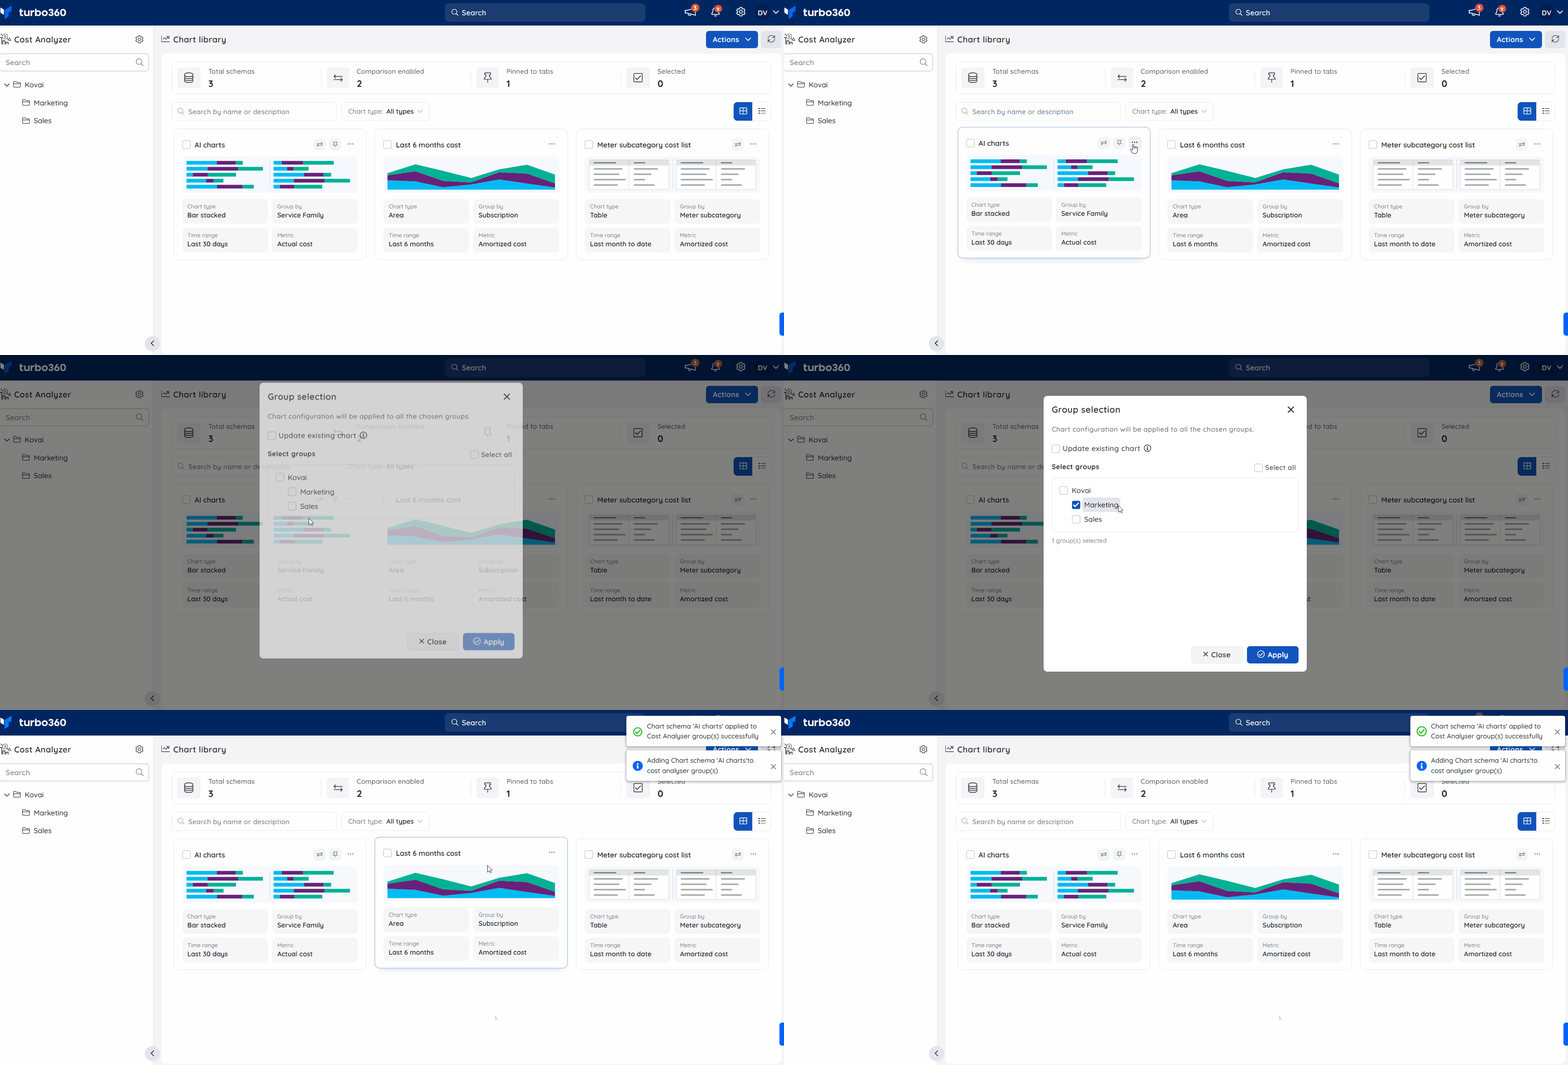
Choosing Update existing chart for a selected cost group applies any available schema updates to the chart already associated with that cost group.
Delete a chart schema
Deleting a schema removes it from the Chart library permanently. Cost groups to which the schema was already applied or pinned are not affected — their Analysis views remain intact.
To delete a single schema:
- Go to Settings > Chart library.
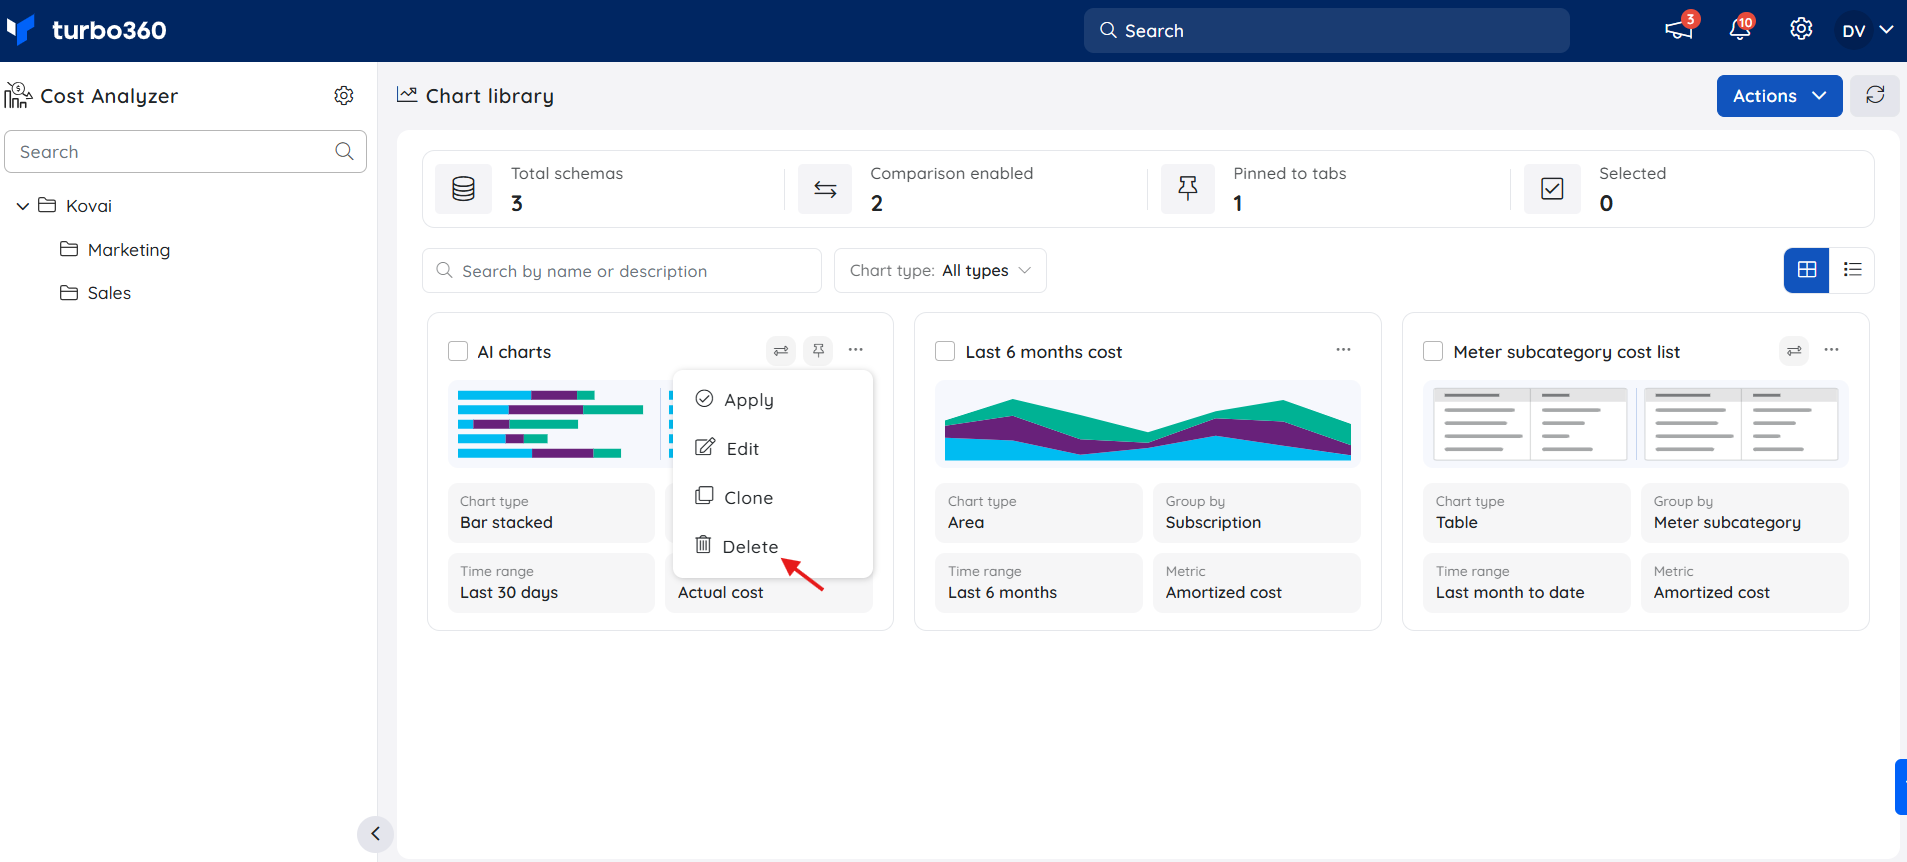
- Click the Context menu next to the schema you want to delete.
- Select Delete.
- Confirm the deletion.
To delete multiple schemas at once:
- Go to Settings > Chart library.
- Select the checkboxes next to the schemas you want to delete.
- Click Actions > Delete.
- Confirm the deletion.
Switch between grid and list view
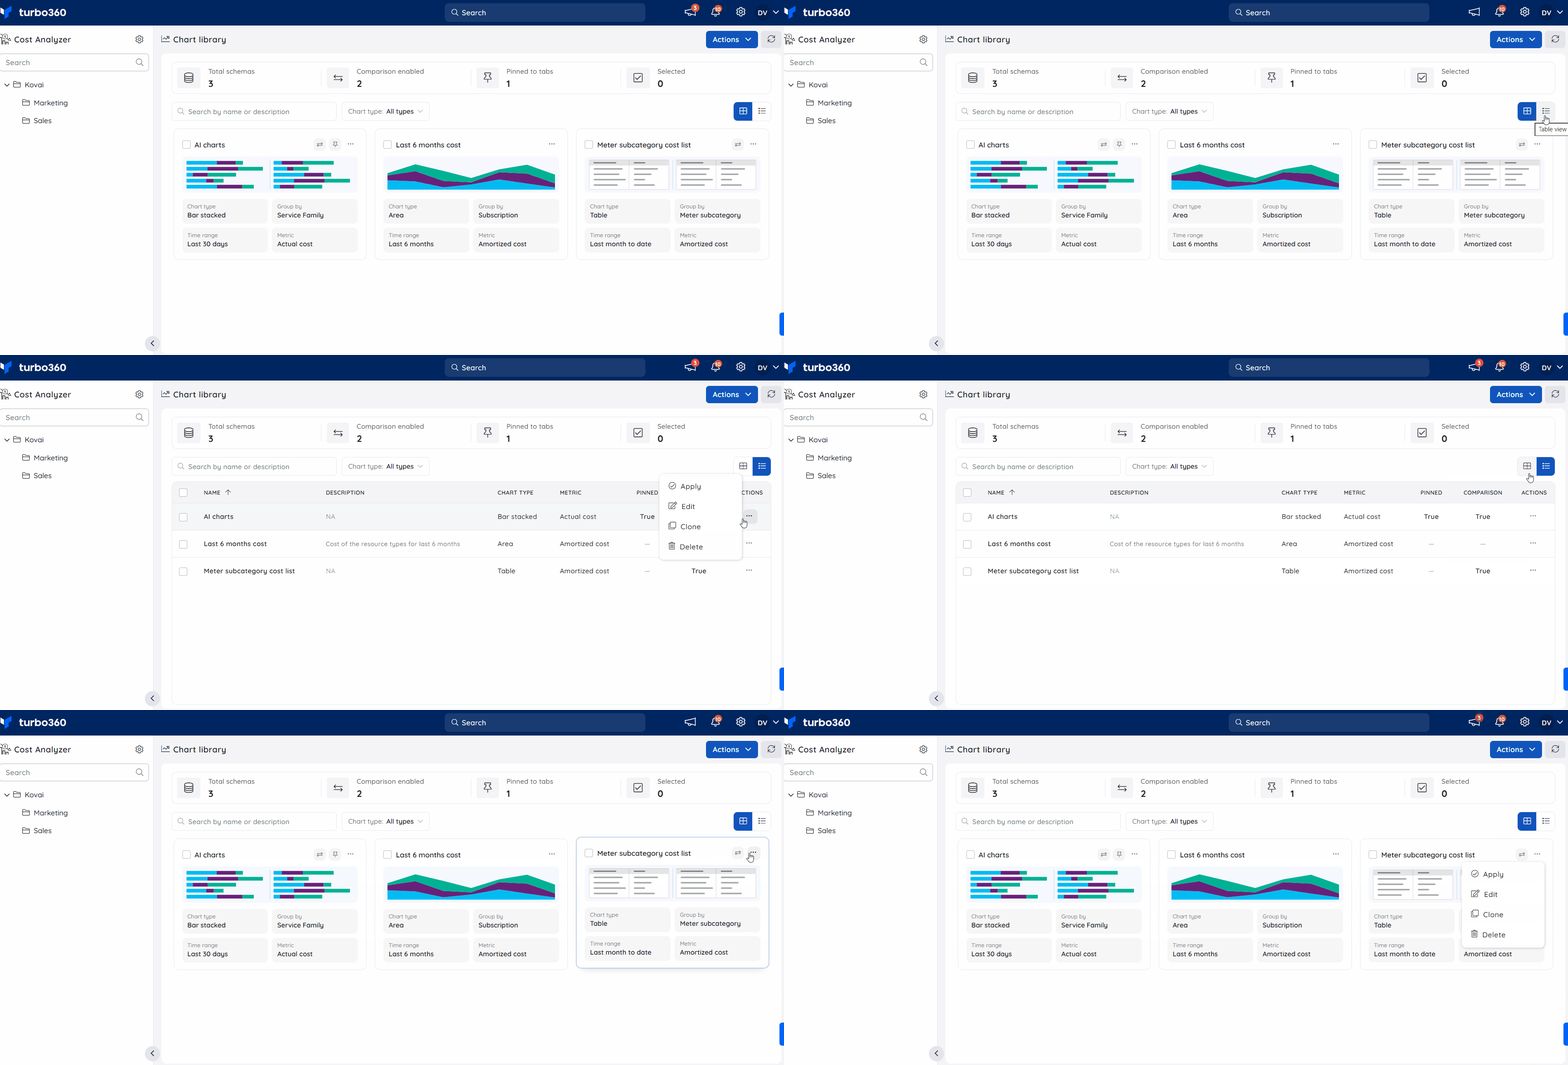
Switching views lets you see schemas as cards or as a sortable table, which is useful when comparing many schemas at once.
- Go to Settings > Chart library.
- Click the grid view or list view icon in the top-right of the Chart library.
Filter or search for a chart schema
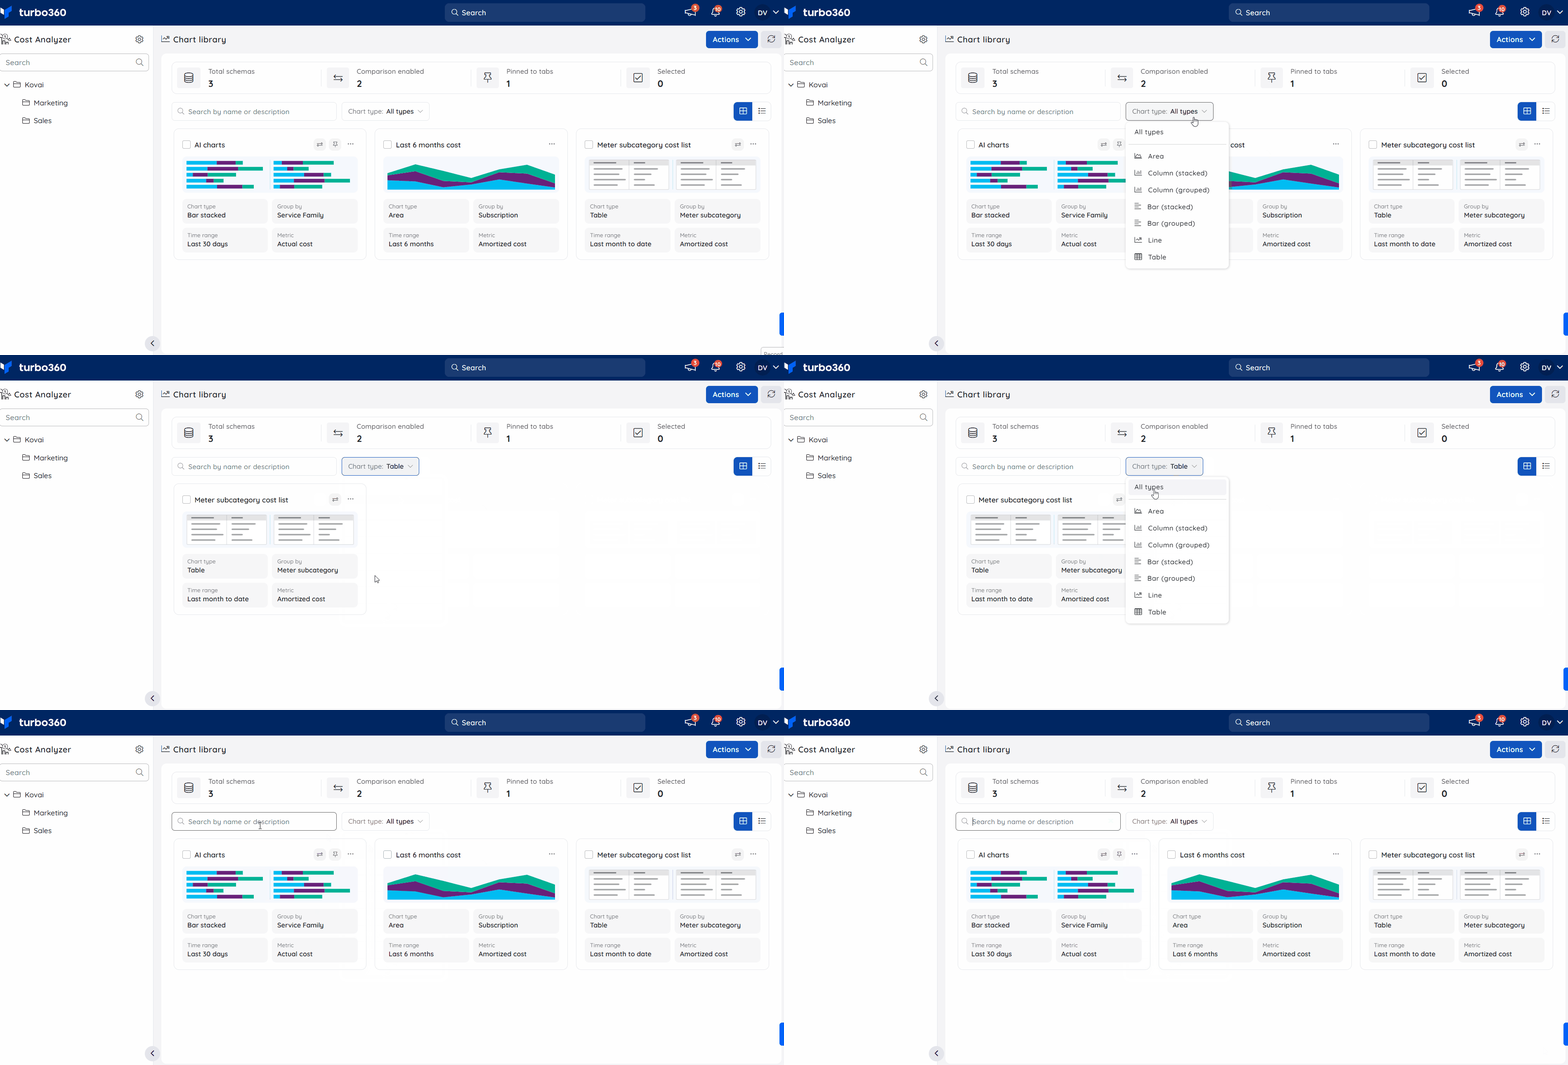
Filtering or searching narrows the Chart library to schemas matching a specific chart type or name, which is useful once the library grows large.
- Go to Settings > Chart library.
- Use the Search by name or description field to find a schema by name, or select a Chart type filter (Area, Column (stacked), Column (grouped), Bar (stacked), Bar (grouped), Line, Table) to narrow the list to schemas of that type.
Use the Chart library from an Analysis view
Accessing the Chart library from within an Analysis view lets you apply any schema directly to the subscriptions in that view without navigating to Settings.
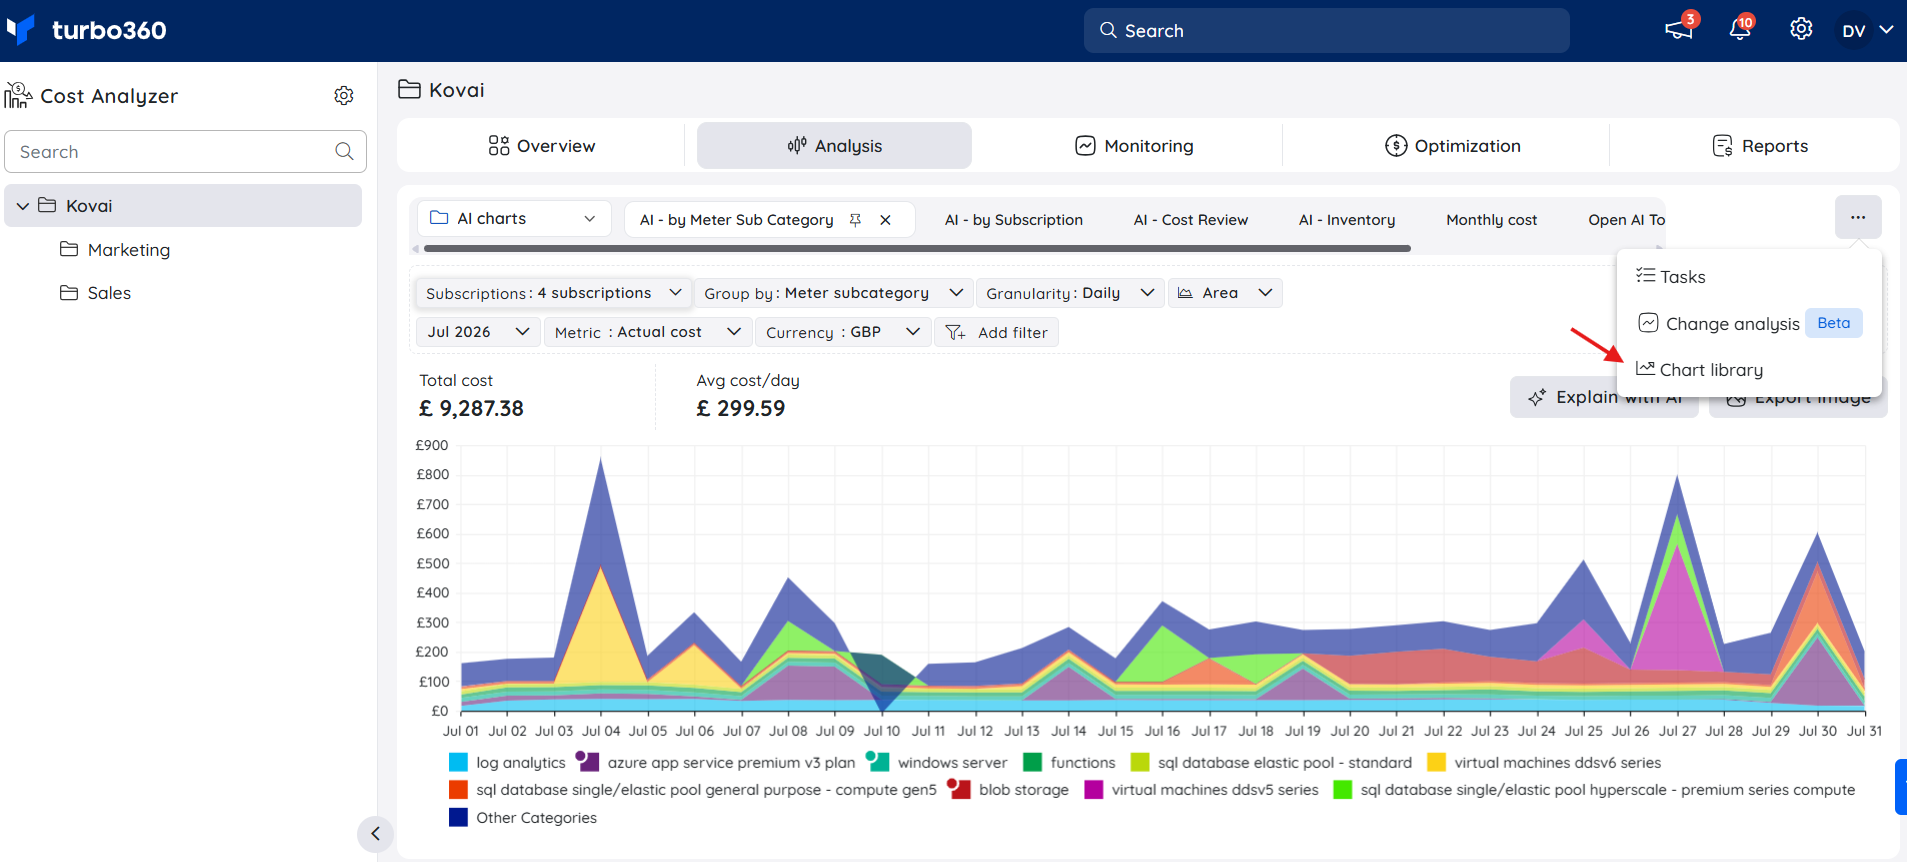
- The Chart library option in Cost Analysis lets you access any chart schema and apply it to all available subscriptions.
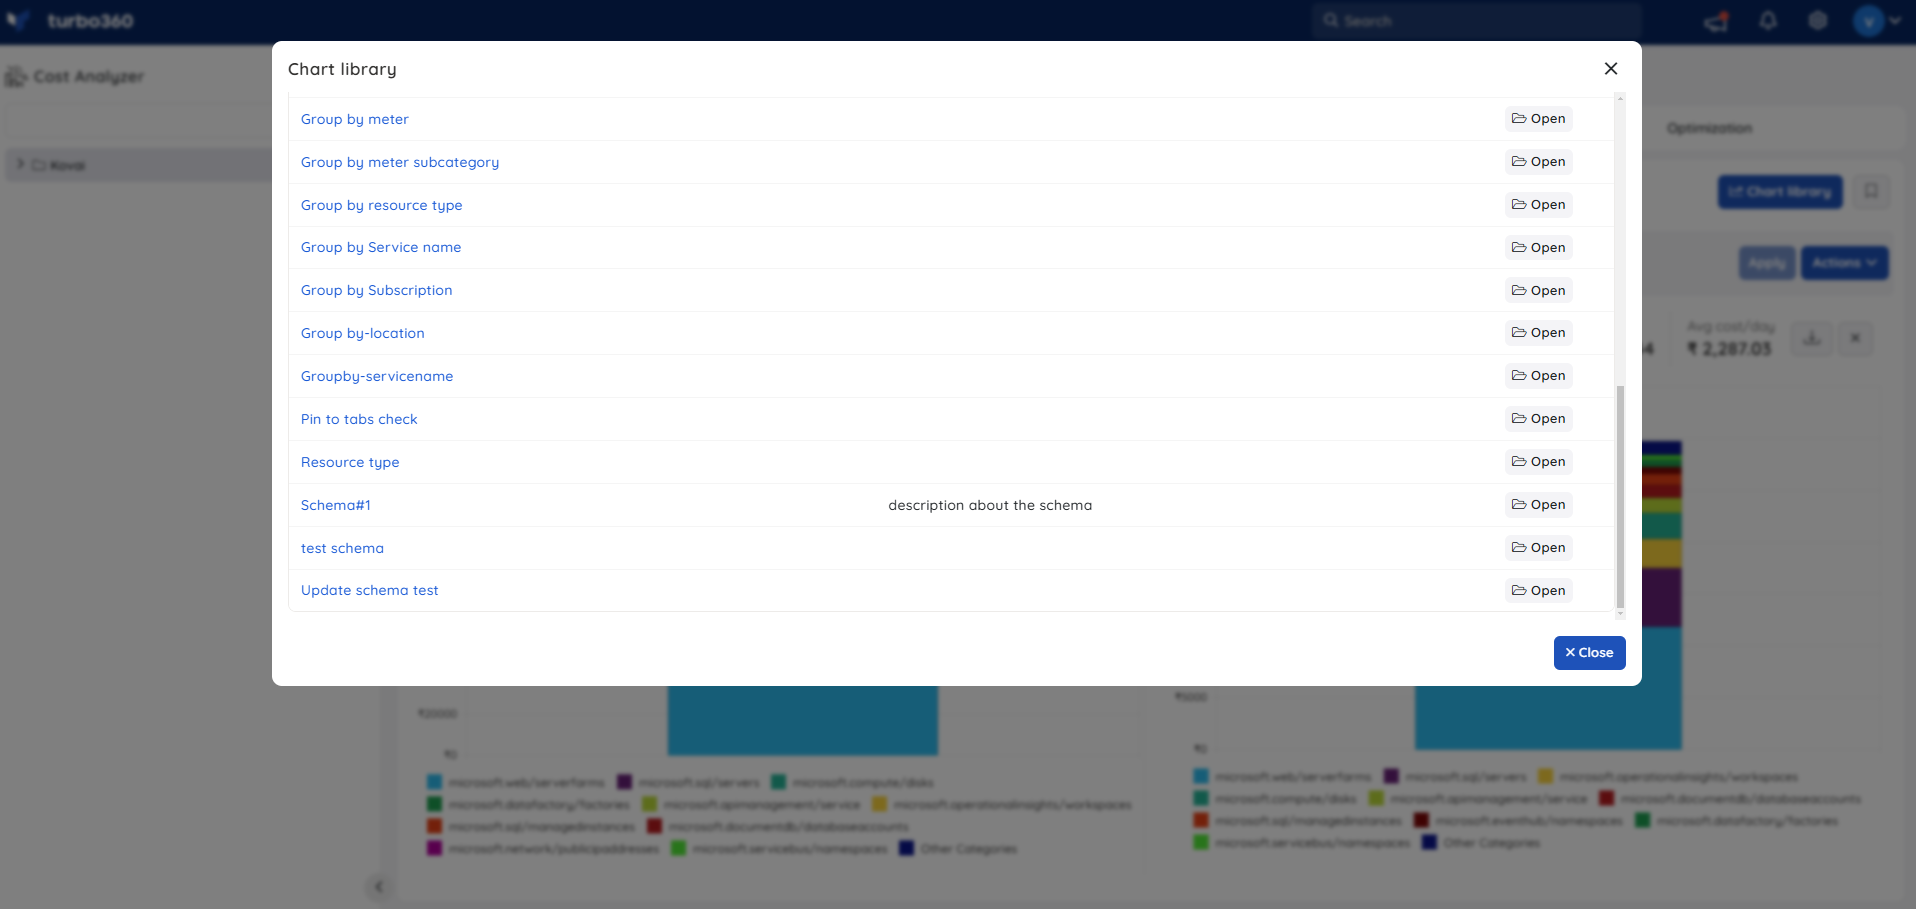
- Clicking a schema name shows a preview of that schema.
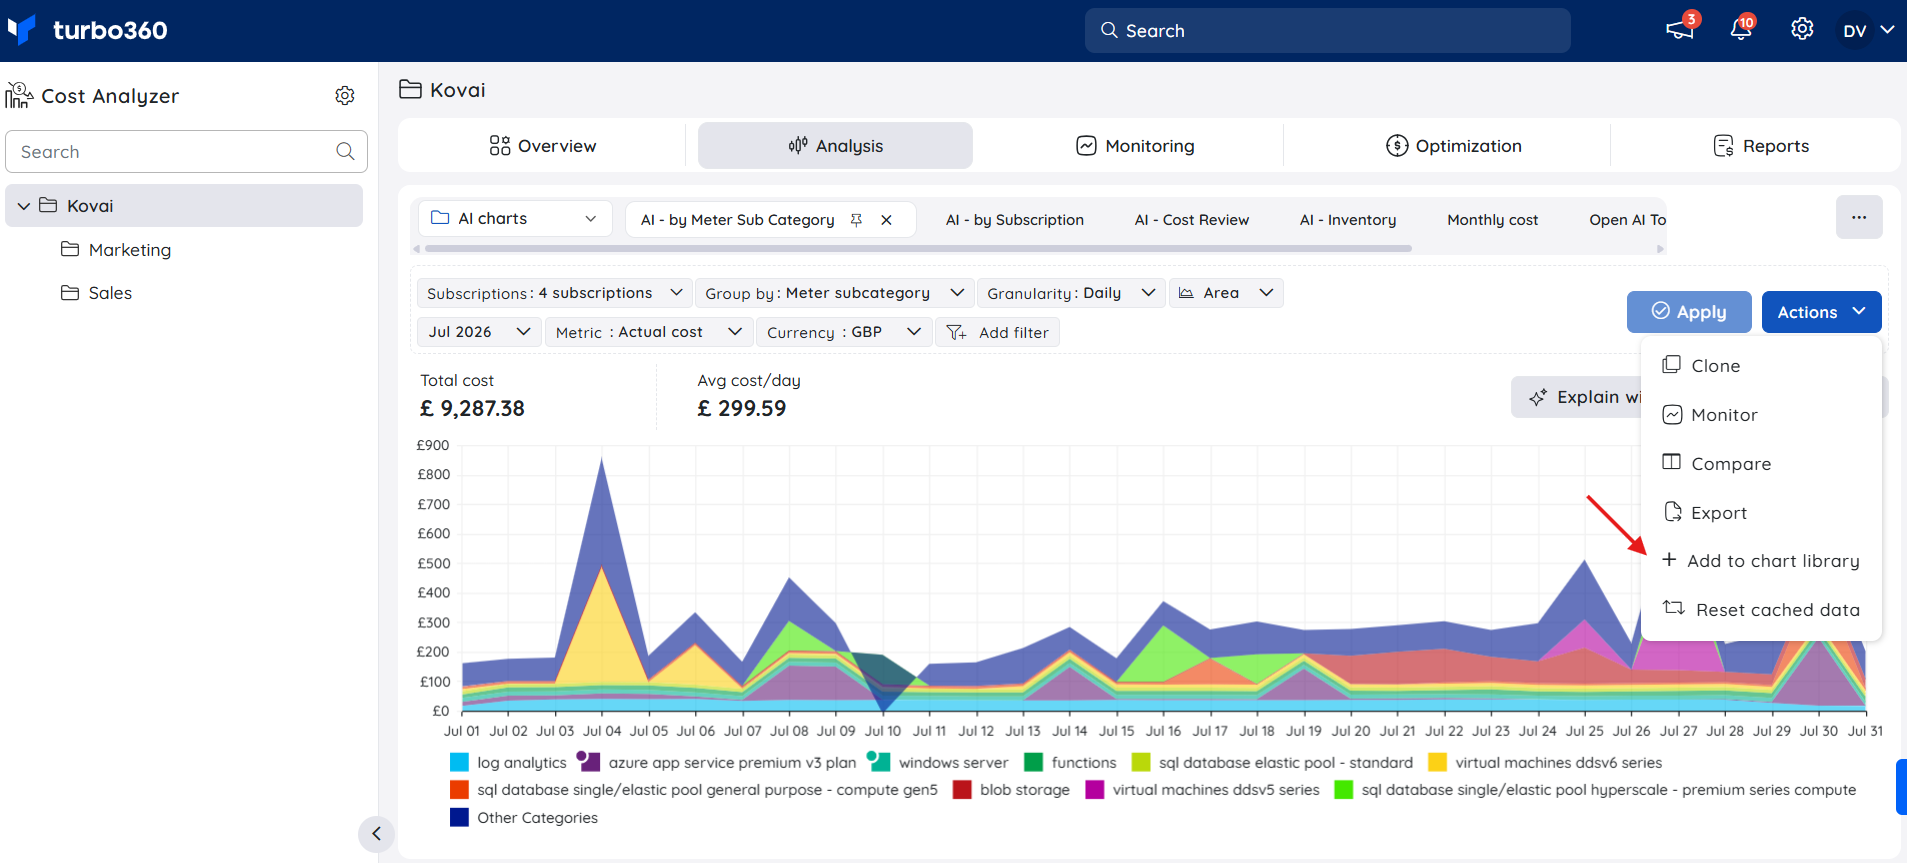
- Filters from an Analysis view can be captured as a chart schema and added to the library using Actions > Add to chart library.
Example scenario
A FinOps team standardizes monthly budget reviews across 12 cost groups. They build one chart schema with the comparison chart enabled and the required groupings, then apply it to each cost group from the Chart library. Every cost group now opens to the same standardized Analysis view, saved automatically to Saved views.
Limitations
- The Subscription filter cannot be included in a schema — schema-level filtering always applies at the cost management group level, across all subscriptions in that group.
- Editing a schema does not update charts already applied to cost groups or pinned Analysis views; you must reapply the schema to push updates.
Troubleshooting
Editing a schema doesn't change an existing Analysis view
Cause: Schema edits don't propagate automatically to charts already applied to a cost management group or pinned in an Analysis view.
Fix: Reapply the schema and choose Update existing chart for the relevant cost group.A chart schema shows data from subscriptions you didn't expect
Cause: The Subscription filter is always excluded from a chart schema, so the schema applies to every subscription in the selected cost management group.
Fix: Scope cost management groups to the intended subscriptions before applying the schema, rather than relying on the schema to filter subscriptions.
FAQs
Does editing a chart schema update cost groups that already use it?
No. Edits only change the saved schema. Cost groups using the schema, and any pinned Analysis views, keep their existing chart until you reapply and select Update existing chart for the schema.Can a chart schema filter by subscription?
No. The Subscription filter is excluded from every chart schema. When applied, the schema covers all subscriptions in the selected cost group.
Related articles
Was this article helpful?