

Managing Business Application dashboard
- 05 Aug 2026
- 4 Minutes to read
- Print
- DarkLight
- Download PDF
Managing Business Application dashboard
- Updated on 05 Aug 2026
- 4 Minutes to read
- Print
- DarkLight
- Download PDF
Article summary
Did you find this summary helpful?
Thank you for your feedback!
Overview
The Business Application dashboard in Turbo360 supports a range of management actions that let you control how data is visualised and presented. You can adjust time settings, edit and reorder widgets, switch between multiple dashboards, use full-screen mode, zoom into chart data, and download widget data as an Excel workbook — all from within the Dashboard section of a Business Application.
Business value
Having direct control over dashboard configuration means your team can adapt visualisations to match operational context without rebuilding dashboards from scratch. Time settings let you inspect historical windows quickly; ordering and full-screen mode support focused review during incidents; download enables offline analysis and sharing outside Turbo360.
How it works
The dashboard management actions are available from the Dashboard section of any Business Application. You can access the Create and Edit options to build or update dashboards and their widgets. Time settings and widget layout changes apply immediately on save and are reflected in the dashboard view. Downloads are generated on demand and include all current widget data.
Permissions
Dashboard management requires the Dashboard feature permission.
| Permission level | What you can do |
|---|---|
| Read | View dashboards and widgets; switch between dashboards; use full-screen mode and zoom |
| Manage | Create and delete dashboards; add, edit, delete, and reorder widgets; set the default dashboard; download dashboard data |
Steps
Use the following steps to manage your Business Application dashboard. Navigate to your Business Application in the tree view and select Dashboard to get started.
Configure time settings
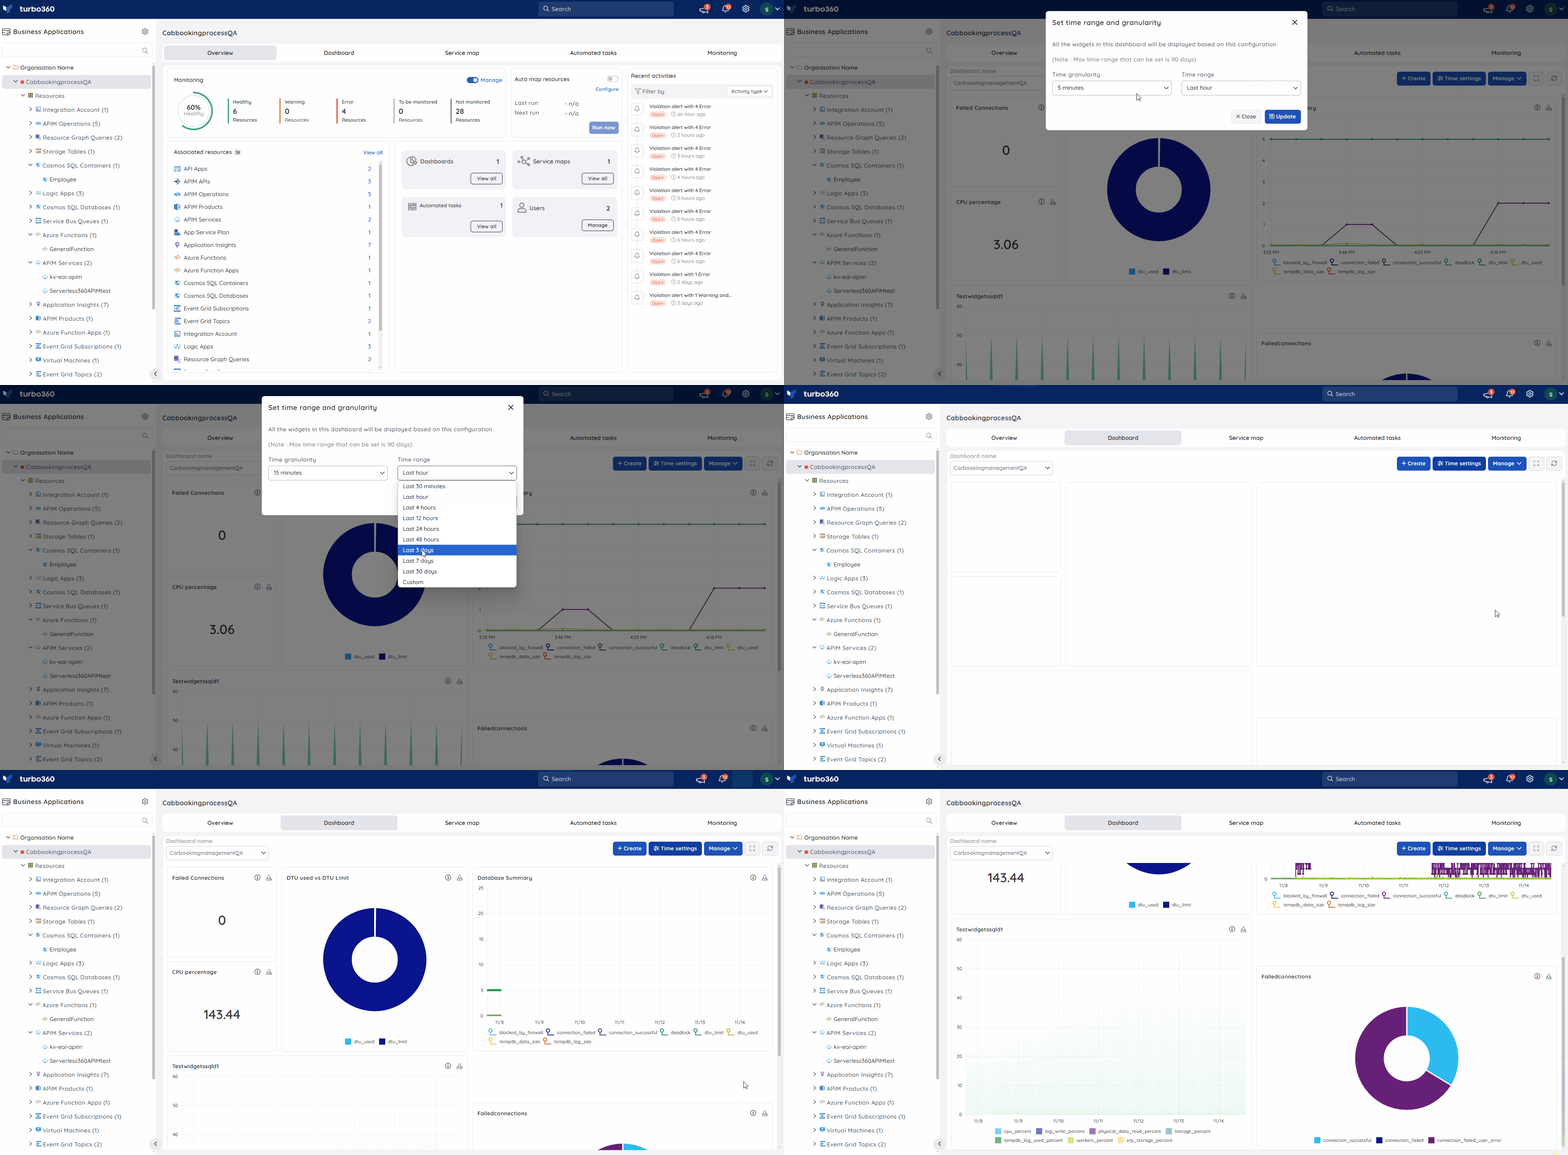
Configuring time settings lets you change the data window displayed across all widgets without modifying individual widget configurations.
The Time Range controls the overall period for which data is displayed. The Time Granularity controls the resolution of the data points within that range. The default is Time granularity — 5 min; Time range — 1 hour. The maximum range you can set is 90 days.
Note:
Time settings are per-account. Your customised values are visible only to you. Other users see the default values.
- Select Time settings in the dashboard header.
- Set your preferred Time Range and Time Granularity values.
- Select Apply to update all widgets.
Edit widgets
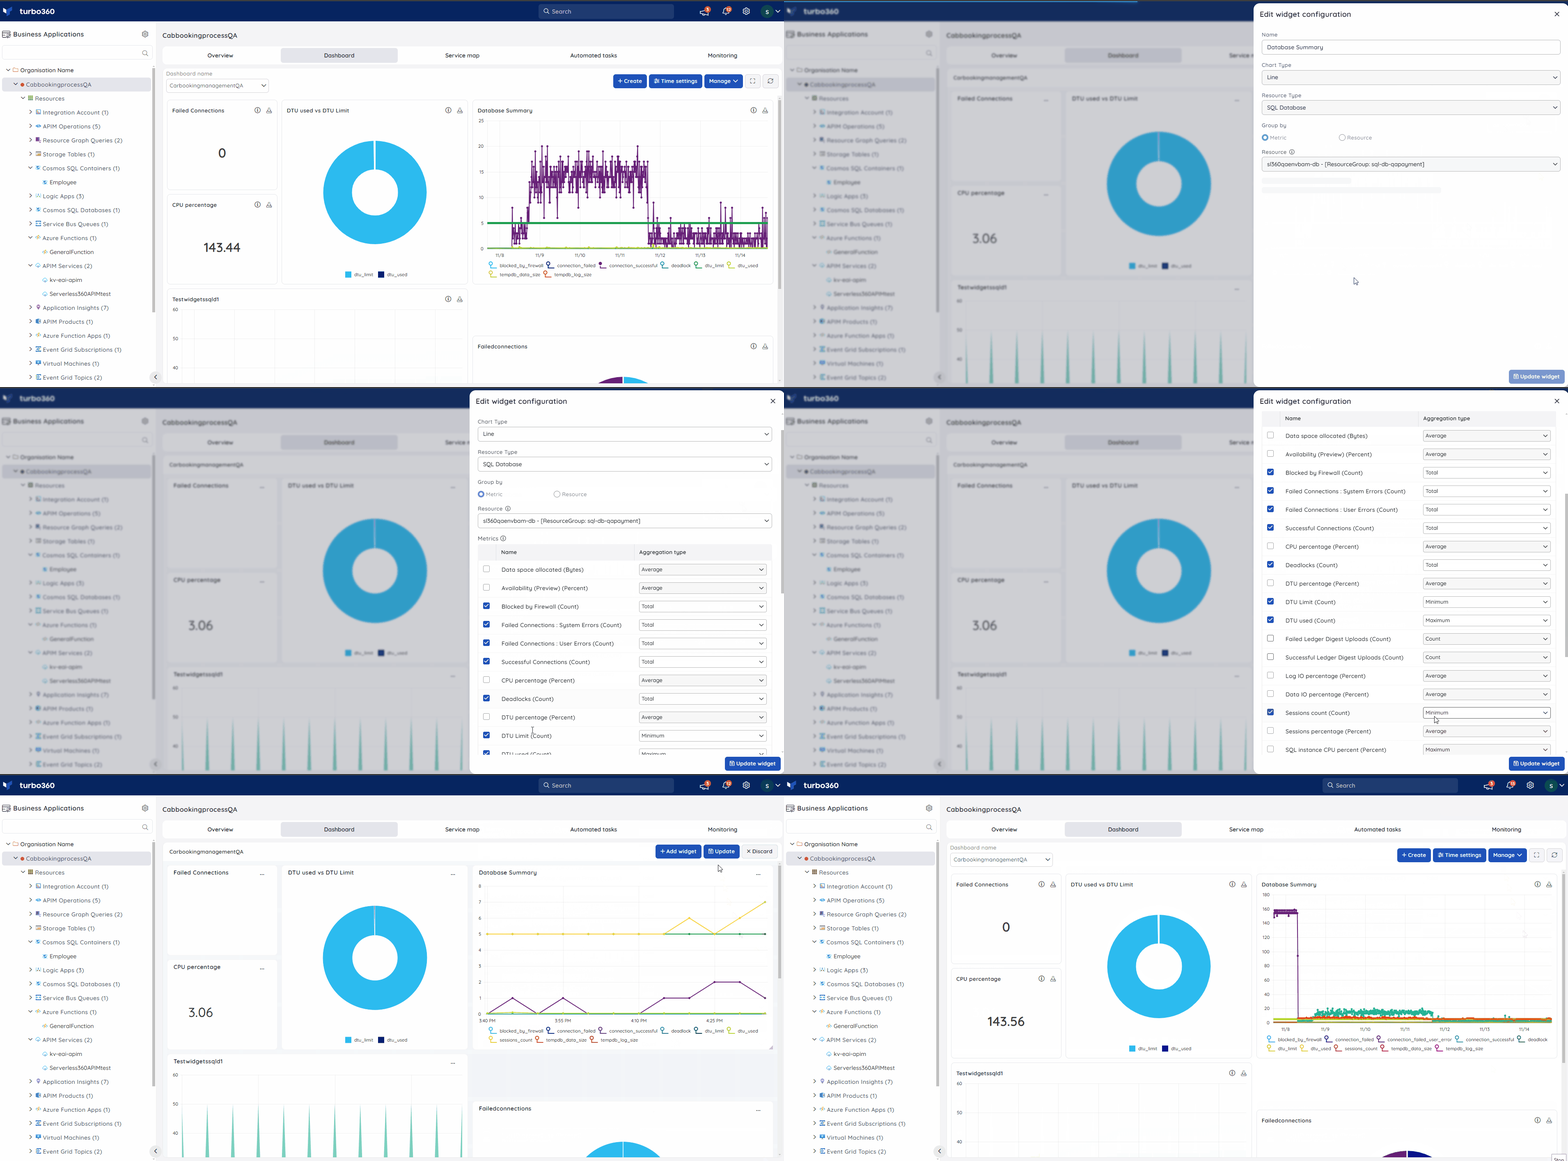
Editing a widget lets you update its metric source, time range, or grouping. The chart type is fixed at creation and cannot be changed.
- Locate the widget you want to update.
- Select the Edit (pencil) icon on the widget.
- Update the widget configuration as needed.
- Save your changes.
Reorder widgets
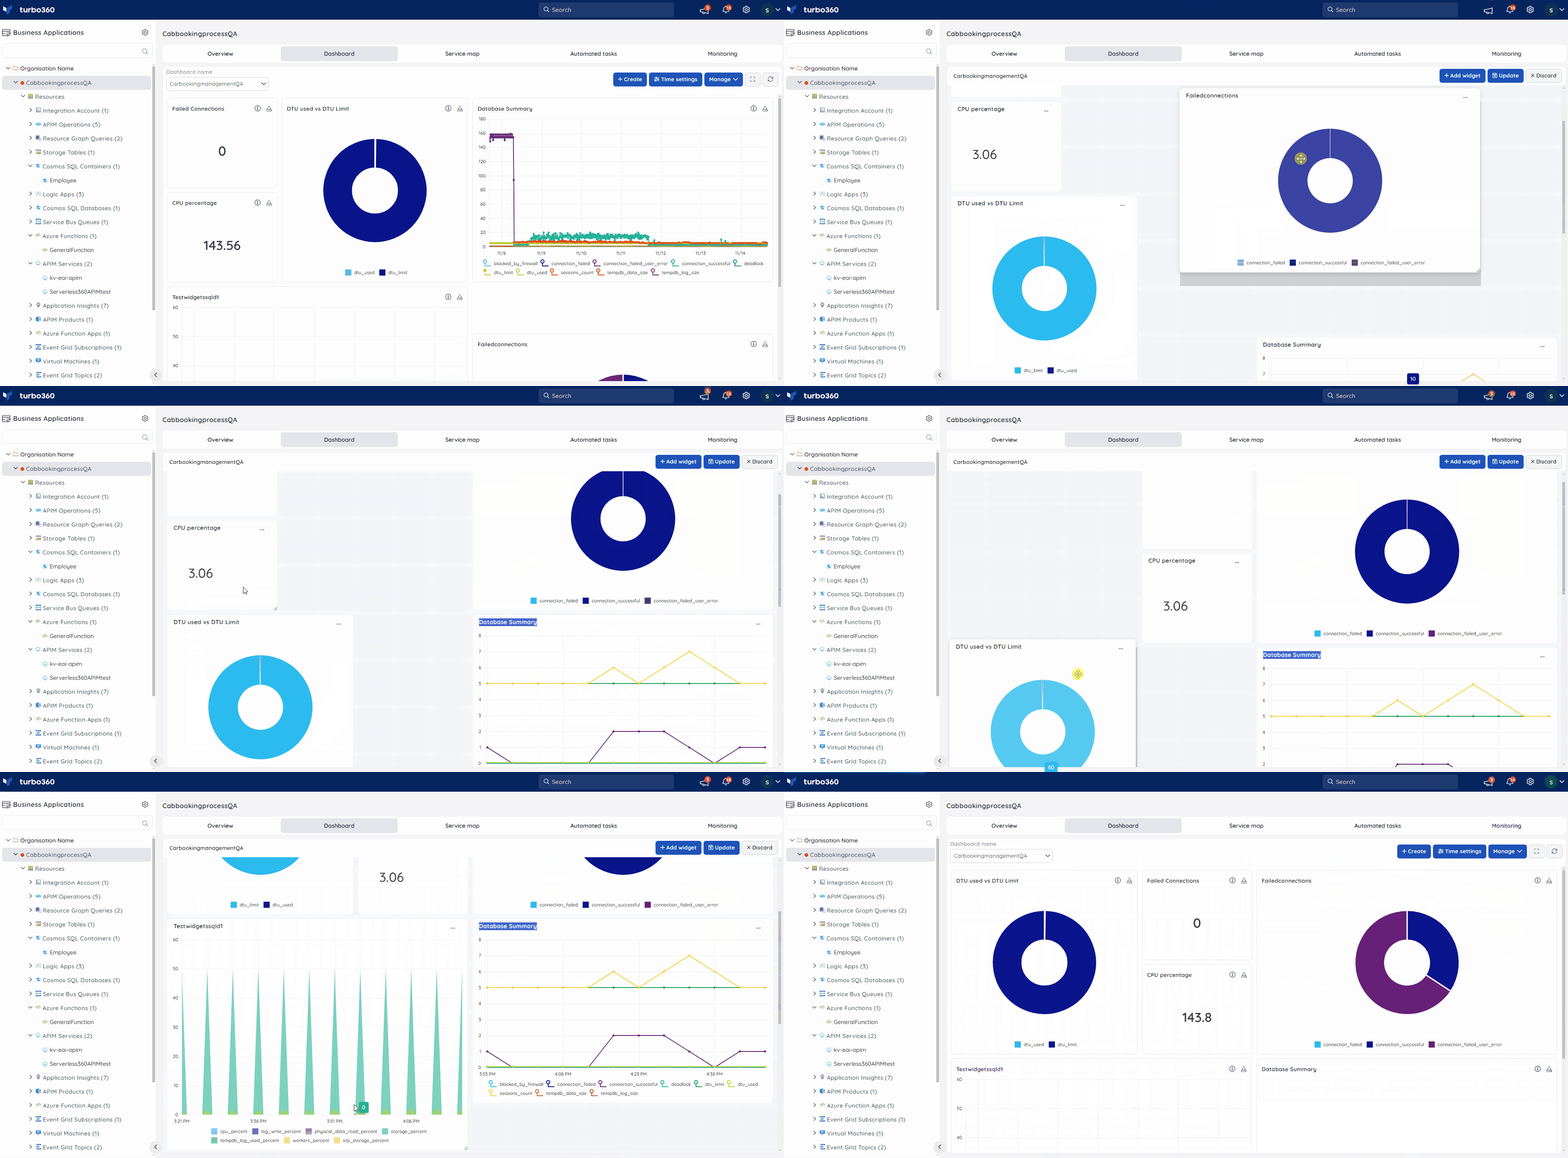
Reordering lets you rearrange the dashboard layout so that the most important metrics appear prominently.
- Select and hold a widget.
- Drag it to the desired position in the dashboard grid.
- Resize the widget by dragging its edges if needed.
Switch between dashboards
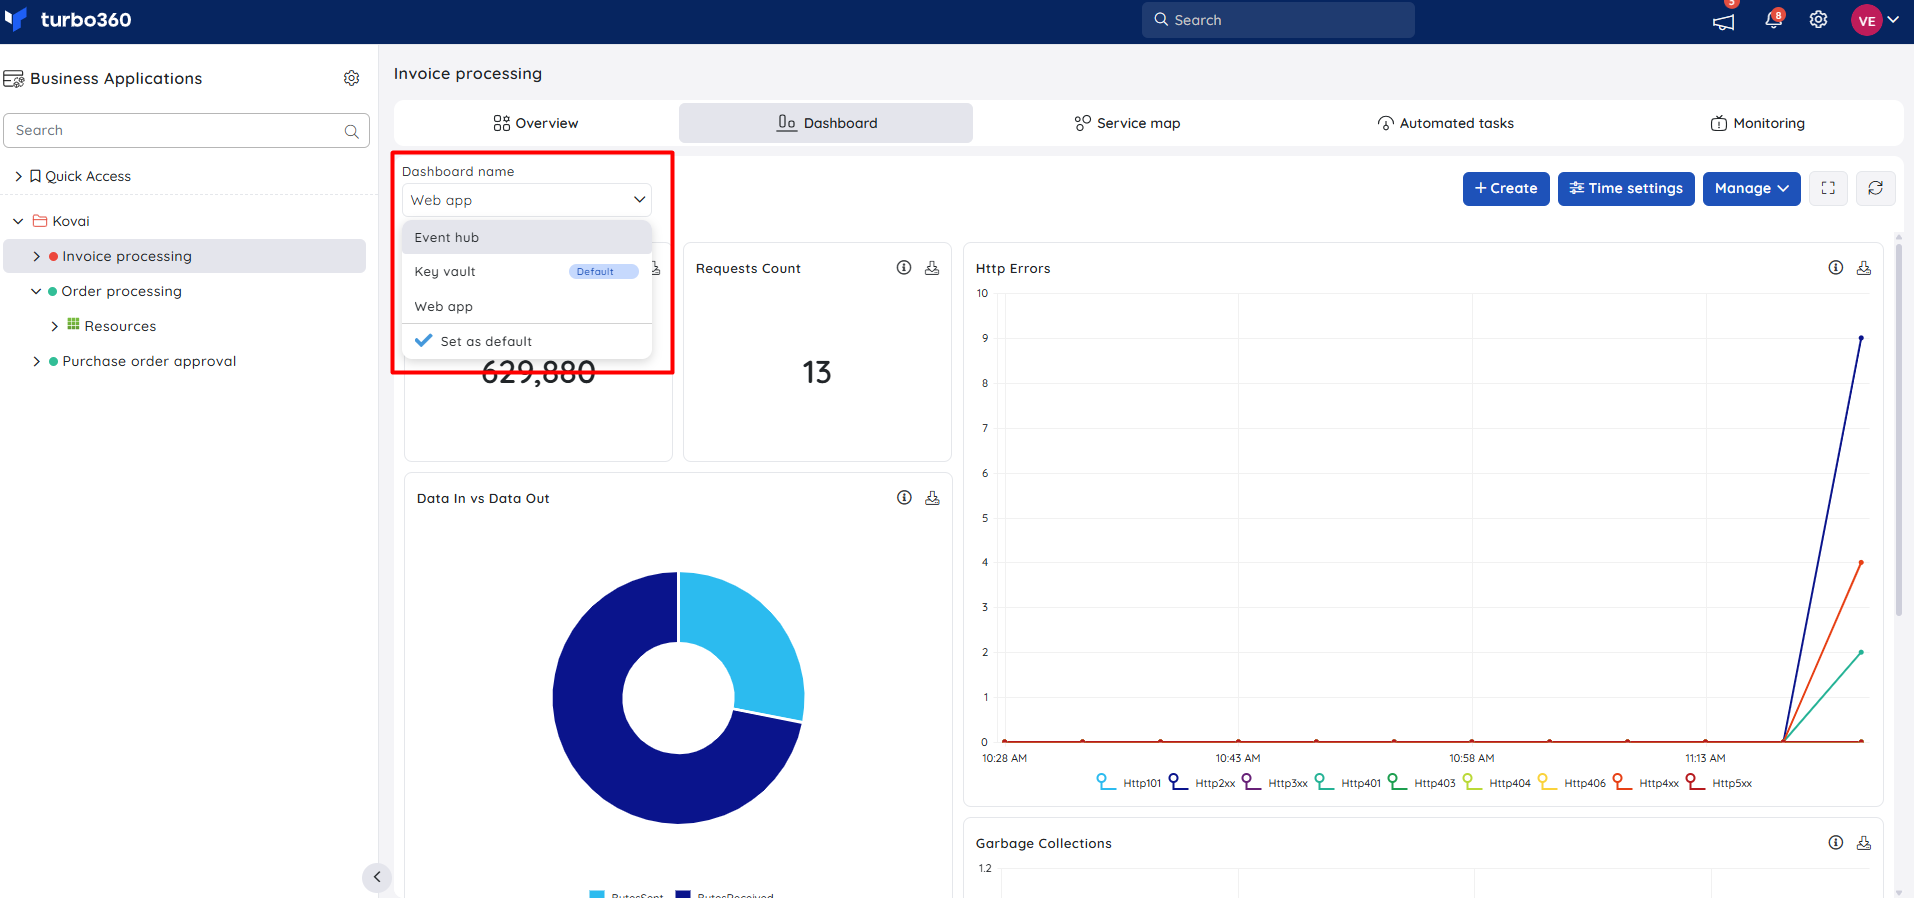
Switching dashboards lets you move between multiple saved dashboards for the same Business Application.
- Select the dashboard name dropdown in the Dashboard section header.
- Select the dashboard you want to view.
Enable full-screen mode
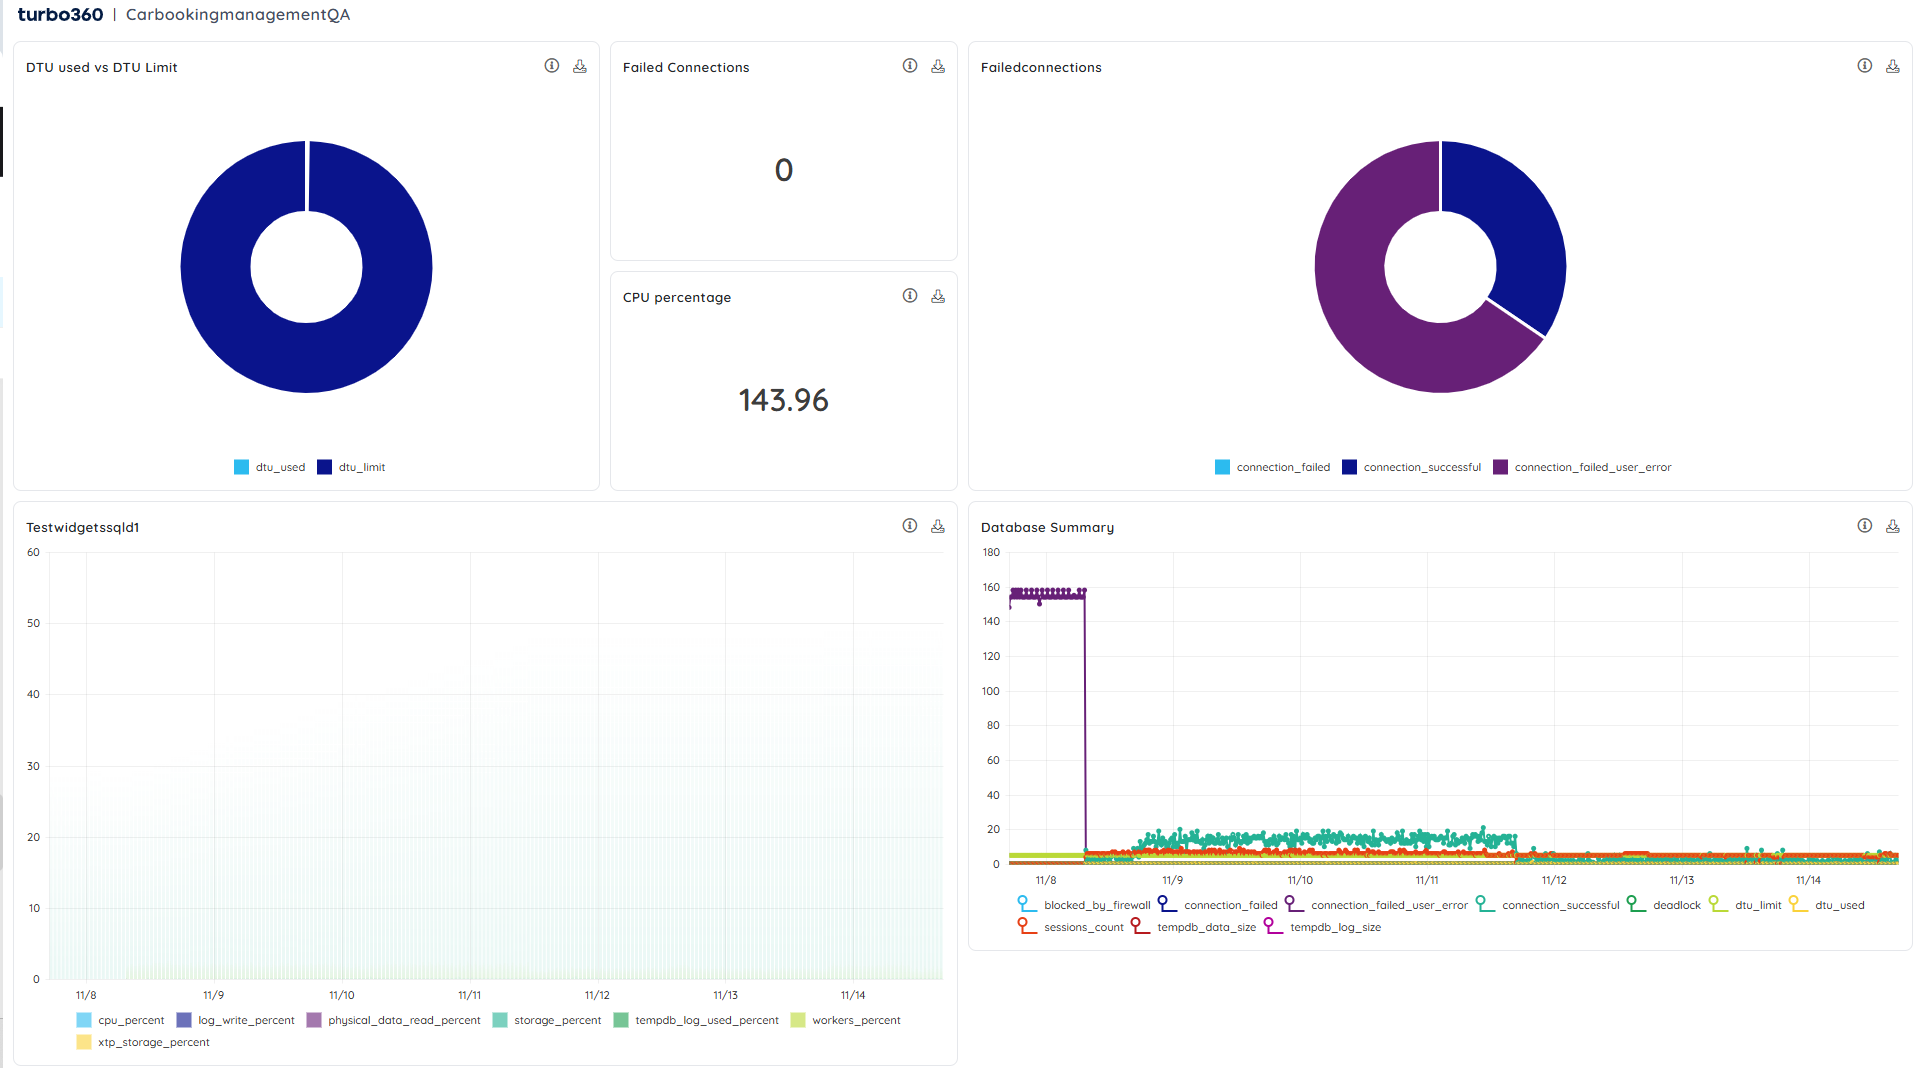
Full-screen mode removes surrounding navigation and expands the dashboard to fill the screen, making it easier to monitor metric status during an incident or review.
- Select the Full screen icon in the dashboard header.
- Press Escape or select the exit icon to return to the standard view.
Zoom in and zoom out
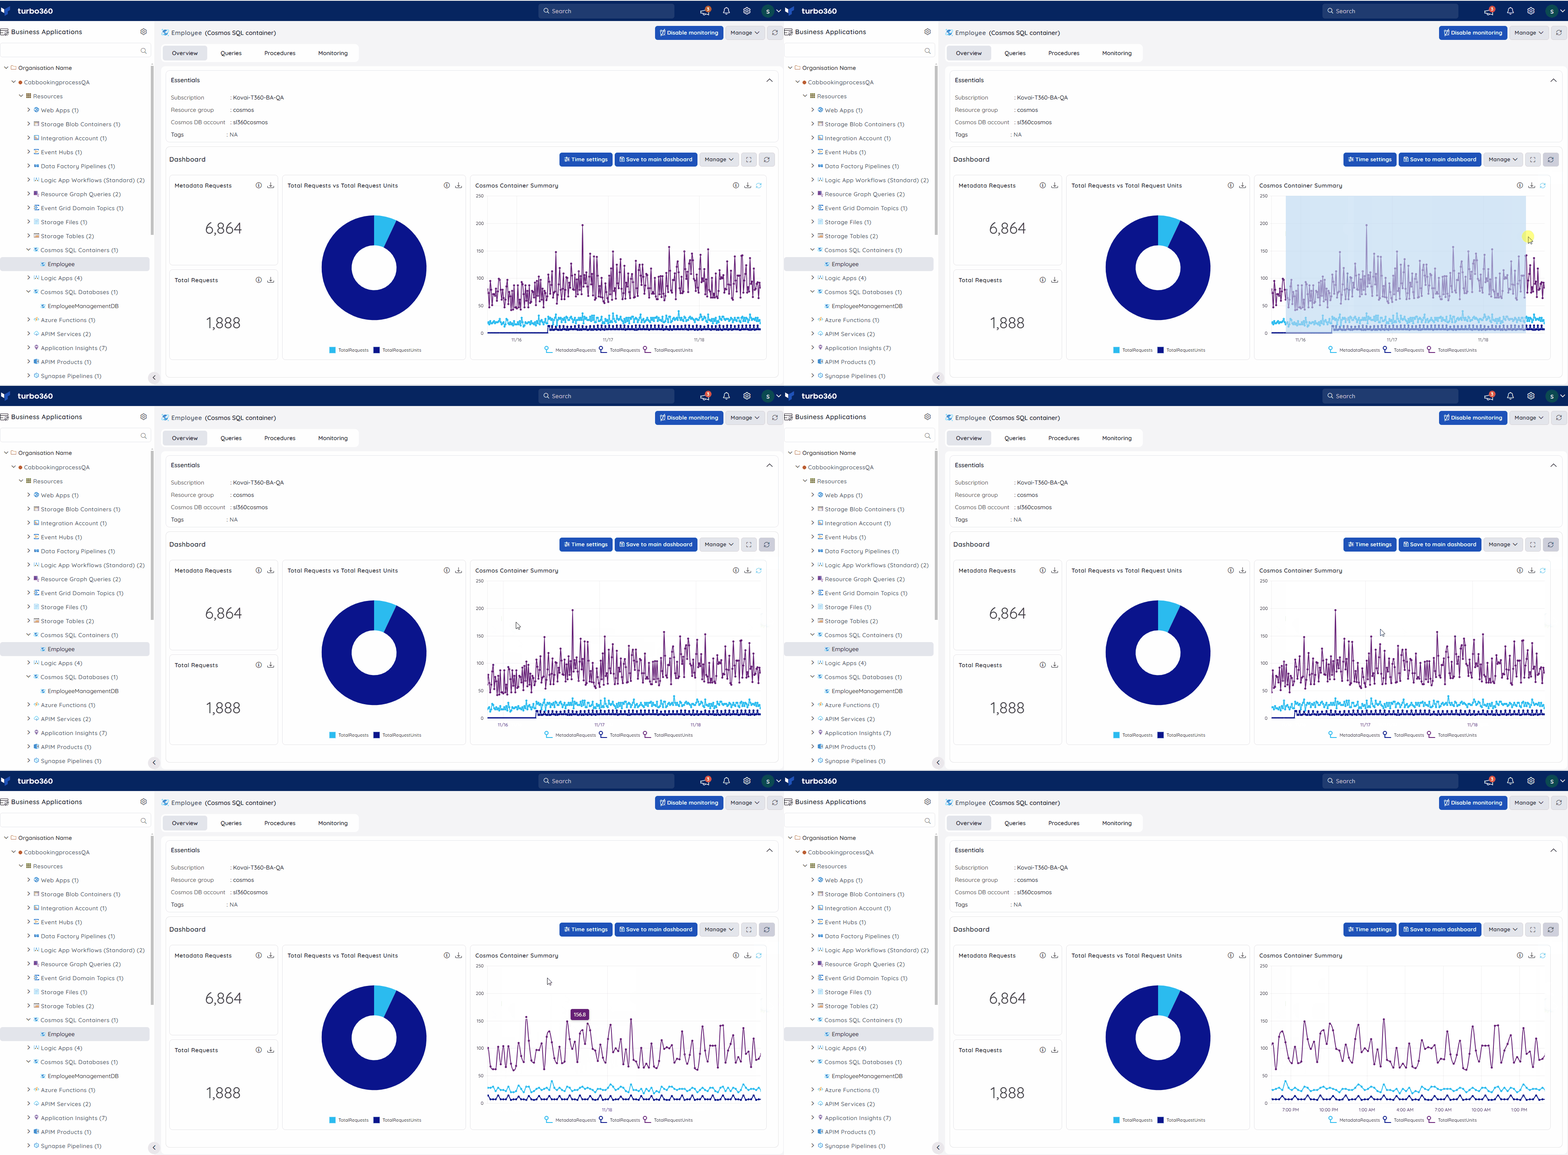
Zooming lets you focus on a specific region of a time-series chart for a more detailed view of the data.
- Click and drag within a chart widget to zoom into the selected time range.
- Select Undo Zoom within the widget to return to the full view.
Download dashboard data
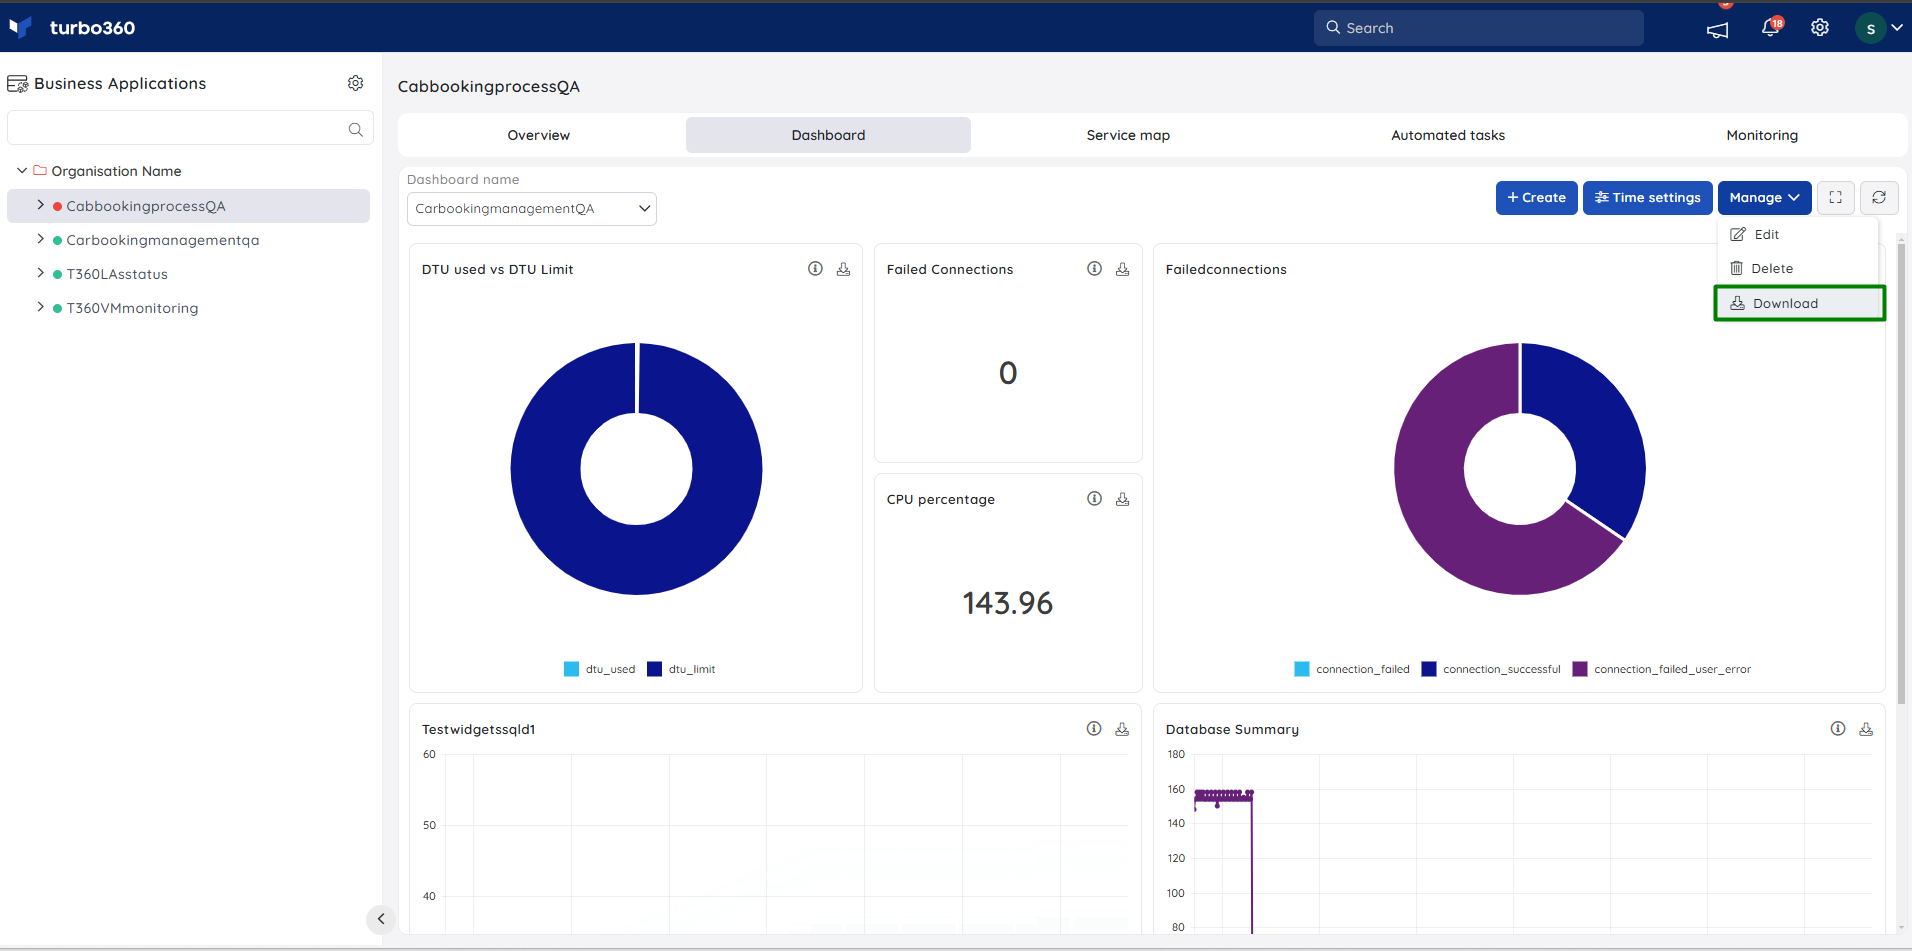
Downloading exports all widget data from the current dashboard as an Excel workbook, with a separate sheet for each widget.
- Select the Download option in the dashboard header.
- Save the generated Excel workbook.
Troubleshooting
Time settings reset after navigating away
Cause: Time settings are per-account session values. They persist for your account but reset when the browser session ends or cache is cleared.
Fix: Re-apply your preferred time settings after each session, or note the values for quick re-entry.Widget cannot be edited — Edit icon is not visible
Cause: The user's role does not have Dashboard Manage permission.
Fix: Assign Dashboard Manage permission to the user's role via User management > Roles.Cannot reorder widgets — drag handle is unresponsive
Cause: The dashboard is in view-only mode due to insufficient permissions, or the browser zoom level is interfering with the drag interaction.
Fix: Confirm Dashboard Manage permission is assigned. Reset browser zoom to 100%.Download produces an empty or incomplete Excel file
Cause: There is no data within the selected time window for one or more widget metrics, or the download was triggered before widgets finished loading.
Fix: Wait for all widgets to load fully, then retry the download. Expand the time range if data is expected but not appearing.Full-screen mode does not exit on Escape
Cause: Browser-level full-screen (F11) may have been activated instead of the dashboard full-screen toggle.
Fix: Press F11 to exit browser full-screen, then use the dashboard's full-screen icon.
Related articles
Was this article helpful?