

Cosmos SQL Database
- 05 Aug 2026
- 3 Minutes to read
- Print
- DarkLight
- Download PDF
Cosmos SQL Database
- Updated on 05 Aug 2026
- 3 Minutes to read
- Print
- DarkLight
- Download PDF
Article summary
Did you find this summary helpful?
Thank you for your feedback!
Overview
Azure Cosmos DB is a fully managed NoSQL database for modern app development. It takes database administration off your hands, with automatic management, updates, and patching. Once a Cosmos SQL Database is associated with a Business Application, it can be monitored and managed from Turbo360.
Business value
Monitoring Cosmos SQL Database availability and metrics from Turbo360 gives you a single place to spot resource health issues, reducing the time to detect and respond to database-level problems.
How it works
- Once associated with a Business Application, the database's health status and performance metrics become directly visible and monitorable from Turbo360.
Permissions
Access to Cosmos SQL Database actions is controlled through RBAC when adding a role to a Business Application.
| Permission | Description |
|---|---|
| Read | View database details and the resource dashboard. |
| Manage | Configure monitoring rules for availability status and metrics. |
Resource dashboard
The Cosmos SQL Database dashboard surfaces request volume and capacity signals so you can spot throttling or unexpected usage spikes without leaving Turbo360.
| Widget | What it shows |
|---|---|
| Metadata Requests | Volume of metadata operations against the database. |
| Total Requests vs Total Request Units | Correlates request count with RU consumption to flag inefficient usage. |
| Cosmos Database Summary | At-a-glance database health and configuration summary. |
| Total Requests | Overall request volume for the database. |
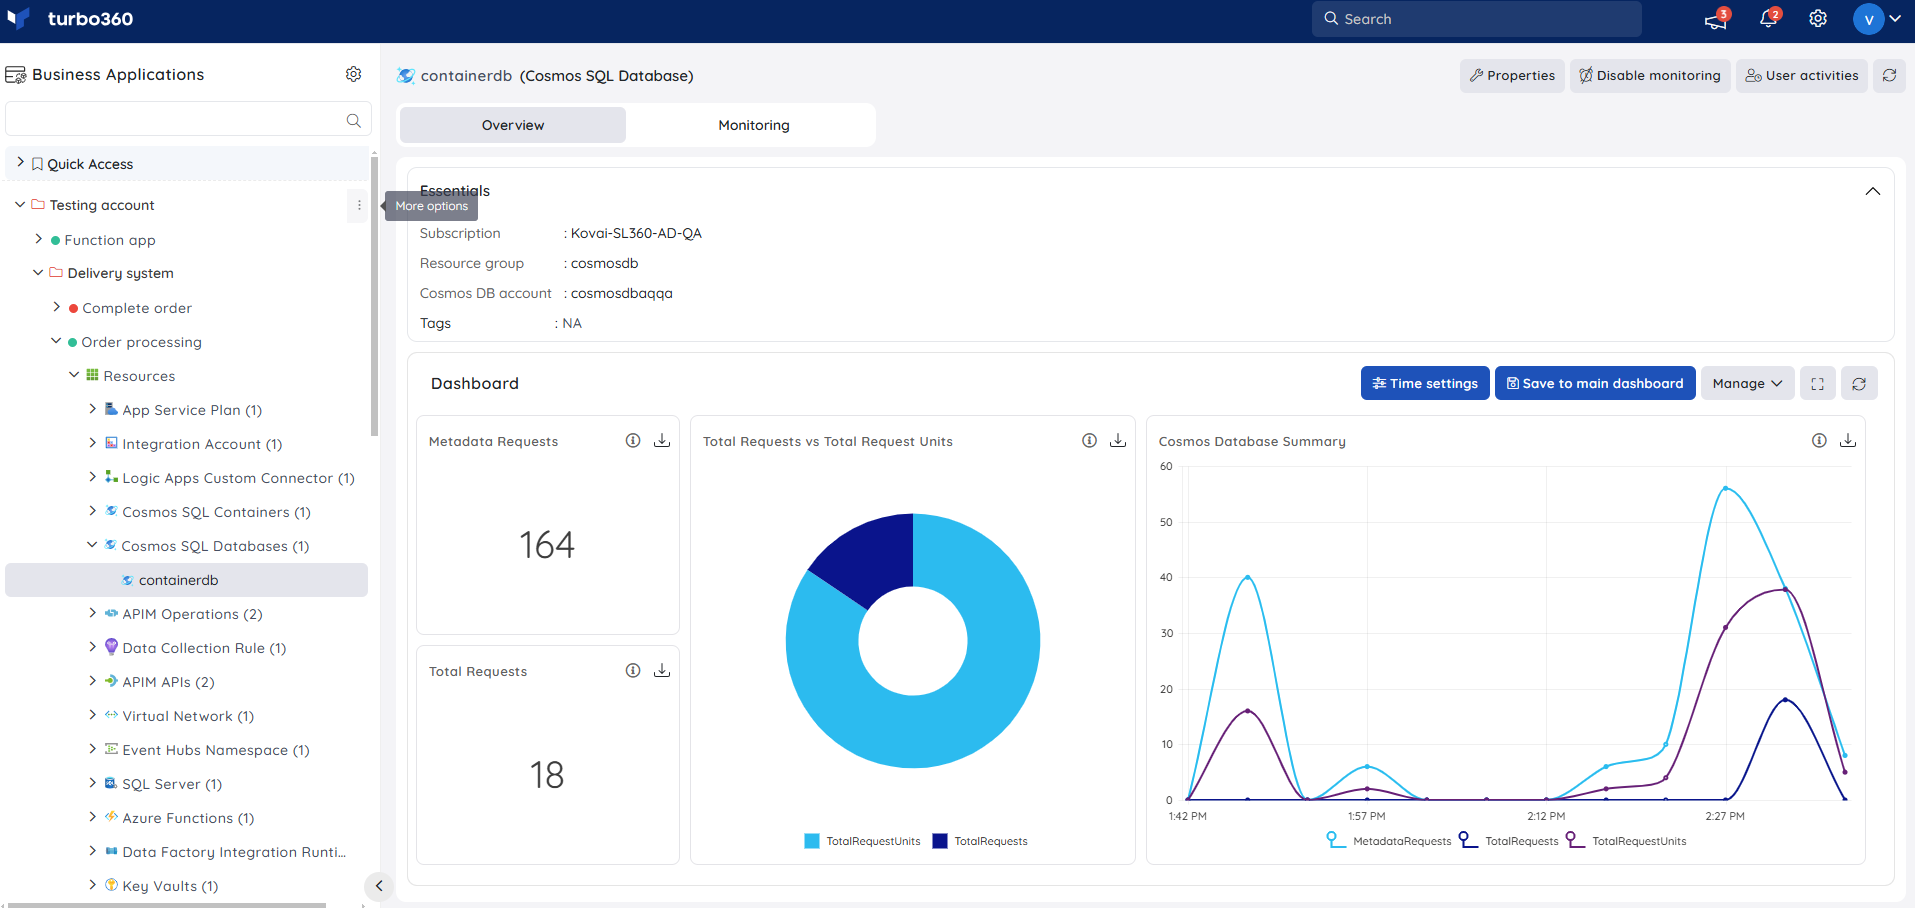
You can add, remove, or reconfigure widgets to focus on the metrics most relevant to your support scenario.
Metrics
The Metrics tab lets you chart any Azure metric for your Cosmos SQL Database directly in Turbo360, without switching to the Azure portal. Use it to track RU consumption across all containers, total request volume, and server-side latency trends — particularly useful when diagnosing whether a throughput bottleneck is at the database level or scoped to a specific container.
Use the following controls to build your chart:
| Control | Description |
|---|---|
| Select metric | Choose the Azure metric to visualize (e.g. Total Request Units, Total Requests, Normalized RU Consumption, Server Side Latency, Data Usage). |
| Aggregation | Set the aggregation method: Average, Min, Max, Total, or Count. |
| Time range | Set the time window for the data (e.g. Last 24 hours, Last 7 days). |
| Granularity | Set the data point resolution (e.g. 1 minute, 1 hour). |
| Chart type | Choose the visualization type: Line or Bar. |
Click Apply to render the chart.
Monitoring
Cosmos SQL Database supports availability status and metric monitoring rules, configured under Cosmos SQL Database -> Monitoring.
Monitoring rules are saved per resource, and the monitoring state is reflected after every monitoring cycle.
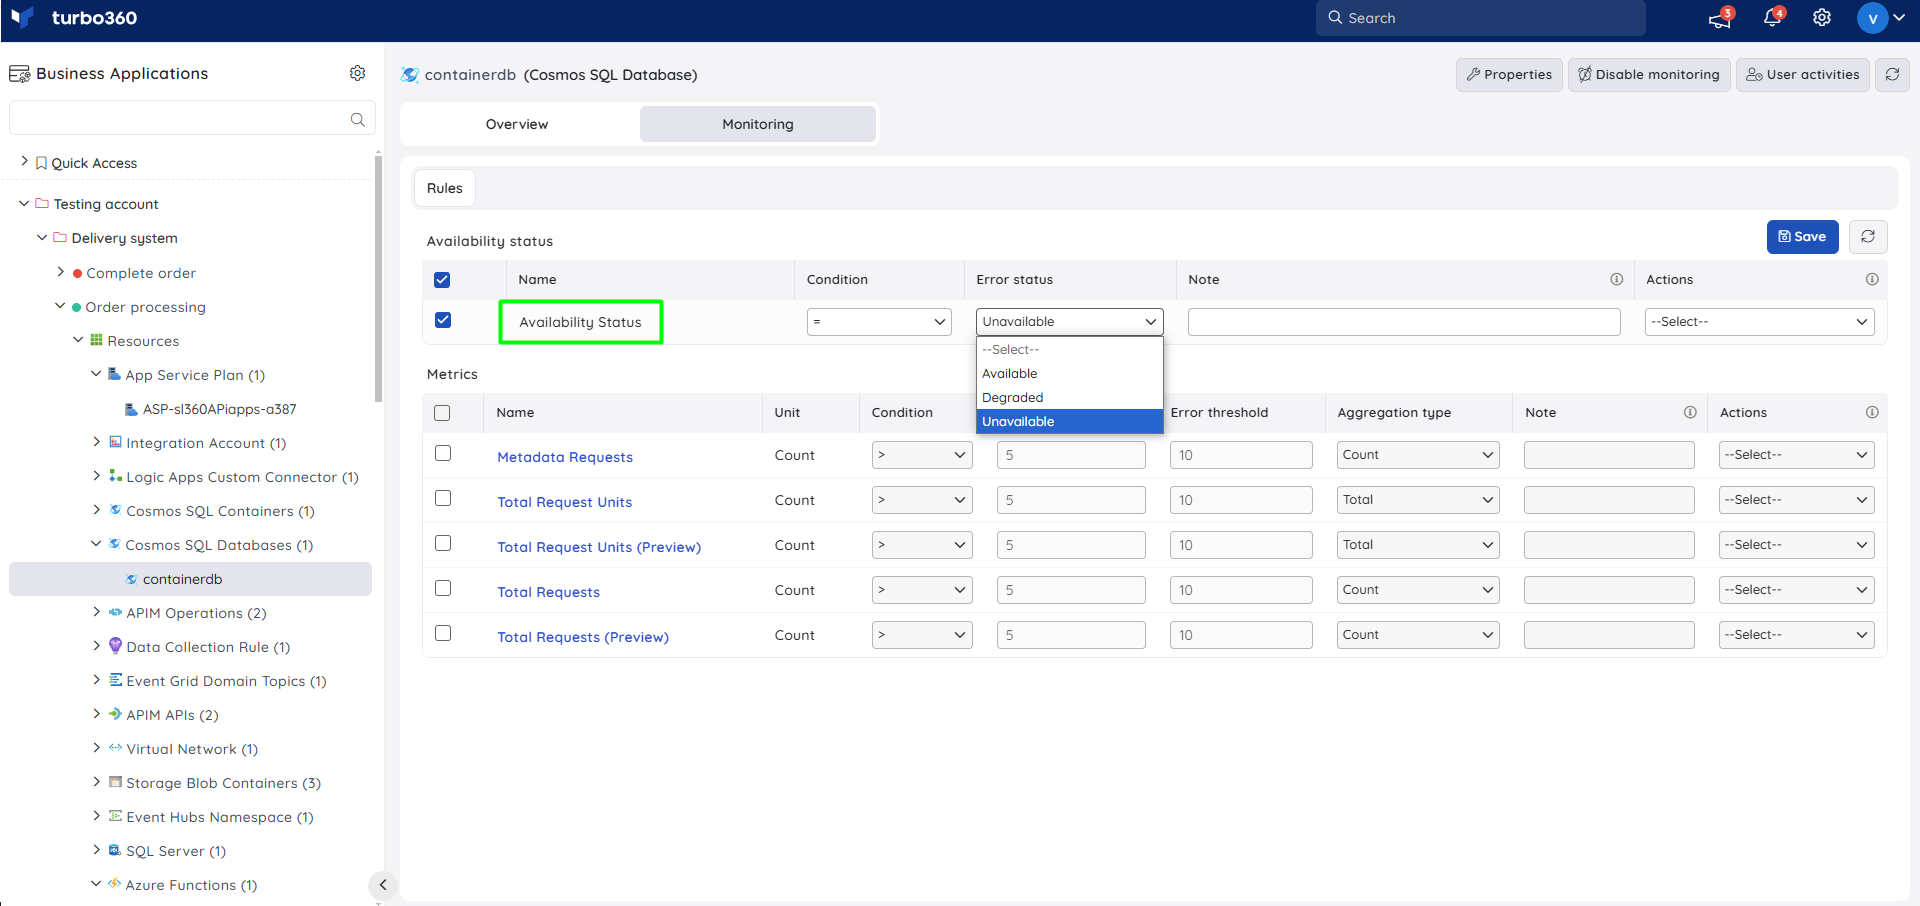
Availability status monitoring
Tracks the resource health status of the Cosmos SQL Database. Use this when you need to be alerted as soon as the database becomes unavailable or degraded.
- Navigate to Cosmos SQL Database -> Monitoring.
- Configure the Availability status rule with the desired status.
- Click Save.
Metric monitoring
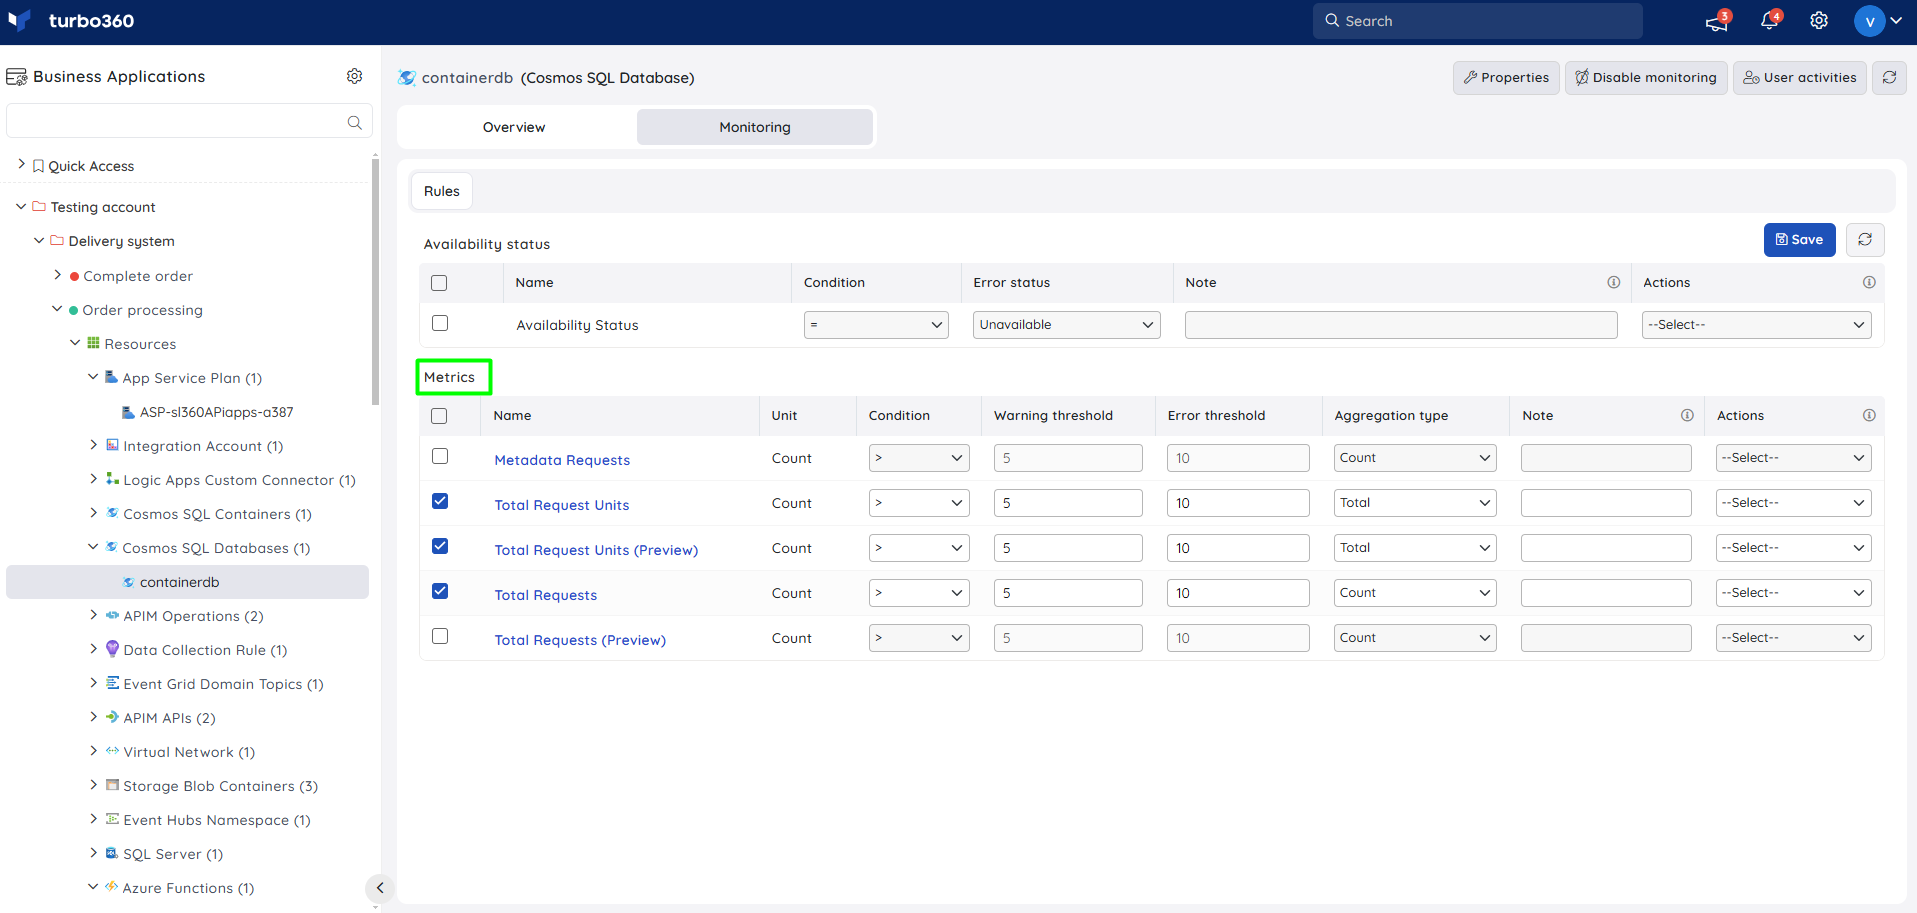
Tracks resource metrics against a configured threshold. Use this when you need to be alerted if RU consumption or another metric exceeds expected bounds.
- Navigate to Cosmos SQL Database -> Monitoring.
- Select the required metrics and configure the threshold values.
- Click Save.
The threshold values can be provided with any metric name; the rule is violated when the configured threshold value is met.
Troubleshooting
- Availability status rule does not trigger
Cause: The rule was saved before the database completed its first monitoring cycle.
Fix: Wait for the next monitoring cycle, then verify the rule status. - Metric monitoring rule does not trigger
Cause: The configured threshold does not match the metric's actual reporting unit.
Fix: Review the metric definition and adjust the threshold value accordingly. - Dashboard widgets show no data
Cause: The database was recently associated and has not completed its first monitoring cycle.
Fix: Wait for the next monitoring cycle, then refresh the dashboard. - Monitoring state appears stale
Cause: The displayed state reflects the last completed monitoring cycle, not real time.
Fix: Allow the next monitoring cycle to complete before re-checking the state.
Related articles
Was this article helpful?