

Cosmos Table
- 05 Aug 2026
- 3 Minutes to read
- Print
- DarkLight
- Download PDF
Cosmos Table
- Updated on 05 Aug 2026
- 3 Minutes to read
- Print
- DarkLight
- Download PDF
Article summary
Did you find this summary helpful?
Thank you for your feedback!
Overview
Azure Cosmos DB provides the Table API (Table storage), designed to support cloud-scale applications that can contain billions of entities ("rows" in relational database terminology), or datasets that must support high transaction volumes. Once a Cosmos Table is associated with a Business Application, it can be managed from Turbo360.
Business value
Managing Cosmos Table entities from Turbo360 removes the need to switch to a separate database tool, letting you query, update, and clean up table data directly during operational tasks.
How it works
- Once associated with a Business Application, the table's entities become directly queryable and manageable from Turbo360.
Permissions
Access to Cosmos Table actions is controlled through RBAC when adding a role to a Business Application.
| Permission | Description |
|---|---|
| Read | View table details and execute queries against entities. |
| Manage | Update or delete entities, including bulk deletion. |
Operations
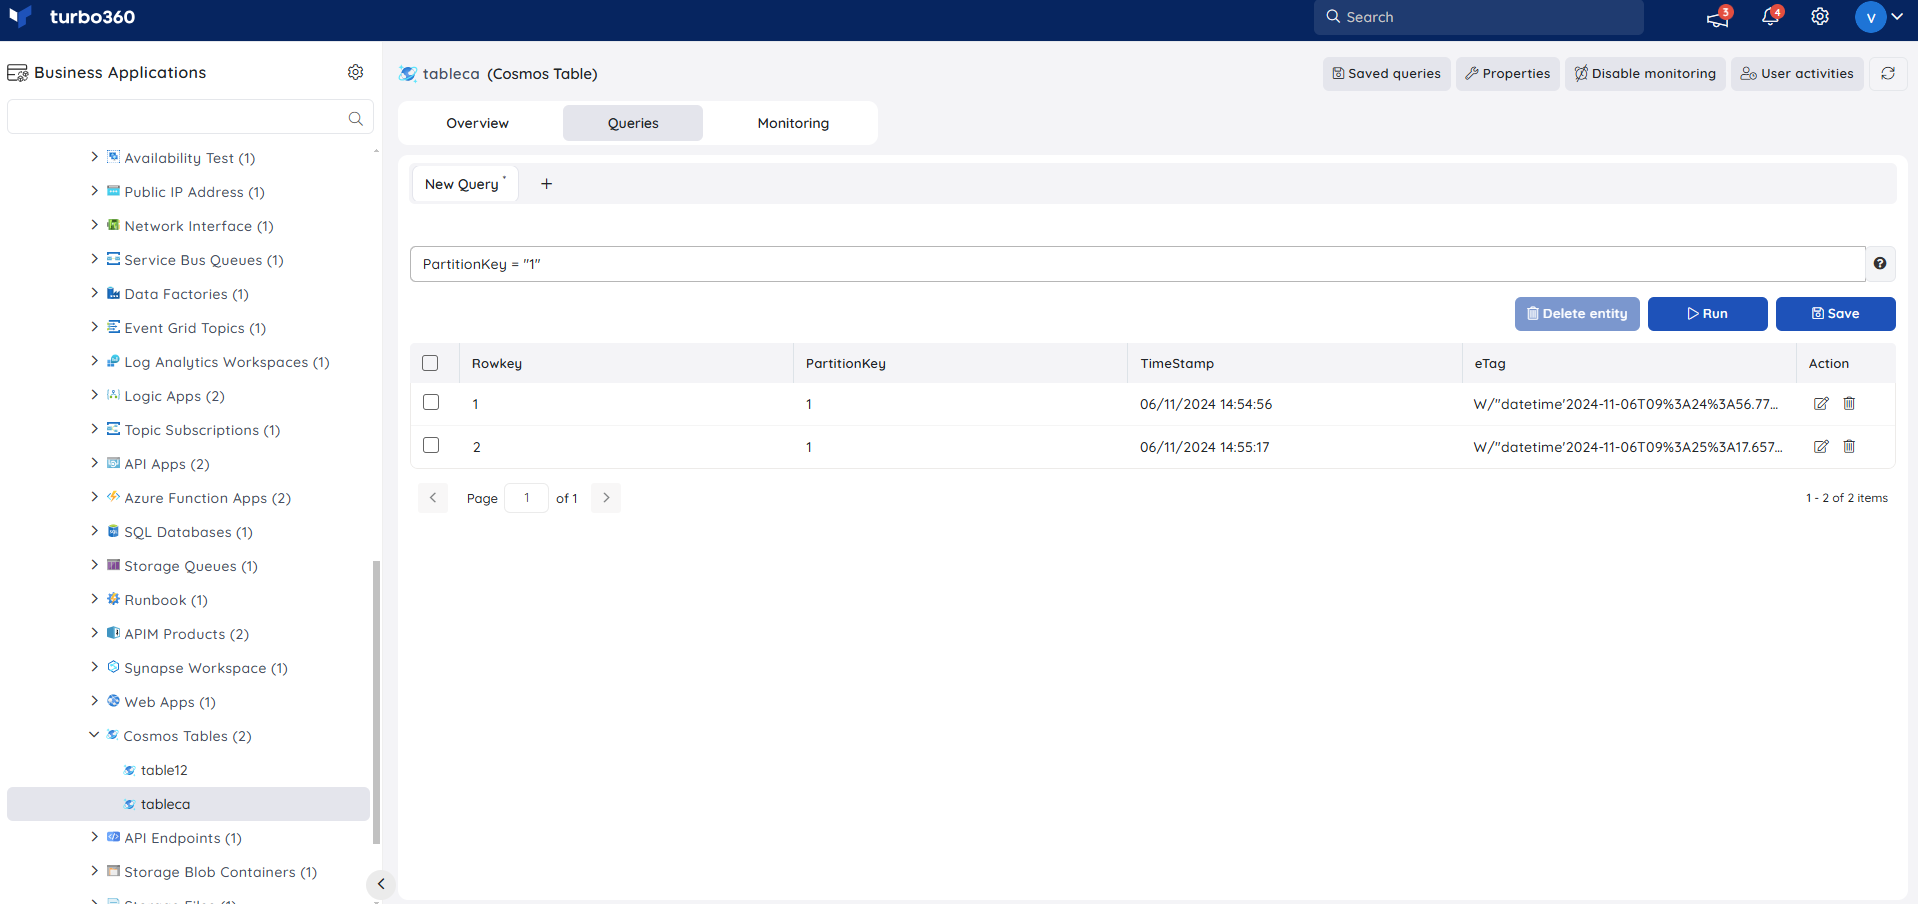
Turbo360 lets you query and manage Cosmos Table entities directly from the resource, without switching to a separate database tool.
Managing entities
- Query entities — retrieve table entities by executing a query. Use this when you need to inspect data without opening a separate database client.
- Update entity — edit an entity returned from a query. Use this when a single record needs correction.
- Delete entity — remove an entity returned from a query. Use this when a single record needs to be removed.
Bulk operations
- Bulk delete — delete multiple entities returned from a query in a single action. Use this when cleaning up a large batch of stale or invalid records rather than deleting entities one at a time.
Resource dashboard
The Cosmos Table dashboard surfaces request volume and capacity signals so you can spot throttling or unexpected usage spikes without leaving Turbo360.
| Widget | What it shows |
|---|---|
| Metadata Requests | Volume of metadata operations against the table. |
| Total Requests vs Total Request Units | Correlates request count with RU consumption to flag inefficient queries. |
| Cosmos Table Summary | At-a-glance table health and configuration summary. |
| Total Requests | Overall request volume for the table. |
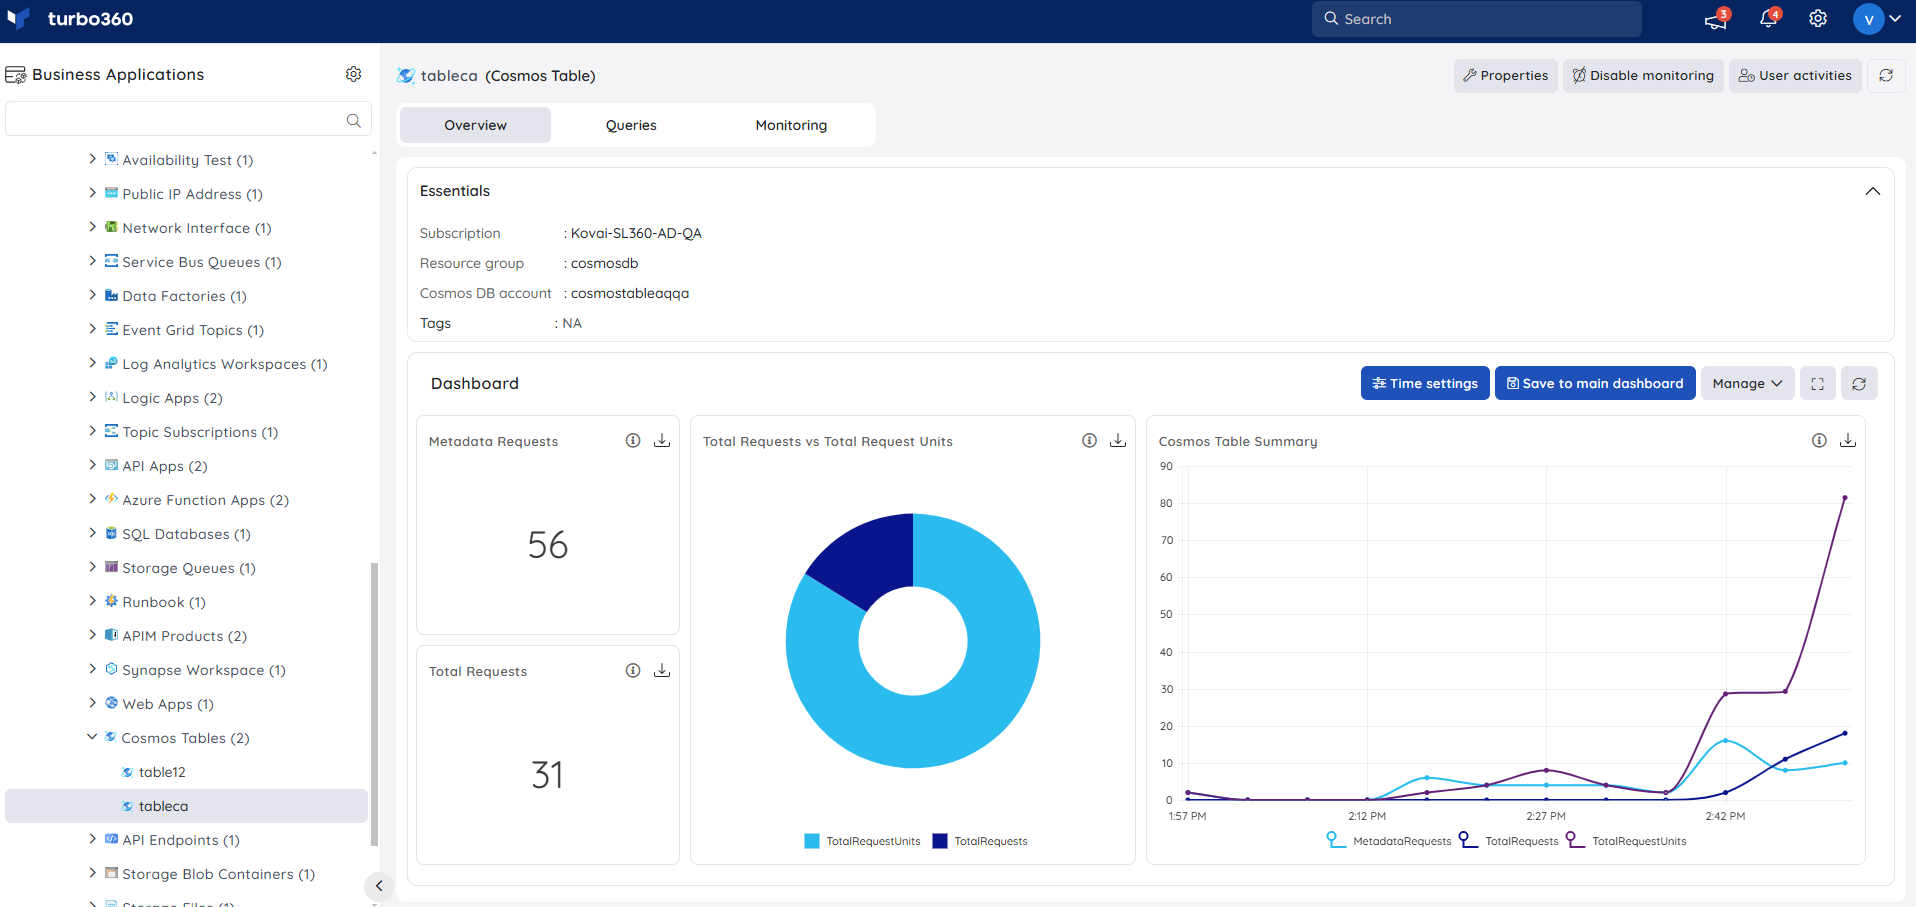
You can add, remove, or reconfigure widgets to focus on the metrics most relevant to your support scenario.
Metrics
The Metrics tab lets you chart any Azure metric for your Cosmos Table directly in Turbo360, without switching to the Azure portal. Use it to track RU consumption per table operation, request throughput, and throttled request rates — useful for identifying whether read/write patterns from specific application workloads are exhausting provisioned capacity.
Use the following controls to build your chart:
| Control | Description |
|---|---|
| Select metric | Choose the Azure metric to visualize (e.g. Total Request Units, Total Requests, Normalized RU Consumption, Server Side Latency, Throttled Requests). |
| Aggregation | Set the aggregation method: Average, Min, Max, Total, or Count. |
| Time range | Set the time window for the data (e.g. Last 24 hours, Last 7 days). |
| Granularity | Set the data point resolution (e.g. 1 minute, 1 hour). |
| Chart type | Choose the visualization type: Line or Bar. |
Click Apply to render the chart.
Monitoring
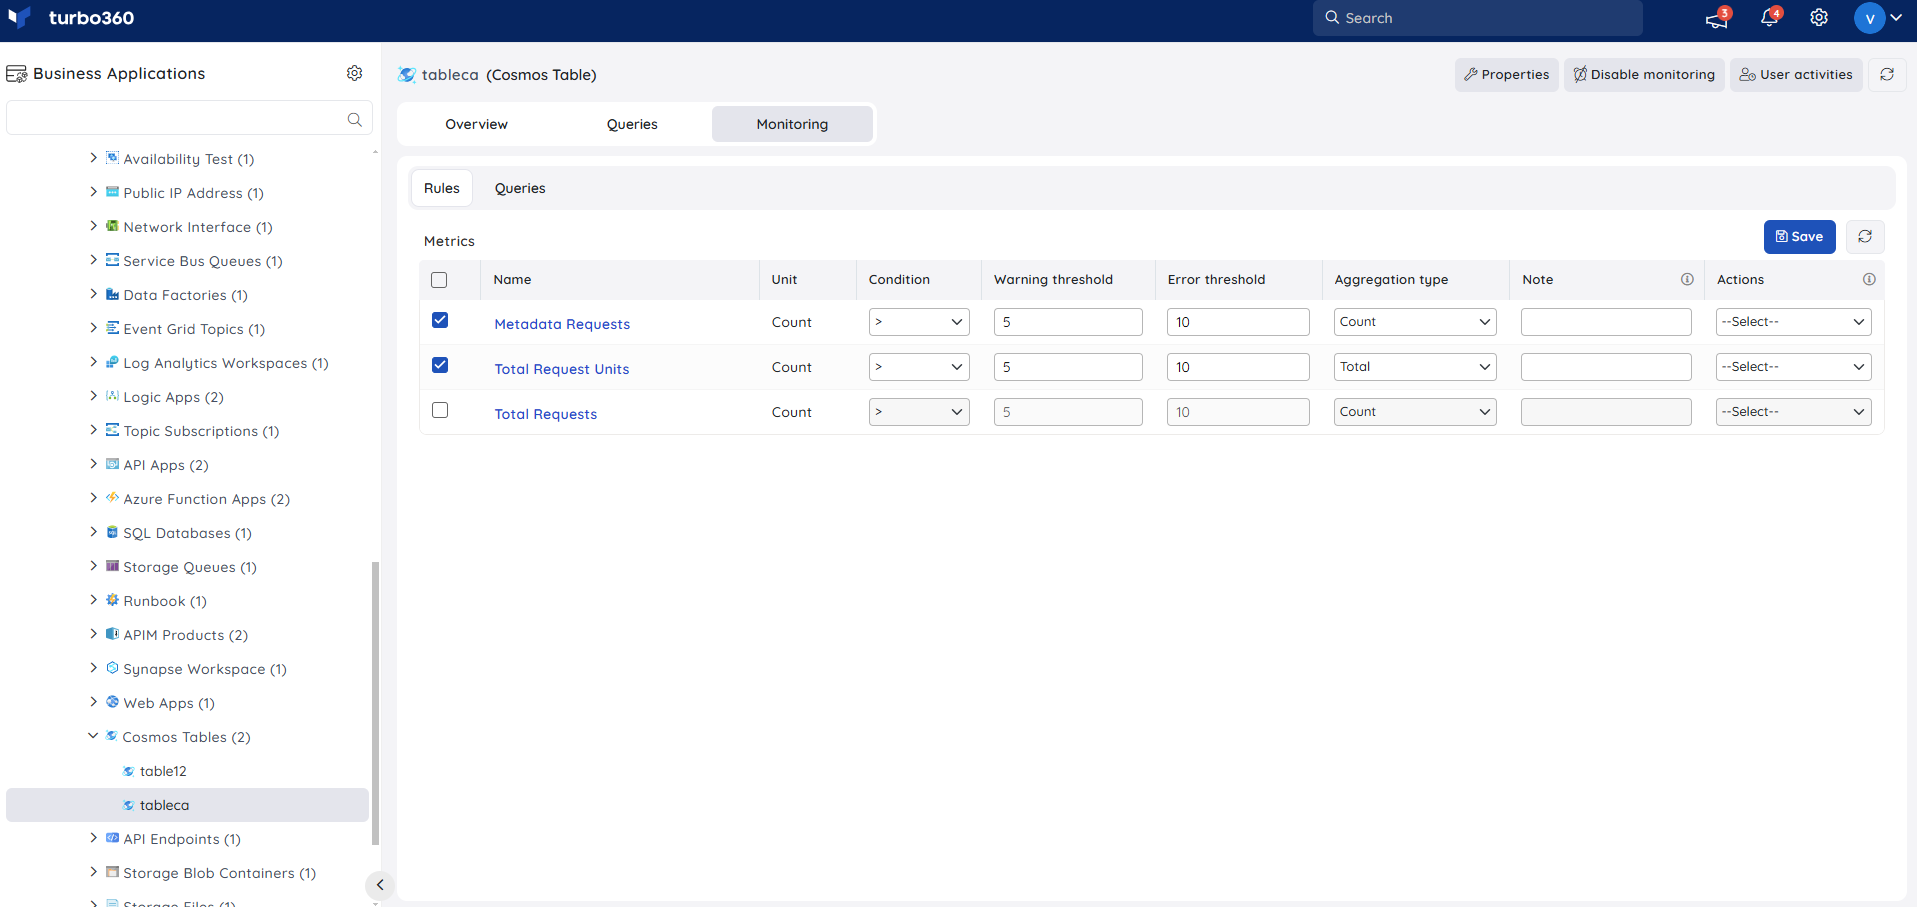
Cosmos Table supports metric and query monitoring rules, configured under Cosmos Table -> Monitoring.
Monitoring rules are saved per resource, and the monitoring state is reflected after every monitoring cycle.
Metric monitoring
Tracks resource metrics against a configured threshold. Use this when you need to be alerted if RU consumption or another metric exceeds expected bounds.
- Switch to the Rules tab.
- Select the necessary monitoring metrics and configure the threshold values.
- Click Save.
The threshold values can be provided with any metric name; the rule is violated when the configured threshold value is met.
Query monitoring
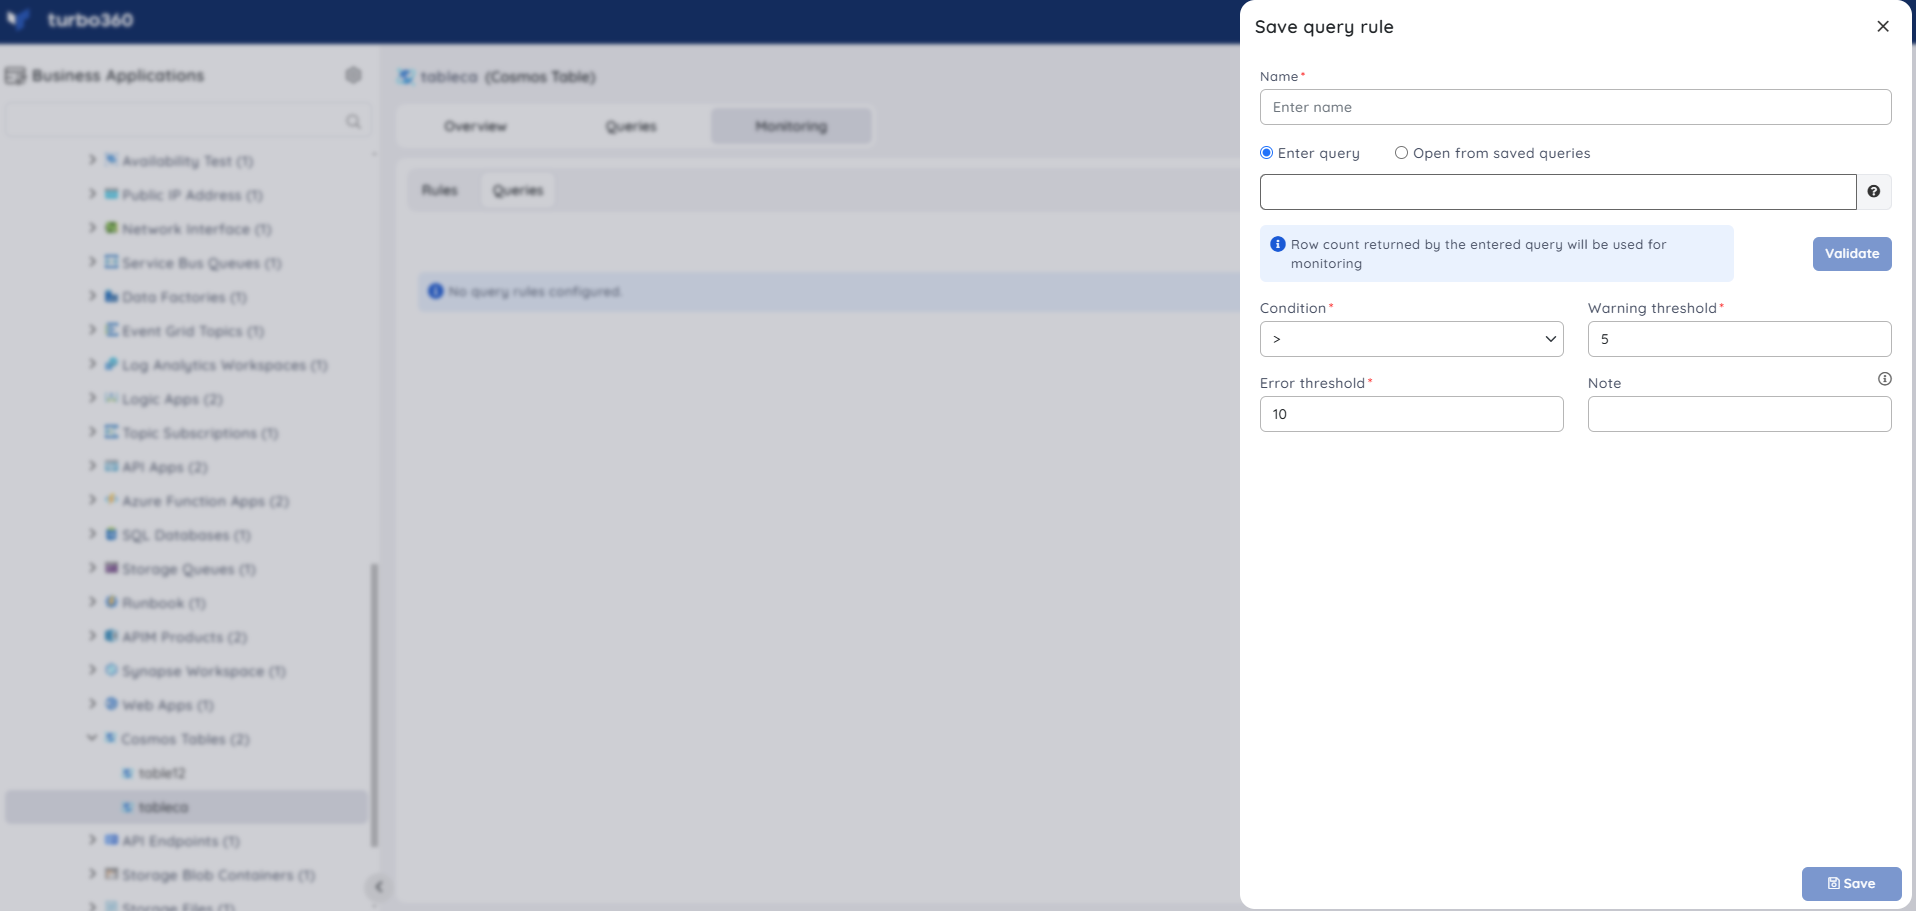
Tracks the result of a saved or custom query against a threshold. Use this when a specific query result, such as a record count, needs to trigger an alert.
- Switch to the Queries tab.
- Click Add.
- Enter a name for the query rule.
- Enter the desired query, or select one from saved queries using Open from saved queries.
- Click Validate to validate the query.
- Click Save.
Troubleshooting
- Query monitoring rule does not trigger
Cause: The query was not validated before saving.
Fix: Reopen the rule, click Validate, and save again. - Entity update or delete not reflected
Cause: The query results were not refreshed after the change.
Fix: Re-run the query to fetch the latest entity state. - Bulk delete only removes some entities
Cause: The query results changed between selection and deletion.
Fix: Re-run the query and retry the bulk delete on the refreshed result set. - Dashboard widgets show no data
Cause: The table was recently associated and has not completed its first monitoring cycle.
Fix: Wait for the next monitoring cycle, then refresh the dashboard.
Related articles
Was this article helpful?