

Data Factory
- 05 Aug 2026
- 4 Minutes to read
- Print
- DarkLight
- Download PDF
Data Factory
- Updated on 05 Aug 2026
- 4 Minutes to read
- Print
- DarkLight
- Download PDF
Article summary
Did you find this summary helpful?
Thank you for your feedback!
Overview
Data Factory is a cloud-based data integration service that lets you build data-driven workflows to orchestrate and automate the movement and transformation of data. Once a Data Factory resource is associated with a Turbo360 Business Application, you can manage its triggers, monitor activity, and track integration runtimes directly from Turbo360.
Business value
Managing triggers, monitoring runs, and tracking integration runtime health from Turbo360 removes the need to switch between the Azure portal and your operations console, helping you respond to pipeline failures faster.
How it works
- Turbo360 surfaces all triggers configured for the Data Factory resource, along with their run history and status.
- Trigger runs can be filtered by status to quickly isolate failures or pending runs.
- Linked integration runtimes are listed with their current status, so you can confirm compute availability before troubleshooting pipeline issues.
Permissions
Access to Data Factory actions in Turbo360 is controlled through role-based access control (RBAC). When adding a role, enable the Data Factory resource type and assign one or both of the following permission levels:
| Permission | Grants |
|---|---|
| Read | View triggers, trigger runs, integration runtimes, and the resource dashboard. |
| Manage | Start and stop triggers, in addition to all Read capabilities. |
Operations
Turbo360 lets you start and stop Data Factory triggers directly, so you can manage trigger state without switching to the Azure portal during incident response or planned maintenance.
Start and stop triggers
- Start trigger — activates a stopped trigger. Use this when a trigger was paused and pipeline runs need to resume.
- Stop trigger — deactivates a running trigger. Use this when you need to pause scheduled runs, for example during a maintenance window.
- Open the Data Factory resource and go to Triggers.
- Select the trigger, then click Start or Stop.
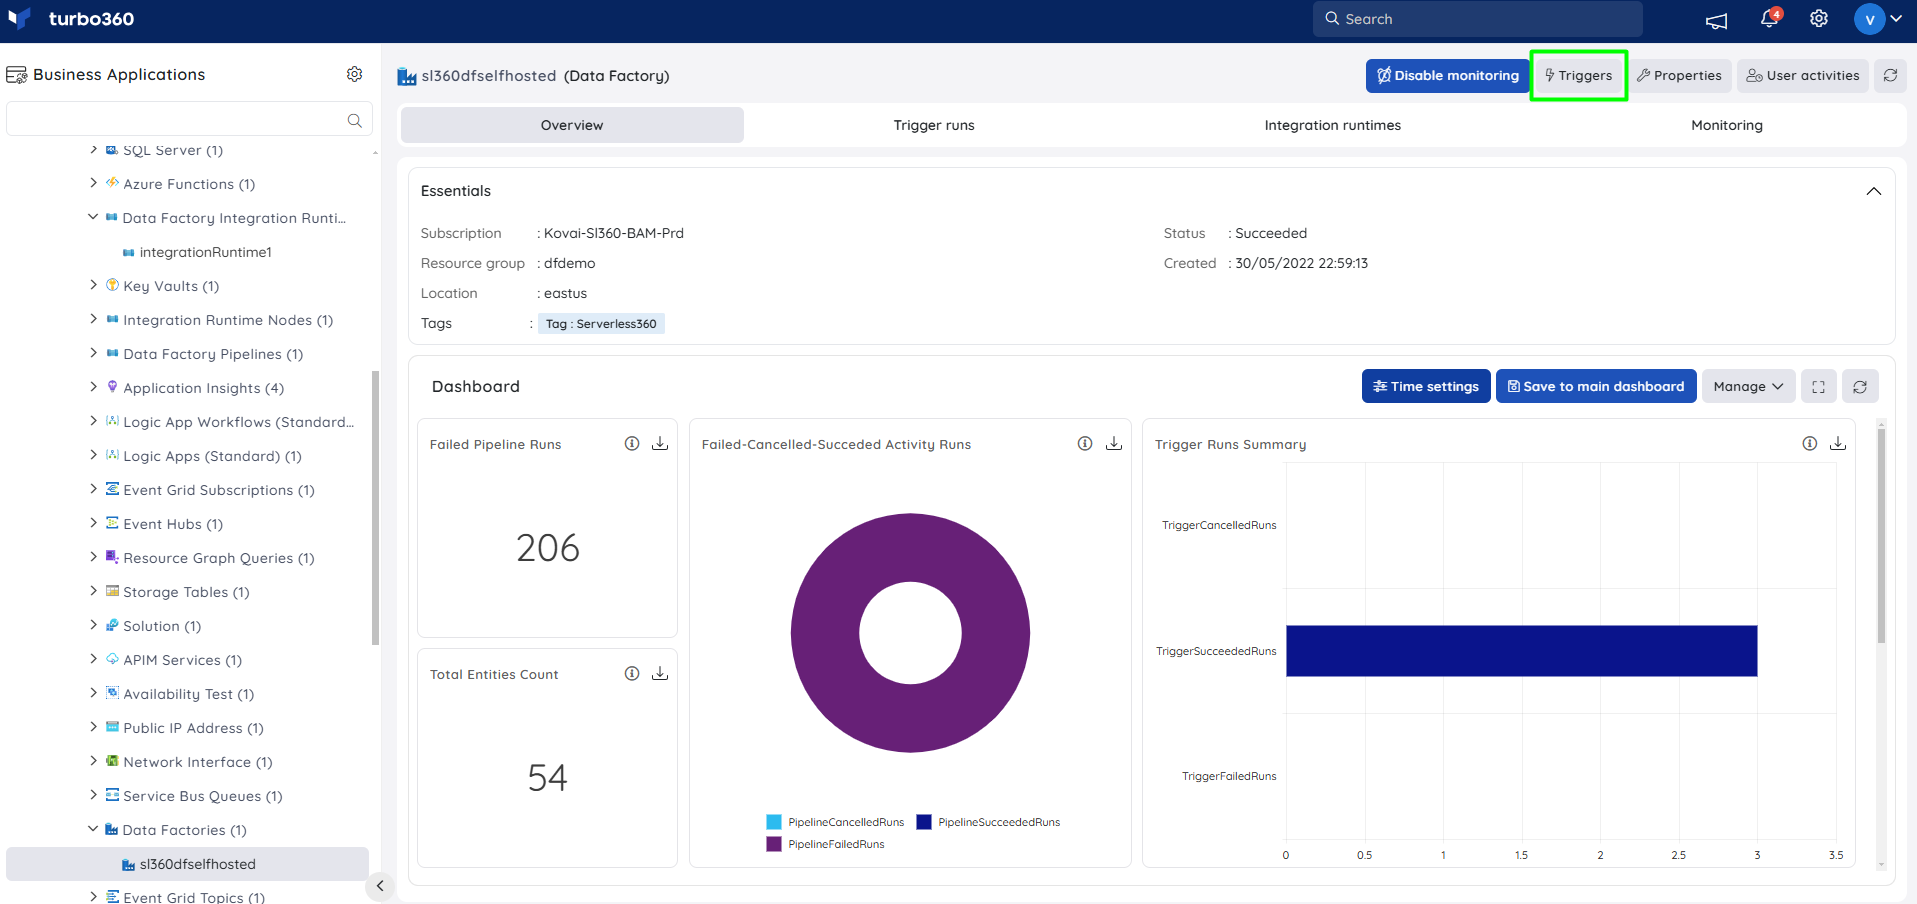
Click a trigger to view its details, including description, end time, and annotation when available in the Azure portal.
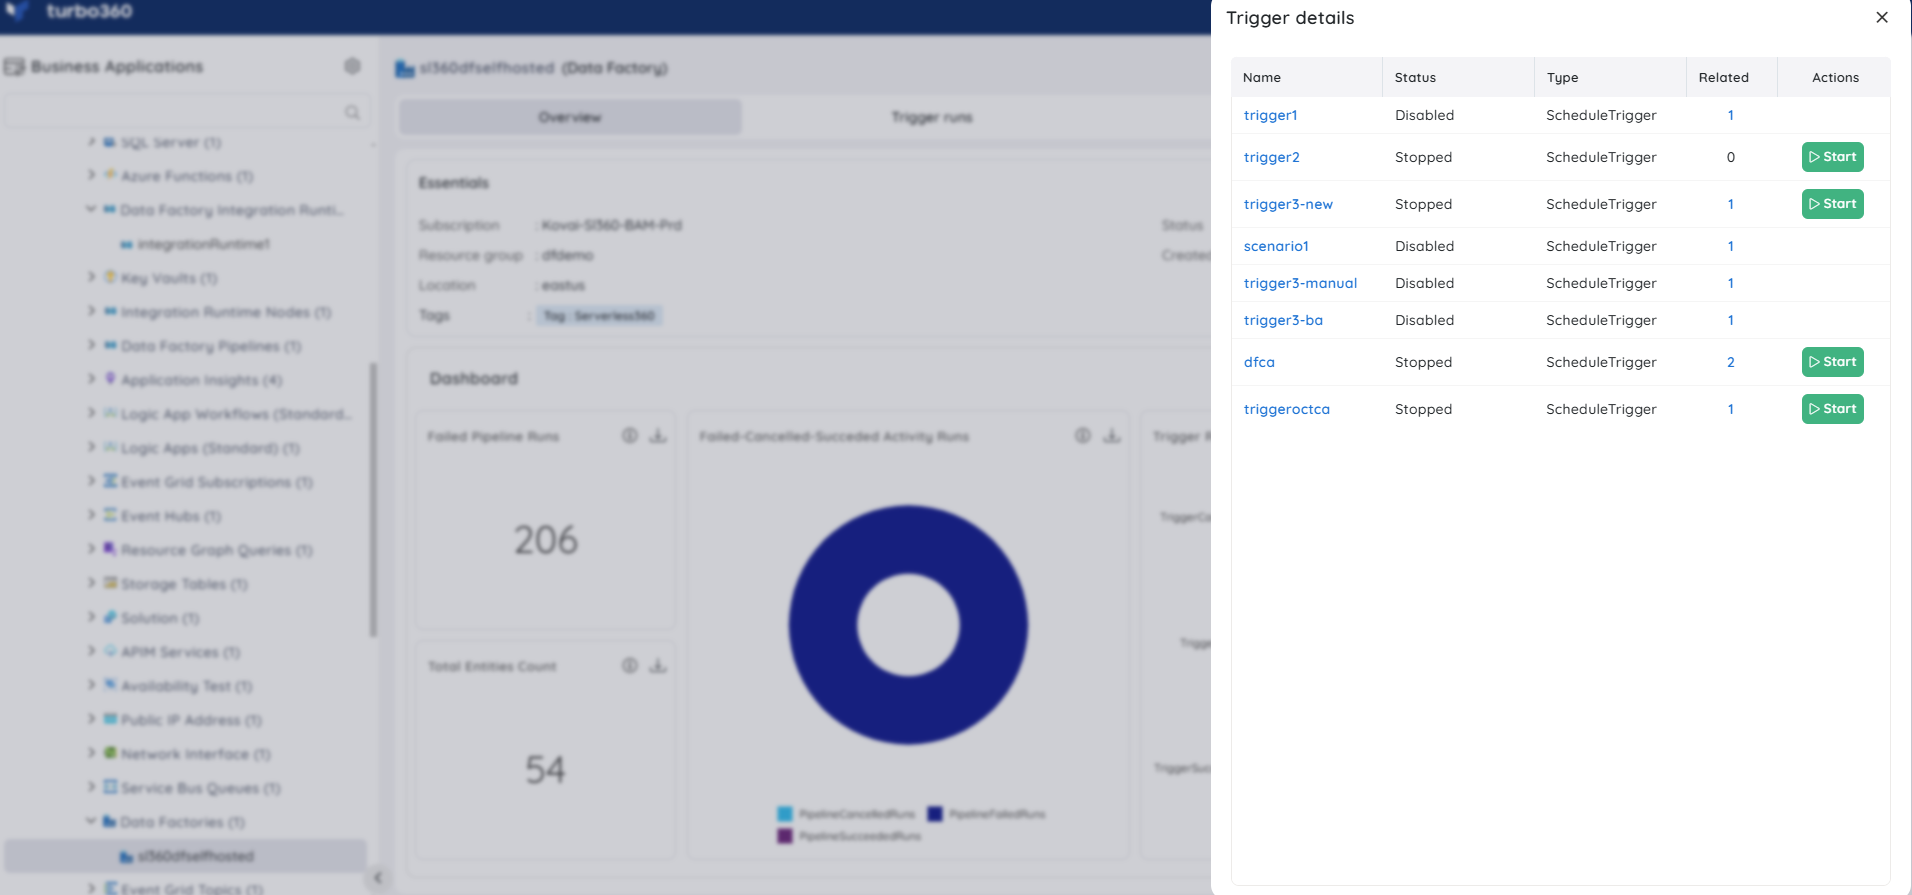
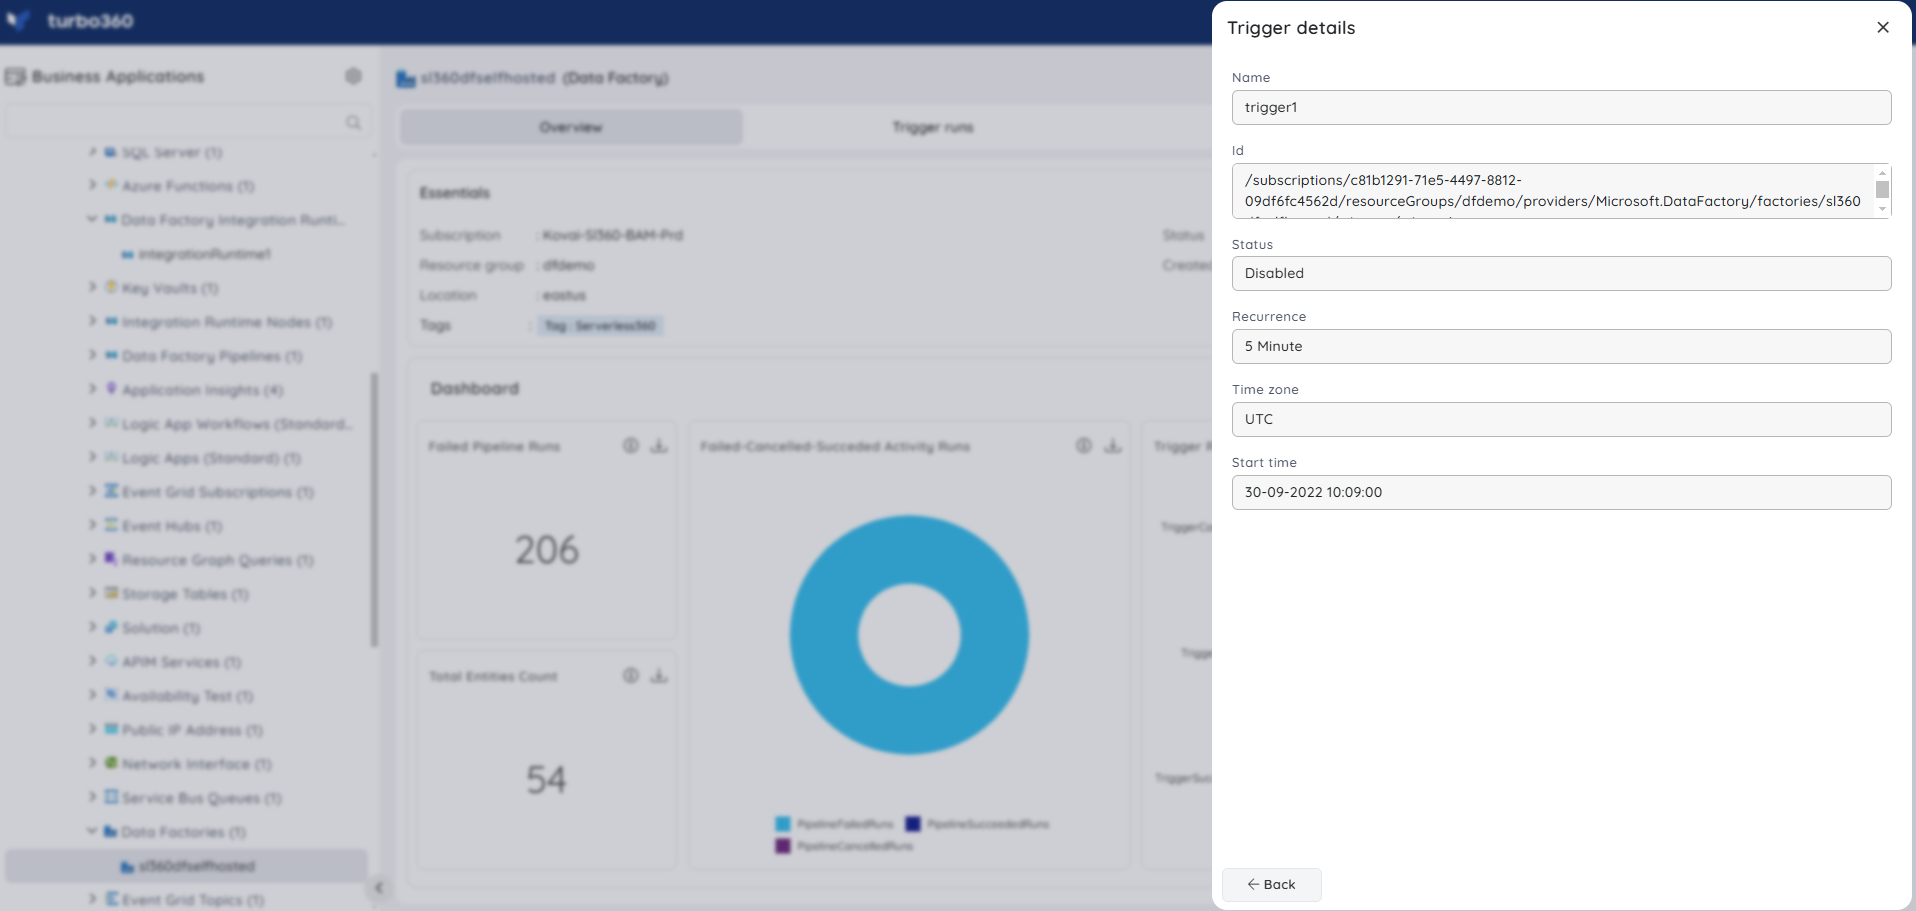
Field values such as Description, End Time, and Annotation are displayed in trigger details only when available in the Azure portal.
Trigger runs
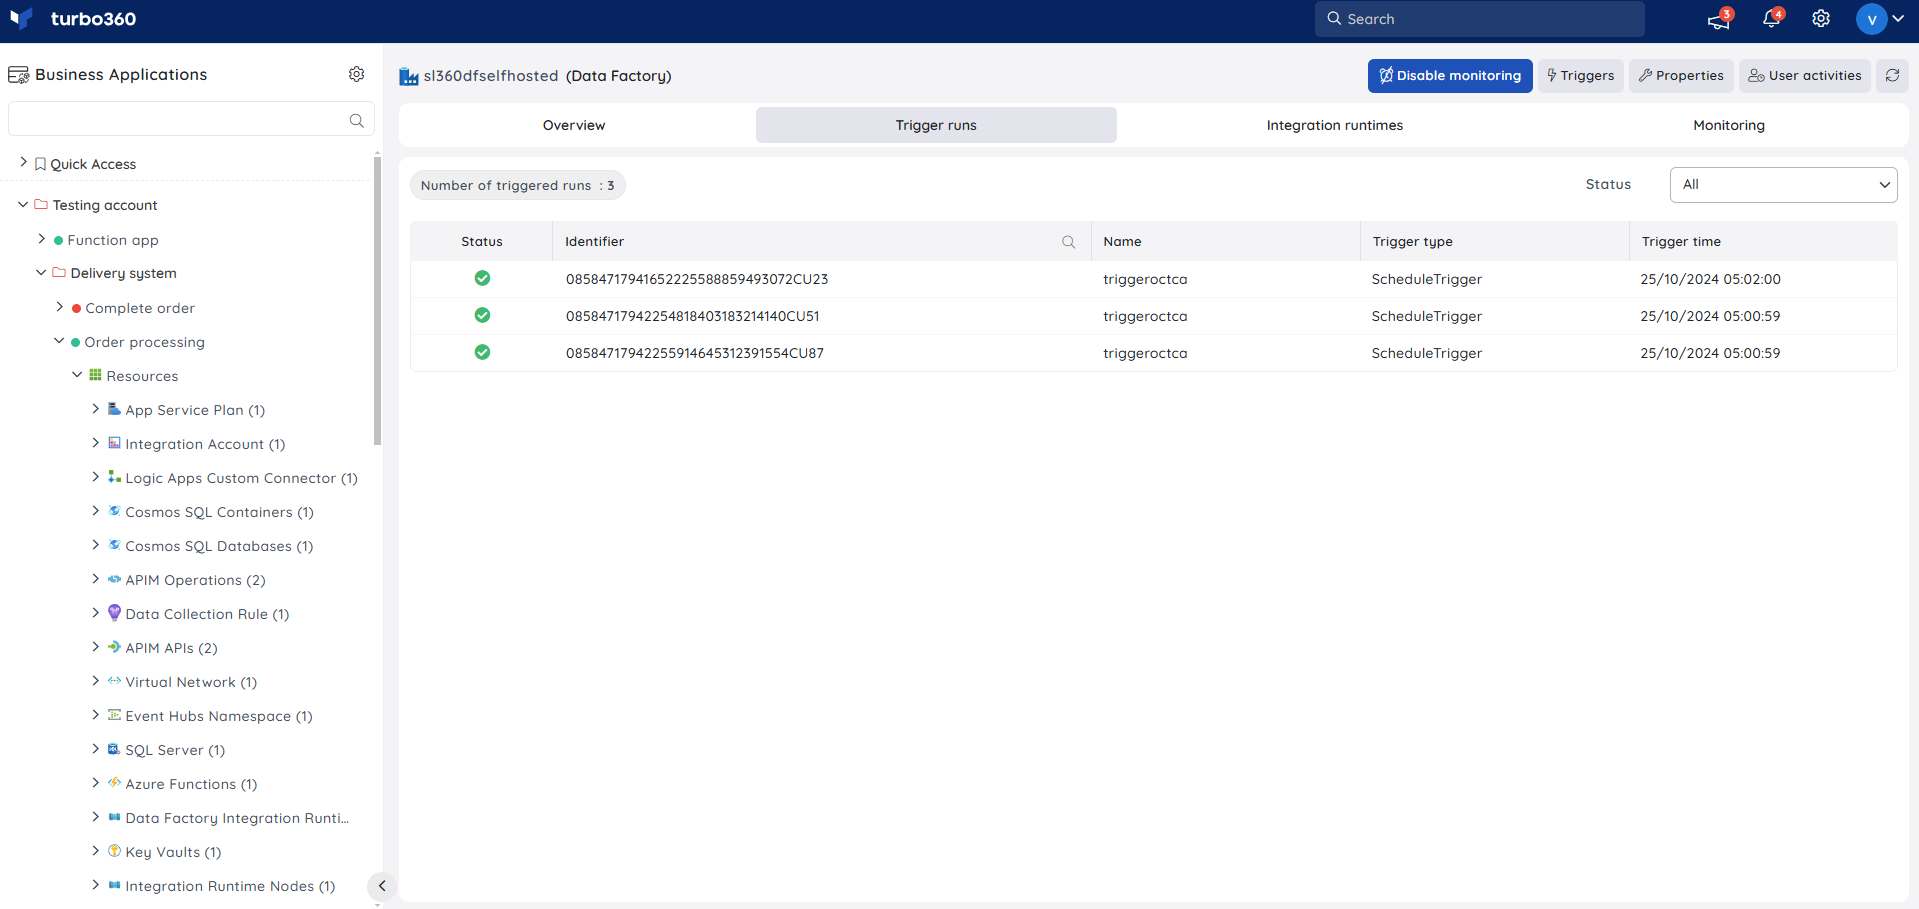
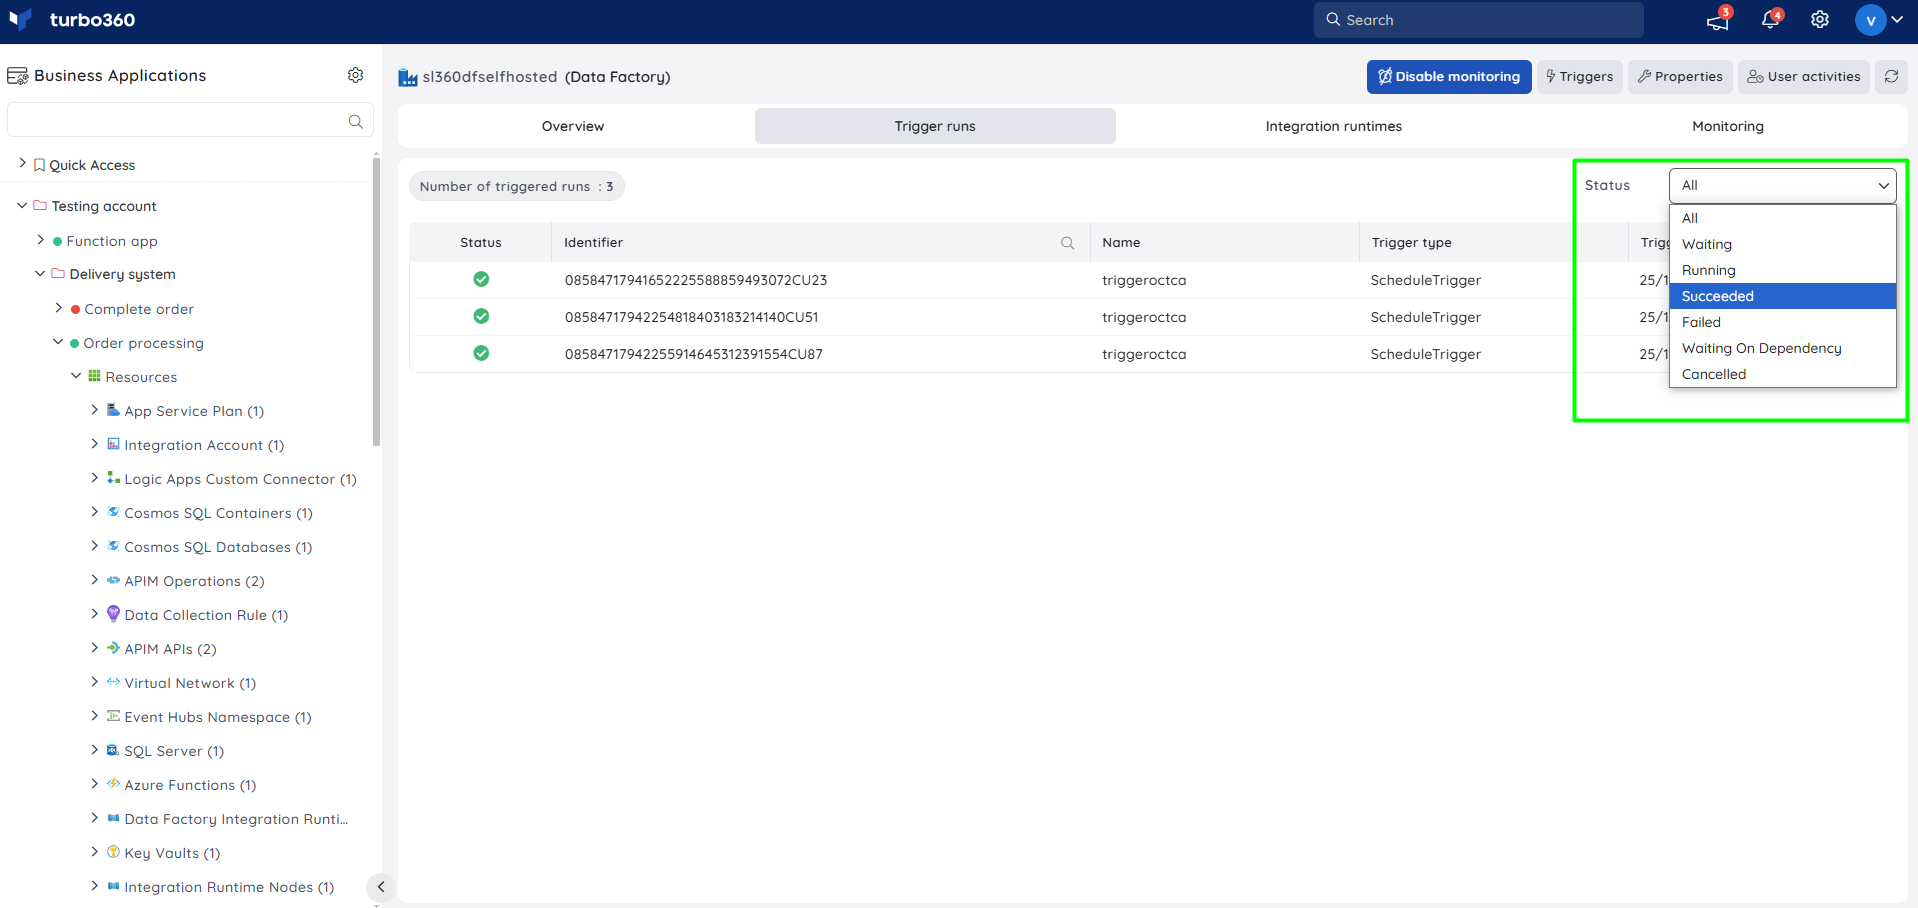
View all trigger runs, including the trigger type and execution time, and filter them by status: Waiting, Running, Succeeded, Failed, Waiting on Dependency, or Cancelled. Use this when investigating why a pipeline didn't run as expected.
Integration runtimes
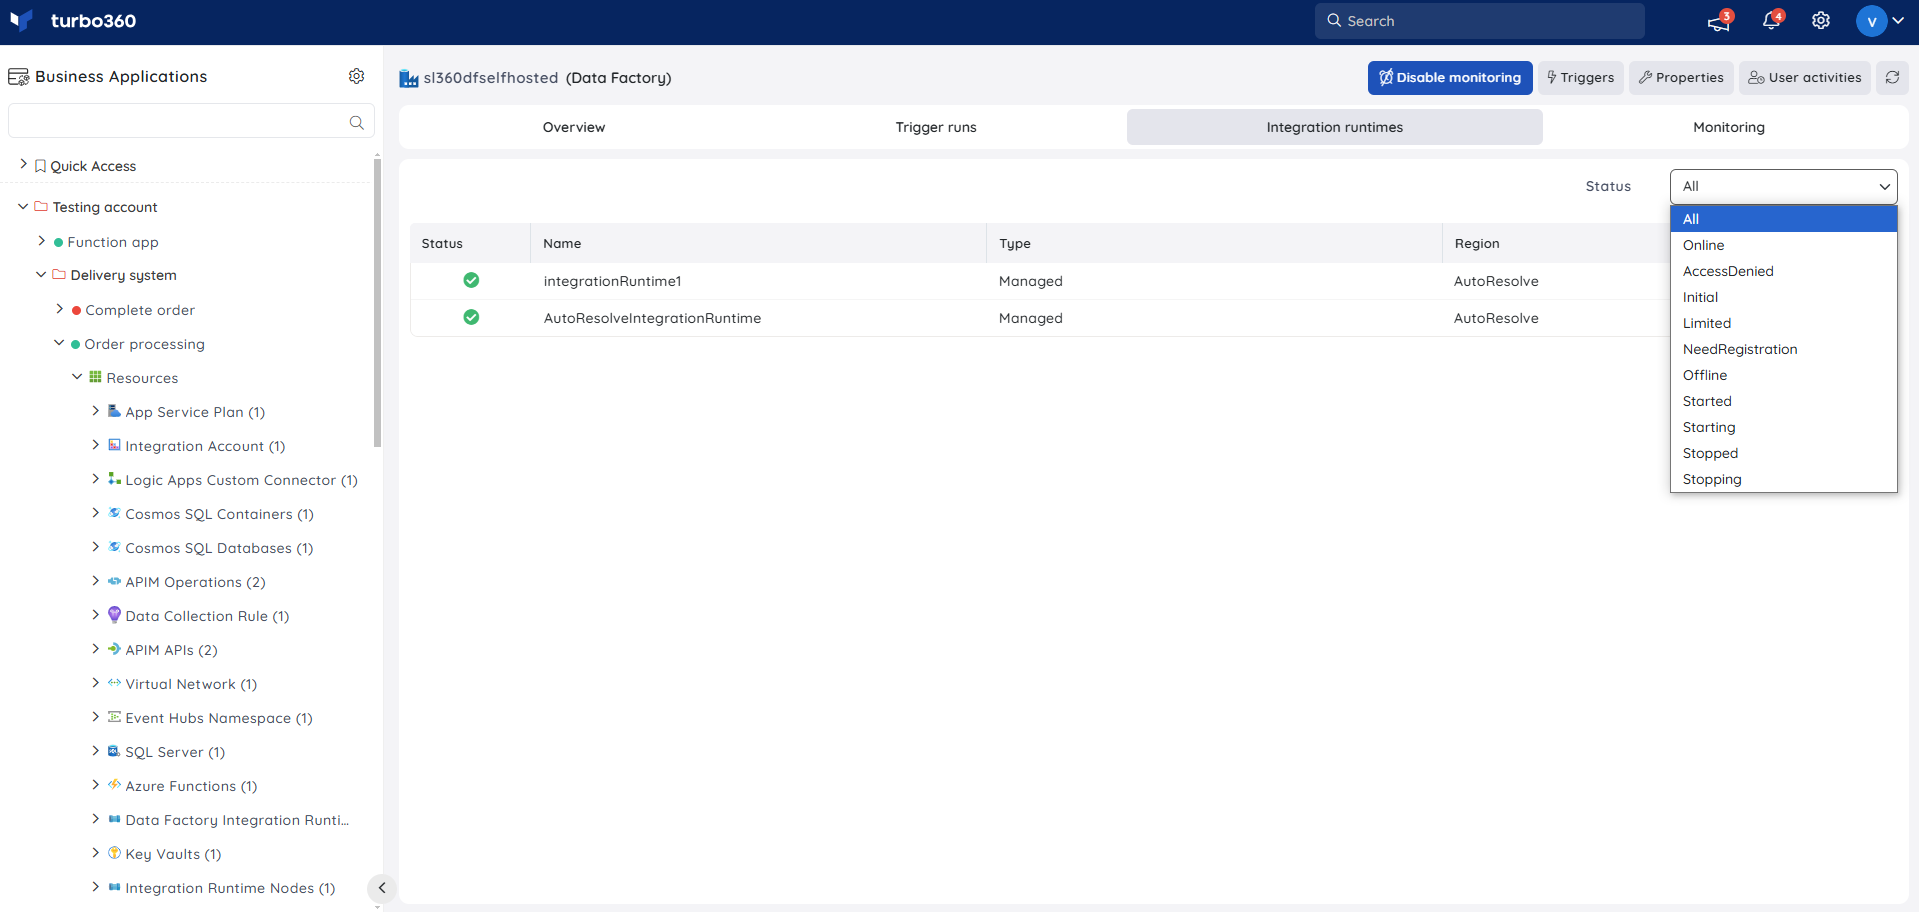
View and filter linked integration runtimes by status — Online, Access Denied, Initial, Limited, Need Registration, Offline, Started, Starting, Stopped, or Stopping. Use this when confirming compute availability before troubleshooting a pipeline failure.
Resource dashboard
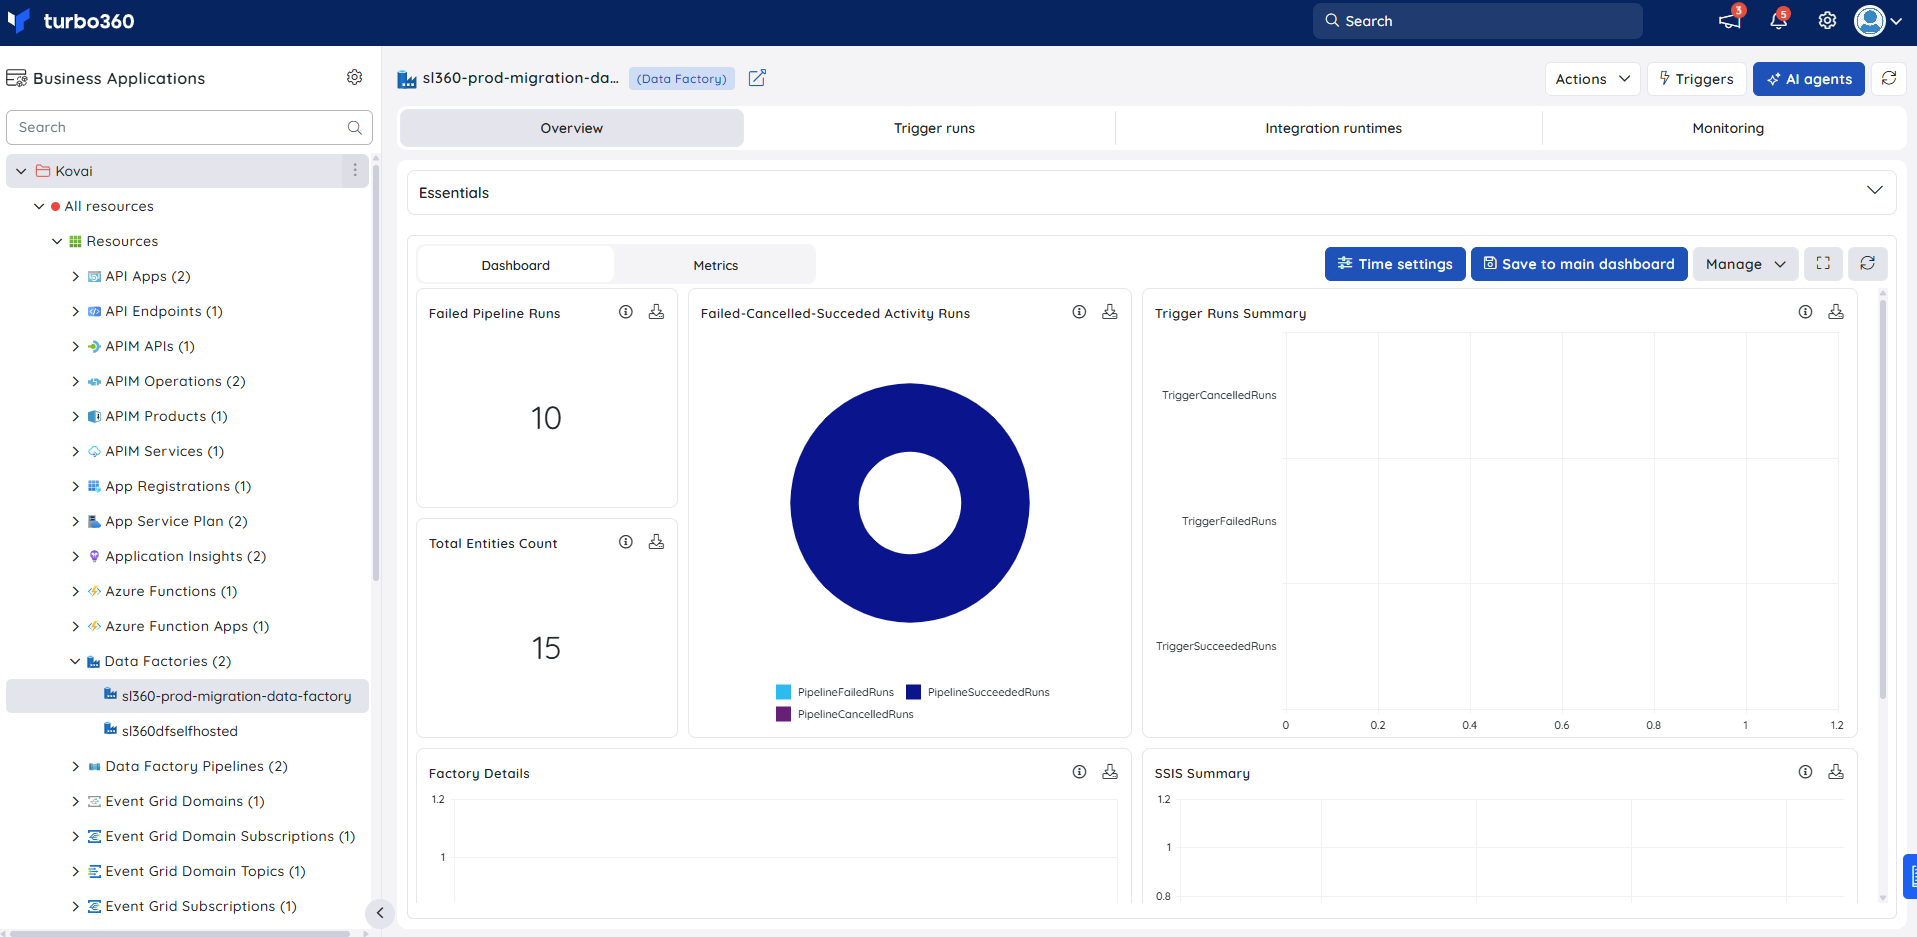
The Data Factory dashboard surfaces pipeline and trigger health at a glance, helping you spot failed runs and capacity issues without opening individual triggers.
| Widget | What it shows |
|---|---|
| Failed Pipeline Runs | Count of pipeline runs that failed, for quick triage. |
| Failed-Cancelled-Succeeded Activity Runs | Breakdown of activity run outcomes across the Data Factory. |
| Trigger Runs Summary | Aggregate view of trigger run volume and outcomes. |
| Total Entities Count | Number of entities (pipelines, datasets, etc.) in the Data Factory. |
| Factory Details | Key metadata about the Data Factory resource. |
| SSIS Summary | Summary of SSIS package execution activity. |
You can add, remove, or reconfigure widgets to focus on the metrics most relevant to your support scenario.
Metrics
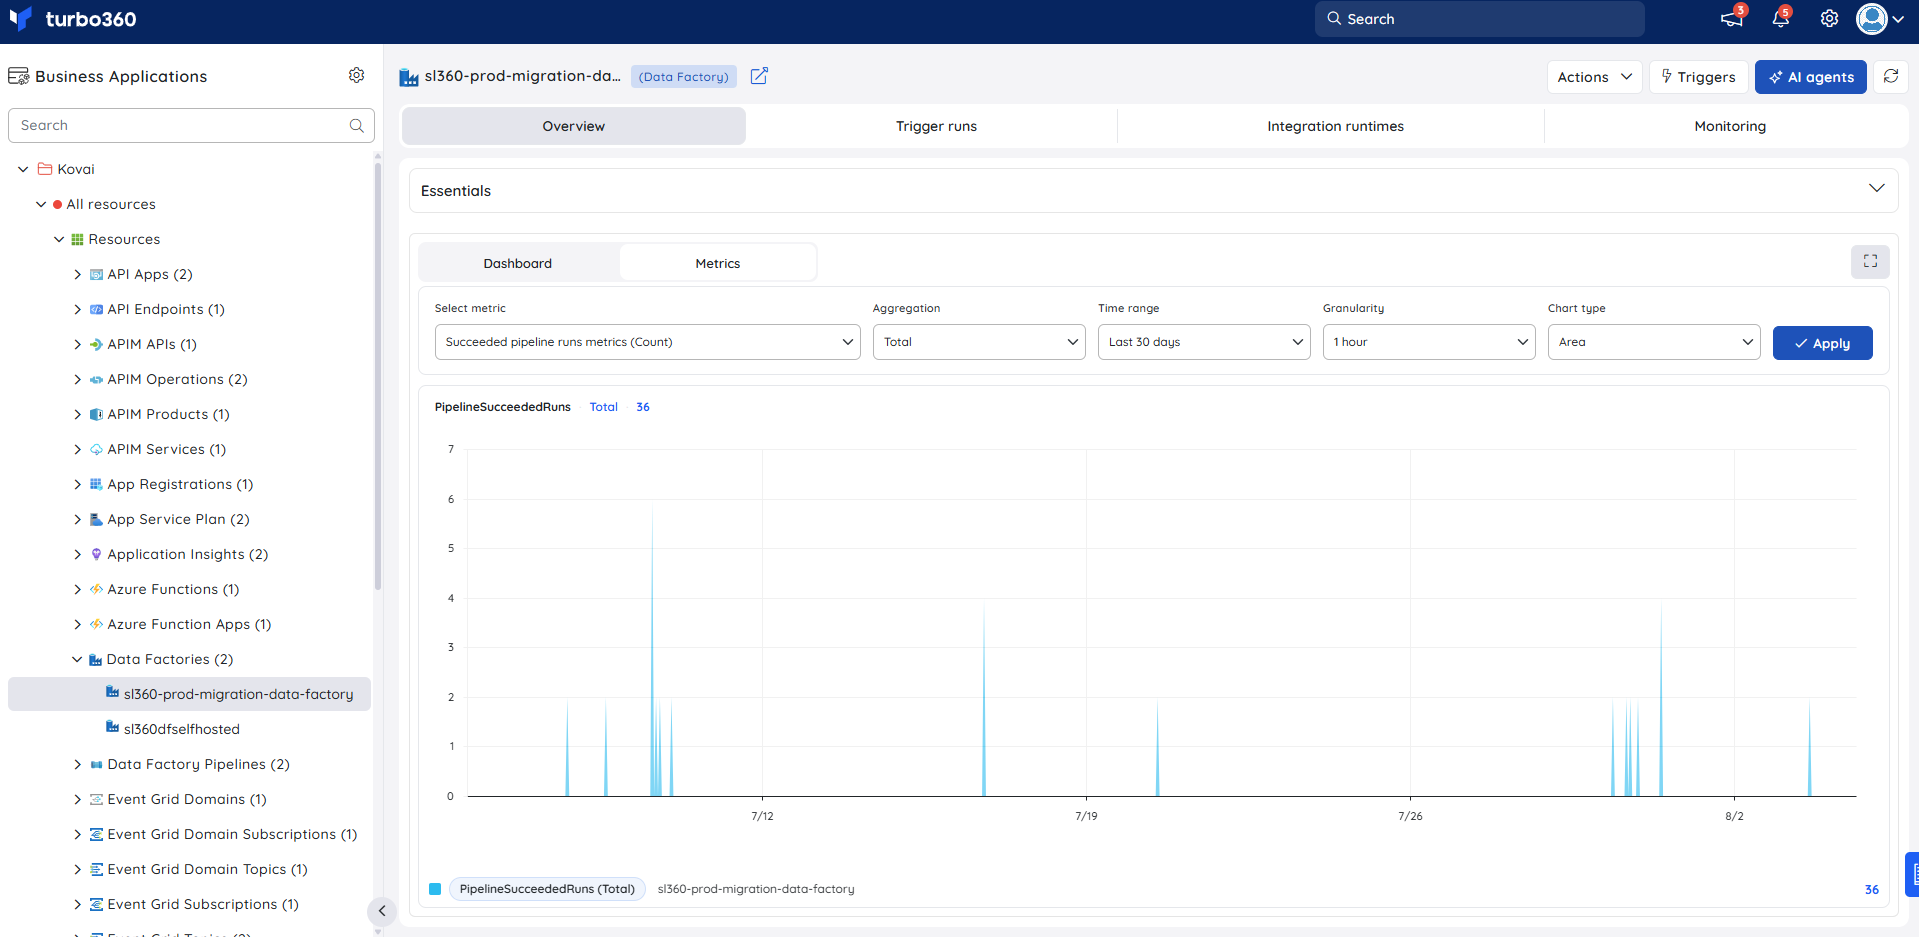
The Metrics tab lets you chart any Azure metric for your Data Factory directly in Turbo360, without switching to the Azure portal. Use it to track failed pipeline runs, activity run outcomes, and trigger run volumes over time — complementing your dashboard widgets with flexible time-range charts to identify failure patterns and peak processing periods.
Use the following controls to build your chart:
| Control | Description |
|---|---|
| Select metric | Choose the Azure metric to visualize (e.g. Failed Pipeline Runs, Succeeded Pipeline Runs, Failed Activity Runs, Trigger Runs Succeeded, Integration Runtime CPU Utilization). |
| Aggregation | Set the aggregation method: Average, Min, Max, Total, or Count. |
| Time range | Set the time window for the data (e.g. Last 24 hours, Last 7 days). |
| Granularity | Set the data point resolution (e.g. 1 minute, 1 hour). |
| Chart type | Choose the visualization type: Line or Bar. |
Click Apply to render the chart.
Monitoring
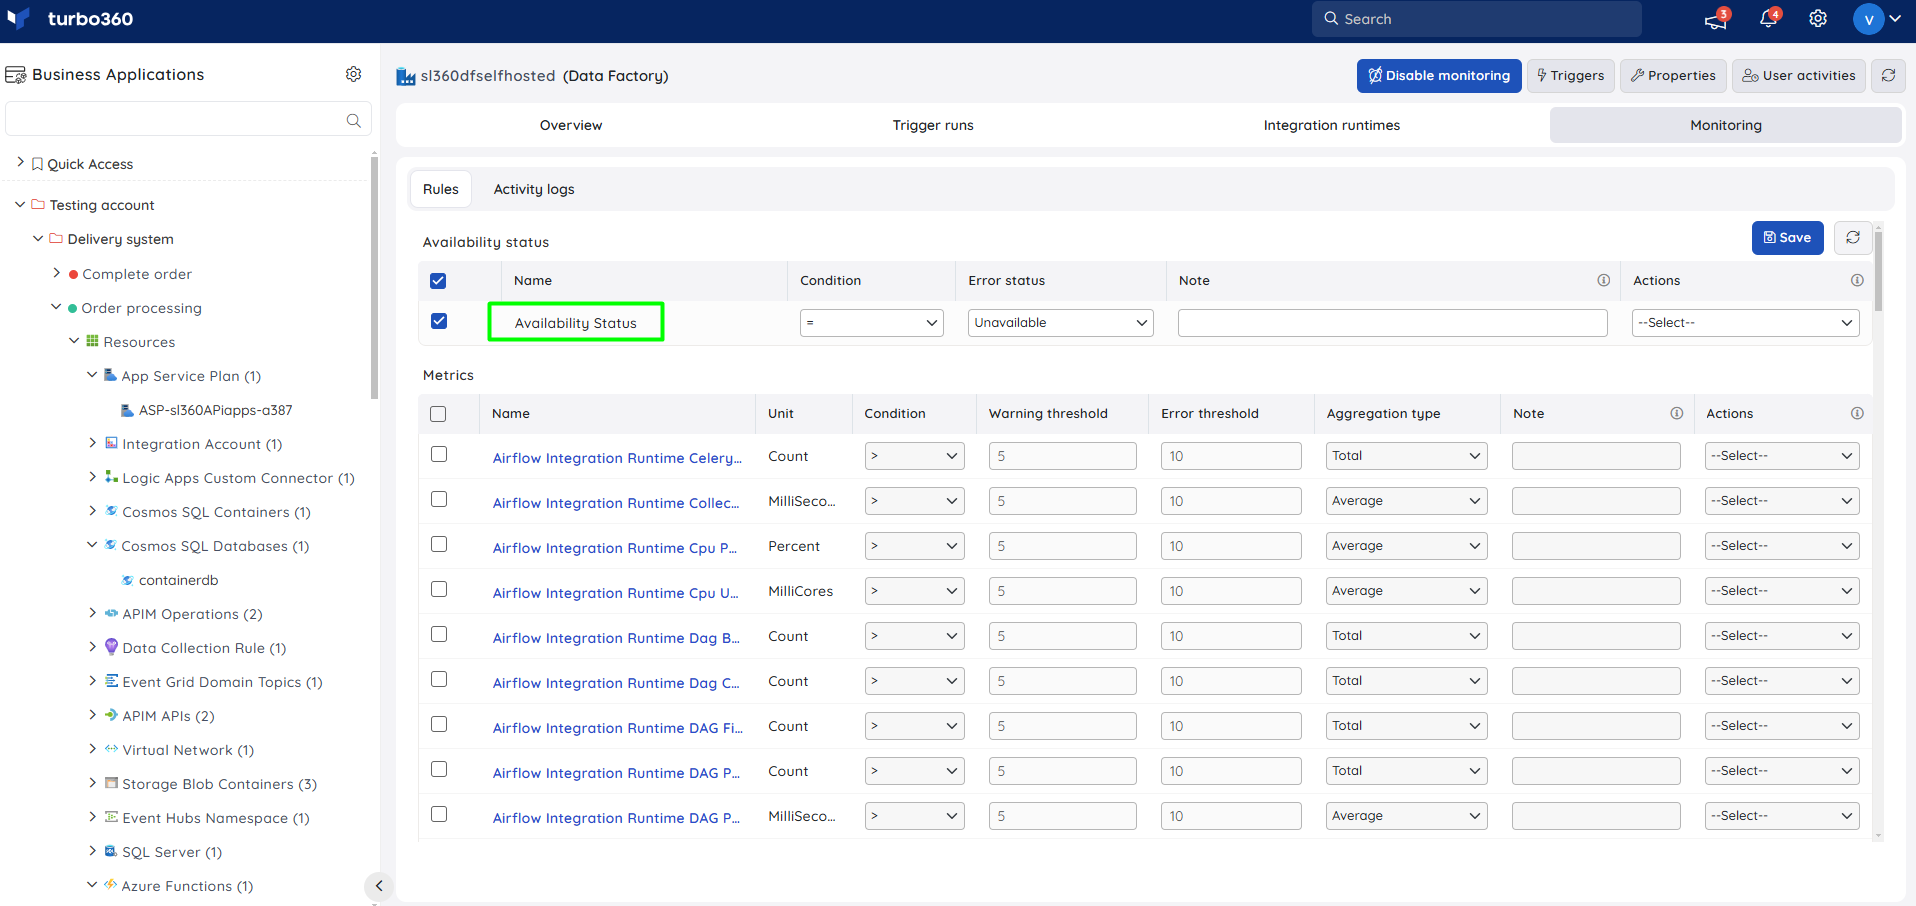
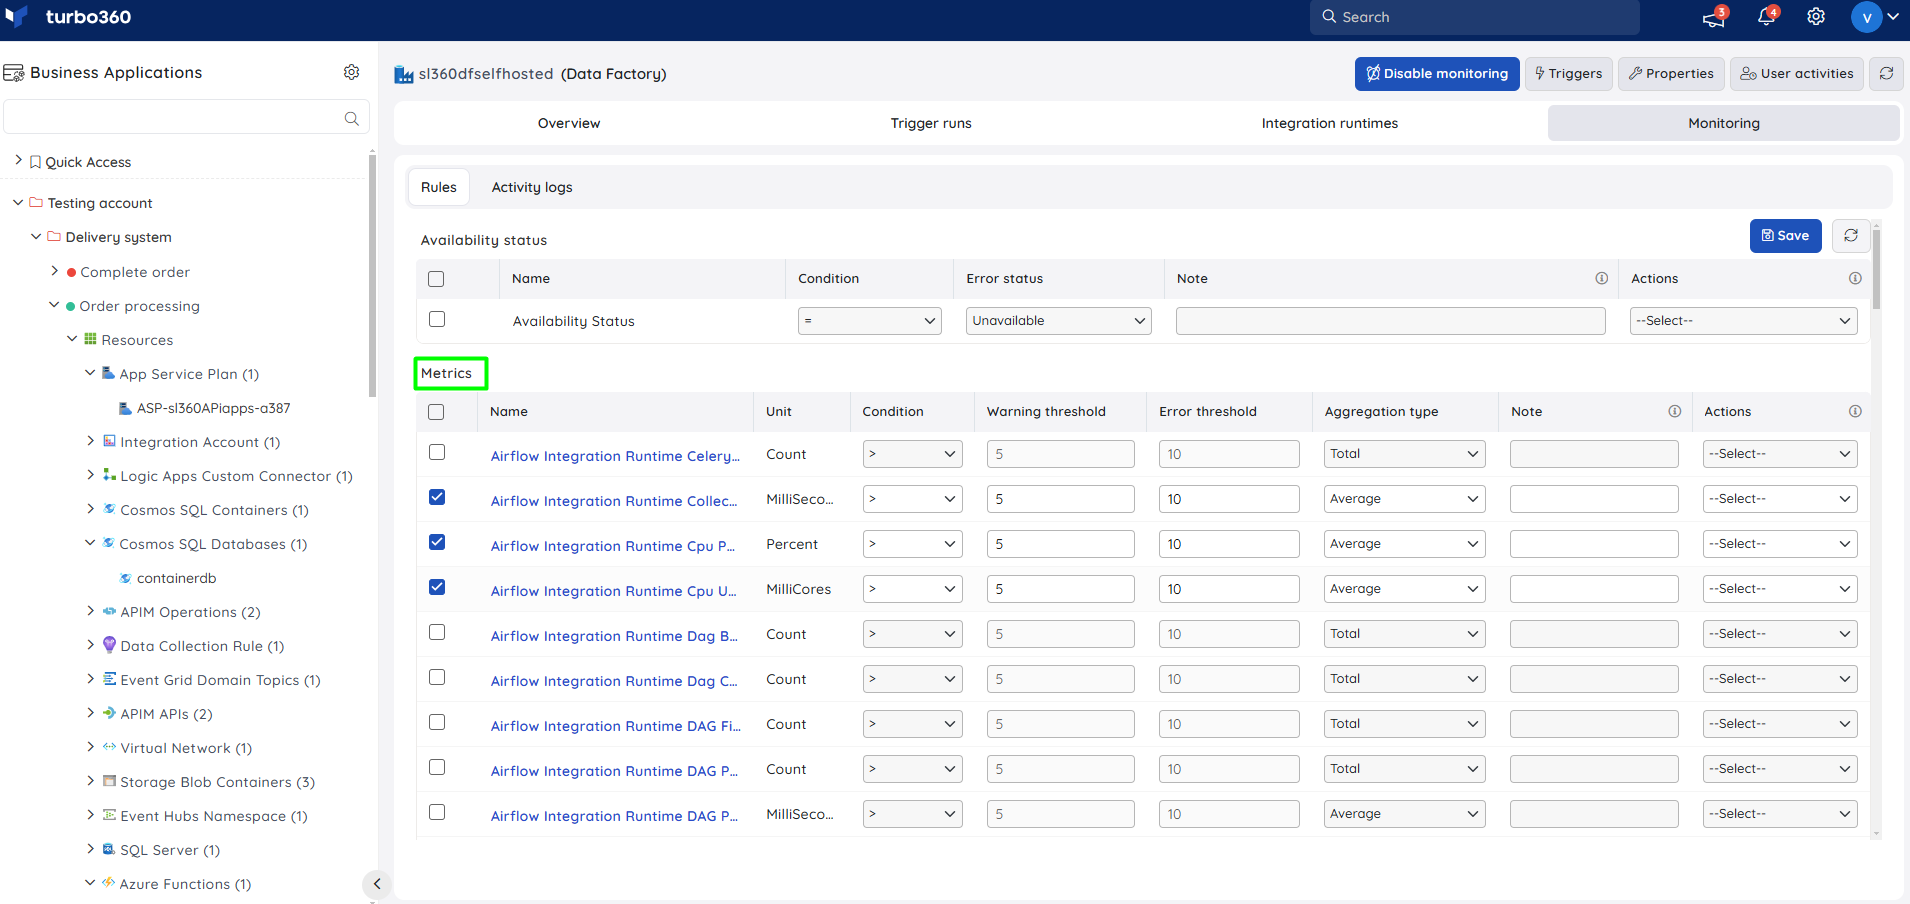
Data Factory supports Availability status and Metric monitoring rules, configured from Data Factory > Monitoring.
Monitoring rules are saved per resource, and the monitoring state is reflected after every monitoring cycle.
Availability status monitoring
Tracks the resource health status of the Data Factory. Use this when you need an early signal that the resource itself is unreachable or degraded.
- Configure the Availability status rule with the desired threshold.
- Click Save.
Metric monitoring
Tracks specific Data Factory metrics against a configured threshold. Use this when you want to be alerted as soon as a metric — such as failed pipeline runs — crosses an operational limit.
- Select the monitoring metrics and configure the threshold values. Any metric name can be used; the rule is violated once the configured threshold is met.
- Click Save.
Troubleshooting
Trigger status doesn't update in Turbo360 after starting or stopping it in the Azure portal.
Cause: Turbo360 reflects trigger state from the next sync cycle, not in real time.
Fix: Wait for the next sync cycle, or refresh the resource page.Trigger or pipeline run details show blank fields such as Description or End Time.
Cause: These fields are only populated when a value exists in the Azure portal.
Fix: Set the field in the Azure portal; Turbo360 will display it once available.Start or Stop action is unavailable for a trigger.
Cause: The signed-in role only has Read permission on the Data Factory resource.
Fix: Request Manage permission for Data Factory from your administrator.Monitoring rule shows no violation despite an apparent issue.
Cause: The monitoring state updates only after a full monitoring cycle completes.
Fix: Wait for the next monitoring cycle, or verify the configured threshold value.Dashboard widgets show no data.
Cause: The Data Factory resource may not yet be fully synced, or the metric has no recent activity.
Fix: Confirm the resource sync status, and check back after the next sync cycle.
Related articles
Was this article helpful?