

Data Factory Integration Runtime
- 05 Aug 2026
- 5 Minutes to read
- Print
- DarkLight
- Download PDF
Data Factory Integration Runtime
- Updated on 05 Aug 2026
- 5 Minutes to read
- Print
- DarkLight
- Download PDF
Article summary
Did you find this summary helpful?
Thank you for your feedback!
Overview
An Integration Runtime (IR) is the compute infrastructure Azure Data Factory uses to provide data integration capabilities such as Data Flow execution, data movement, activity dispatch, and SSIS package execution. It acts as the link between an activity and its linked services.
Business value
Understanding integration runtime types and their network reach helps you confirm the right compute environment is available before troubleshooting pipeline or data flow failures.
How it works
Data Factory offers three types of integration runtime, each suited to different network and workload needs:
| IR type | Public network | Private network |
|---|---|---|
| Azure | Data Flow, Data movement, Activity dispatch | Data Flow, Data movement, Activity dispatch |
| Self-hosted | Data movement, Activity dispatch | Data movement, Activity dispatch |
| Azure-SSIS | SSIS package execution | SSIS package execution |
Important terms
- An activity defines the action to be performed in Data Factory and Synapse pipelines.
- A linked service specifies a destination data store or compute service.
- An integration runtime acts as the link between the activity and the linked services.
Azure Integration Runtime
Microsoft manages all infrastructure patching, scaling, and maintenance. This IR type can only access data stores and services on public networks, including Data Flow execution, copy activities between cloud data stores, and dispatching transform activities such as Databricks, HDInsight, ML Studio (classic), Stored Procedure, Data Lake Analytics U-SQL, custom, Web, Lookup, and Get Metadata activities.
Azure Integration Runtime also supports connecting to data stores using a private link service in a private network environment when Virtual network configuration is enabled.
Self-hosted Integration Runtime
You manage your own infrastructure and hardware, and are responsible for all patching, scaling, and maintenance. This IR type has access to resources in both public and private networks, and must be installed on-premises or on a virtual machine within a private network (Windows only).
It supports copying data between cloud and private network data stores, and dispatching the same transform activity types as Azure Integration Runtime against on-premises or virtual network compute, using Bring Your Own Cluster (BYOC) for HDInsight activities.
When a managed virtual network is in use, a self-hosted integration runtime takes precedence over an Azure integration runtime for both source and sink linked services. Only outward HTTP-based connections to the open internet are made by the self-hosted integration runtime.
Azure-SSIS Integration Runtime
Azure-SSIS IRs are virtual machines that run the SSIS engine, letting you execute SSIS packages natively to lift and shift existing SSIS workloads. Microsoft manages all infrastructure patching, scaling, and maintenance, and the IR can access resources in both public and private networks. It can be deployed in either network type, with on-premises access enabled by connecting it to a virtual network linked to your on-premises network.
Linked nodes and related services
The Data Factory nodes associated with the integration runtime are listed in the Essentials card and the Integration Runtime resource grid, showing Name, Status, Max concurrent jobs, and Last connect time.
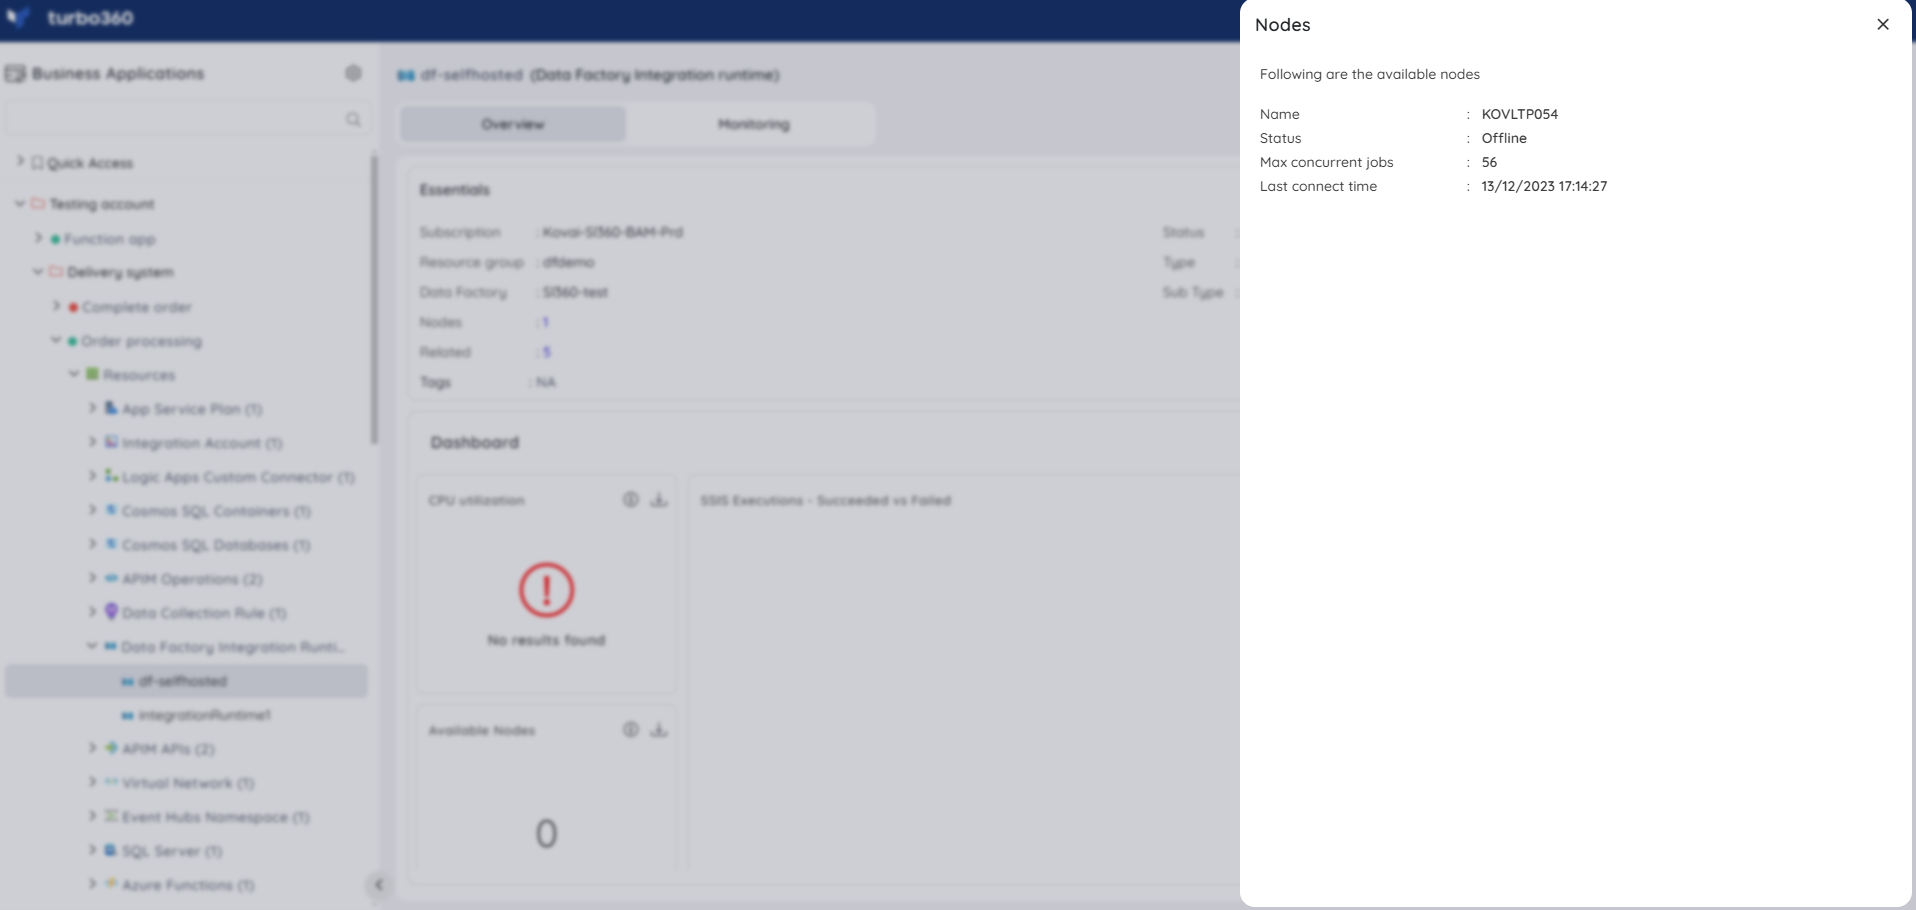
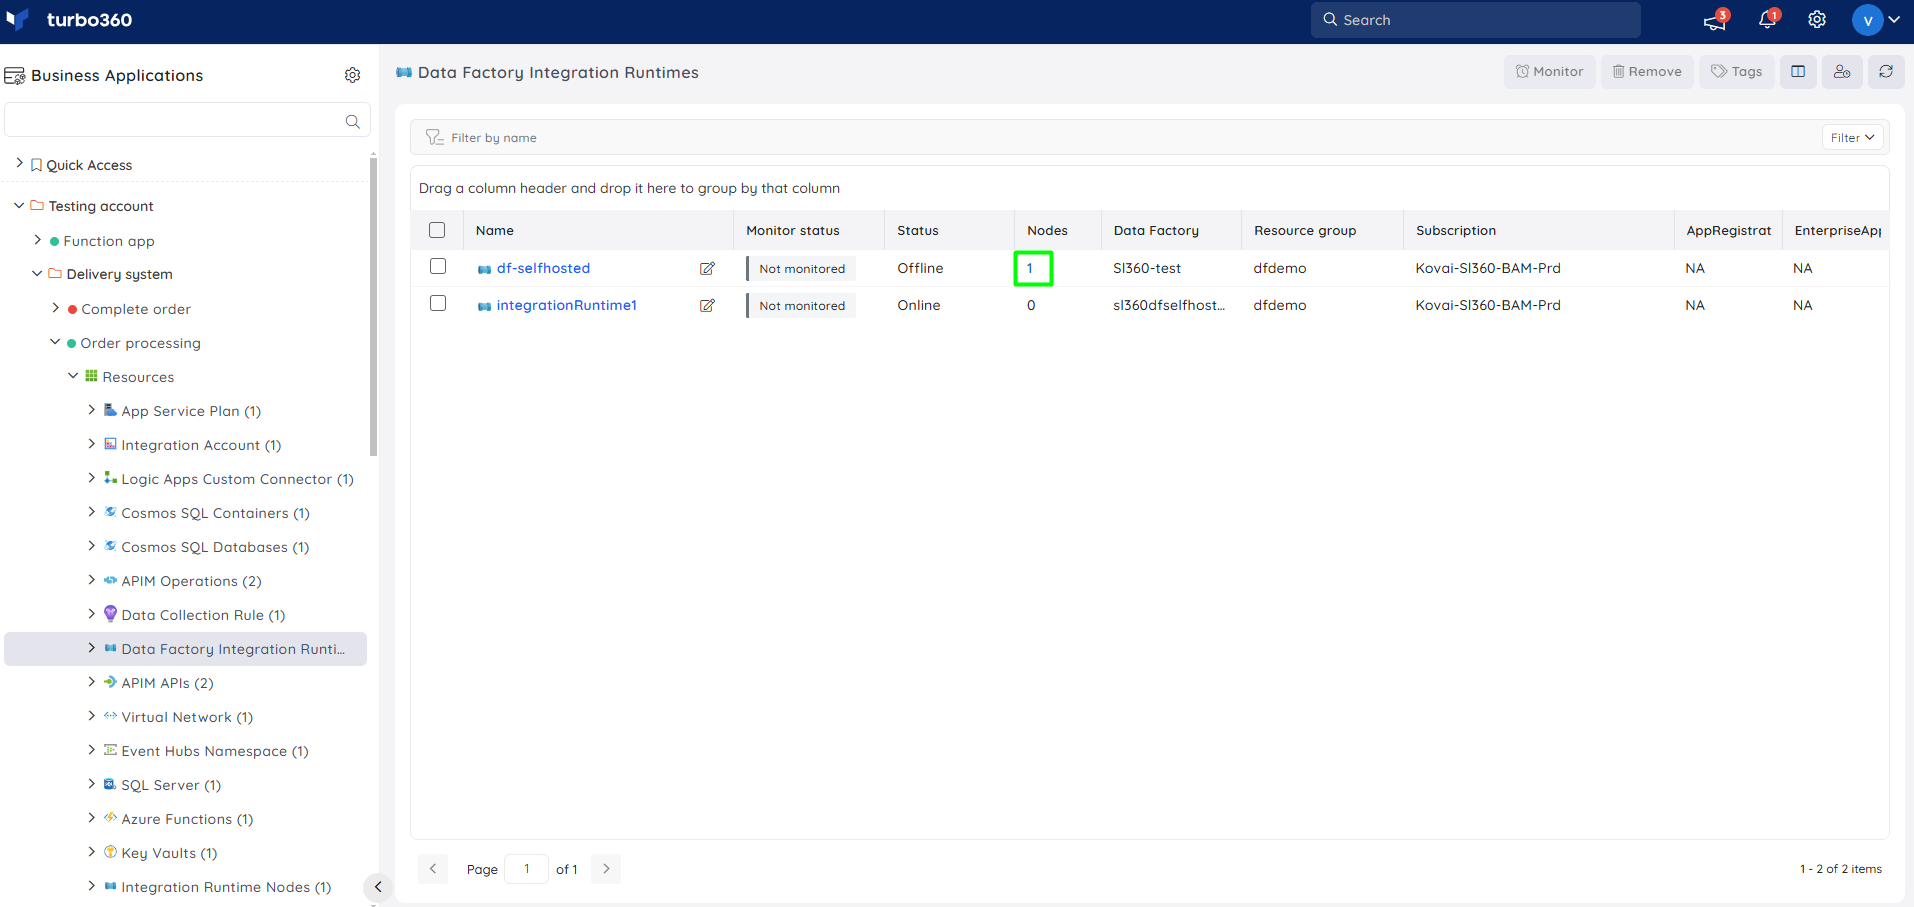
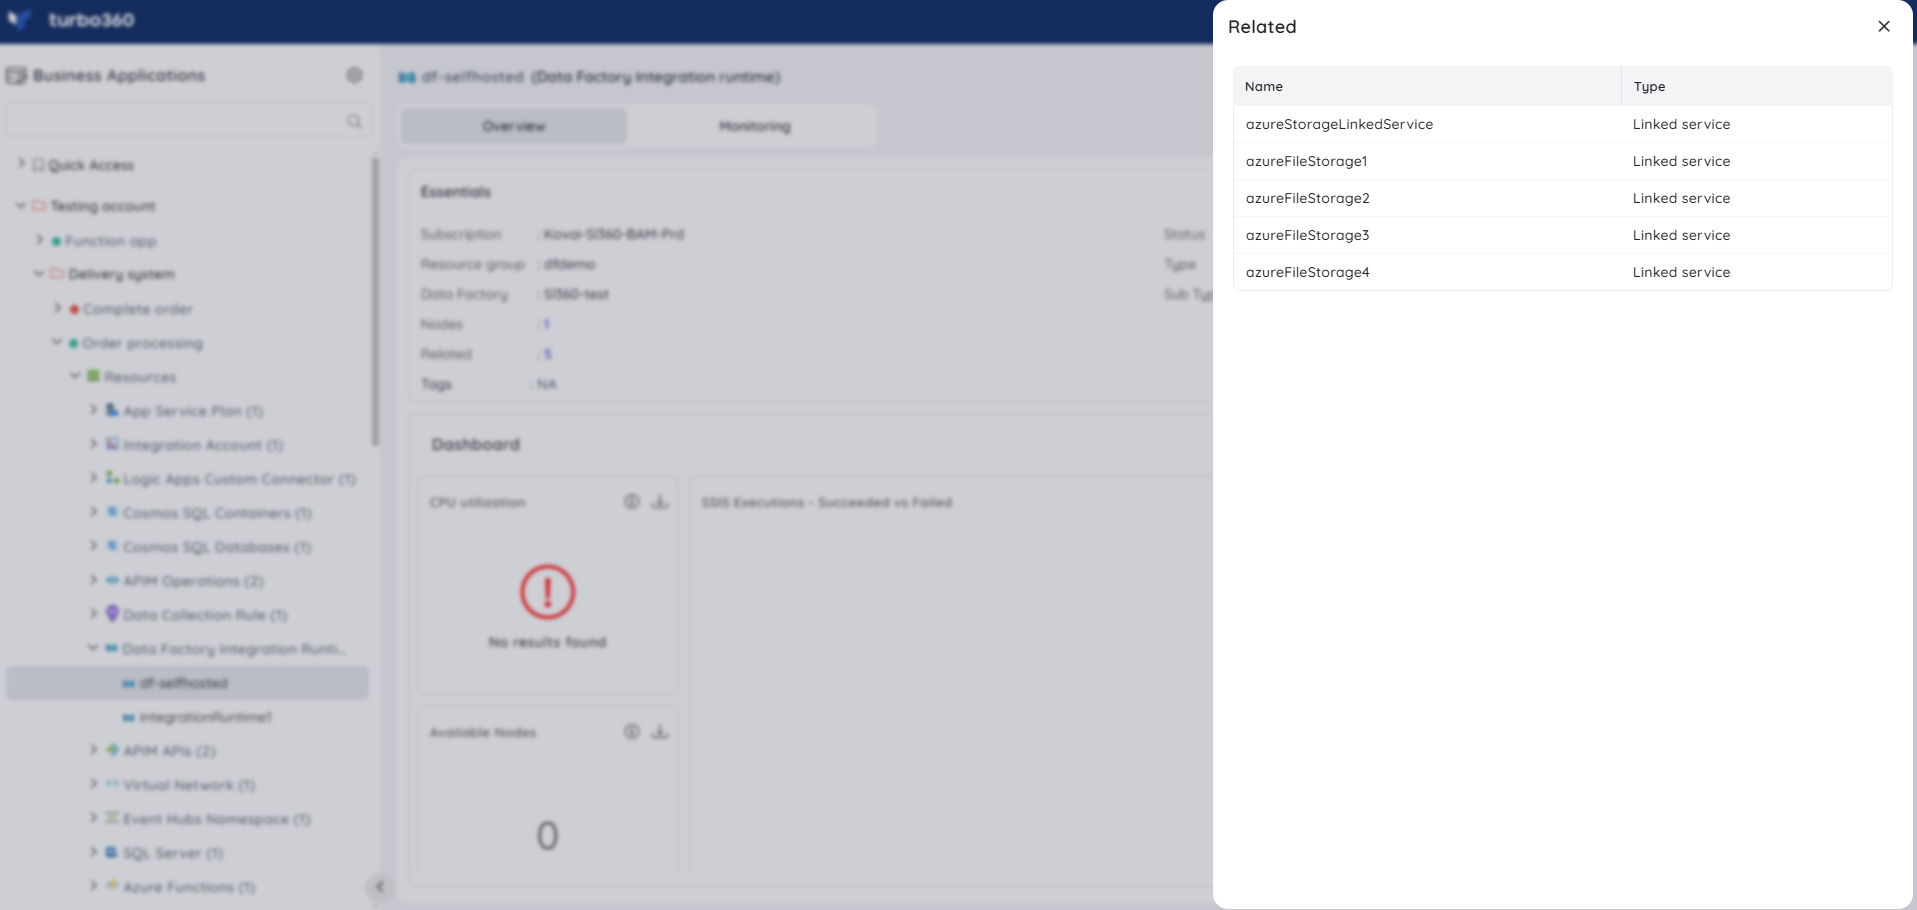
The Essentials card also displays linked services and related resources, such as Data Factory pipelines.
Permissions
Access to Data Factory Integration Runtime data in Turbo360 is controlled through role-based access control (RBAC). When adding a role, enable the Data Factory Integration Runtime resource type and assign:
| Permission | Grants |
|---|---|
| Read | View integration runtime details, linked nodes, related services, and the resource dashboard. |
[NEEDS VERIFICATION: whether a Manage permission level applies to Data Factory Integration Runtime, since no lifecycle actions are documented for this resource]
Resource dashboard
The Data Factory Integration Runtime dashboard surfaces compute health and SSIS execution outcomes, helping you confirm capacity before troubleshooting pipeline performance.
| Widget | What it shows |
|---|---|
| CPU utilization | Compute load on the integration runtime. |
| SSIS Executions - Succeeded vs Failed | Comparison of SSIS package execution outcomes. |
| Available Nodes | Count of nodes currently available to process jobs. |
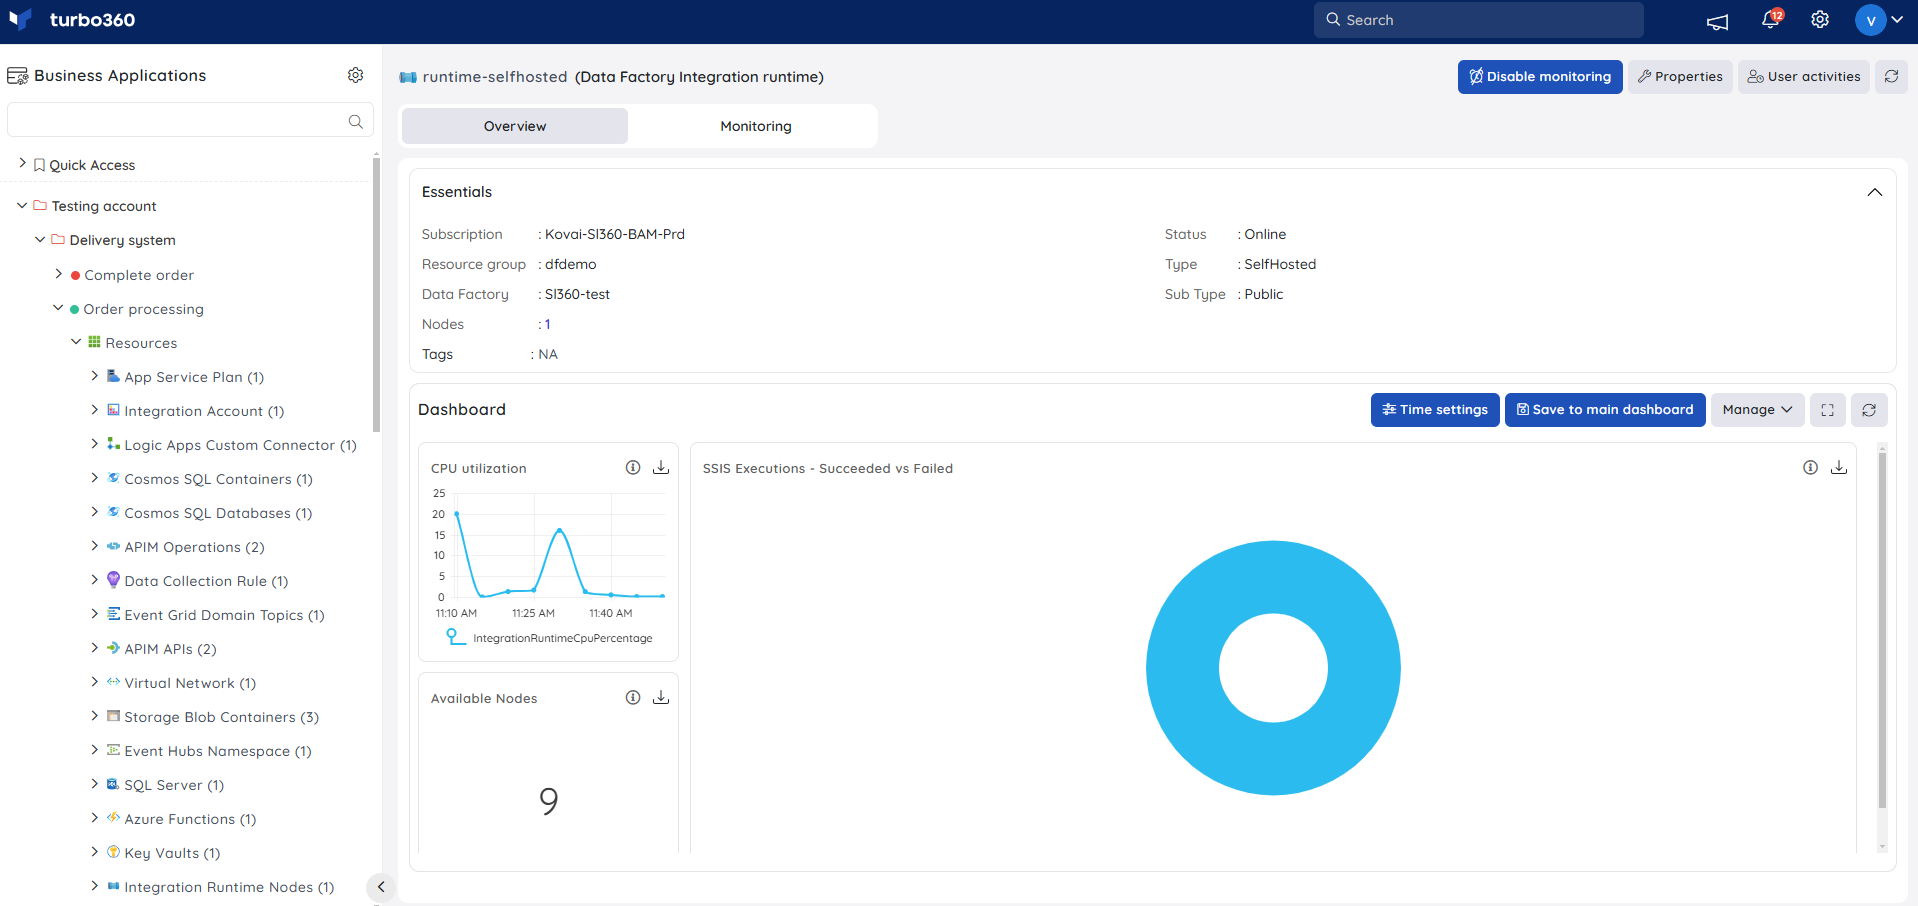
You can add, remove, or reconfigure widgets to focus on the metrics most relevant to your support scenario.
Metrics
The Metrics tab lets you chart any Azure metric for your Data Factory Integration Runtime directly in Turbo360, without switching to the Azure portal. Use it to track CPU utilization trends across all nodes, available node counts, and SSIS execution outcomes over time — particularly useful when investigating whether compute saturation is causing pipeline queuing or failures.
Use the following controls to build your chart:
| Control | Description |
|---|---|
| Select metric | Choose the Azure metric to visualize (e.g. Integration Runtime CPU Utilization, Integration Runtime Available Node Count, SSIS Package Execution Count, Integration Runtime Queue Duration). |
| Aggregation | Set the aggregation method: Average, Min, Max, Total, or Count. |
| Time range | Set the time window for the data (e.g. Last 24 hours, Last 7 days). |
| Granularity | Set the data point resolution (e.g. 1 minute, 1 hour). |
| Chart type | Choose the visualization type: Line or Bar. |
Click Apply to render the chart.
Monitoring
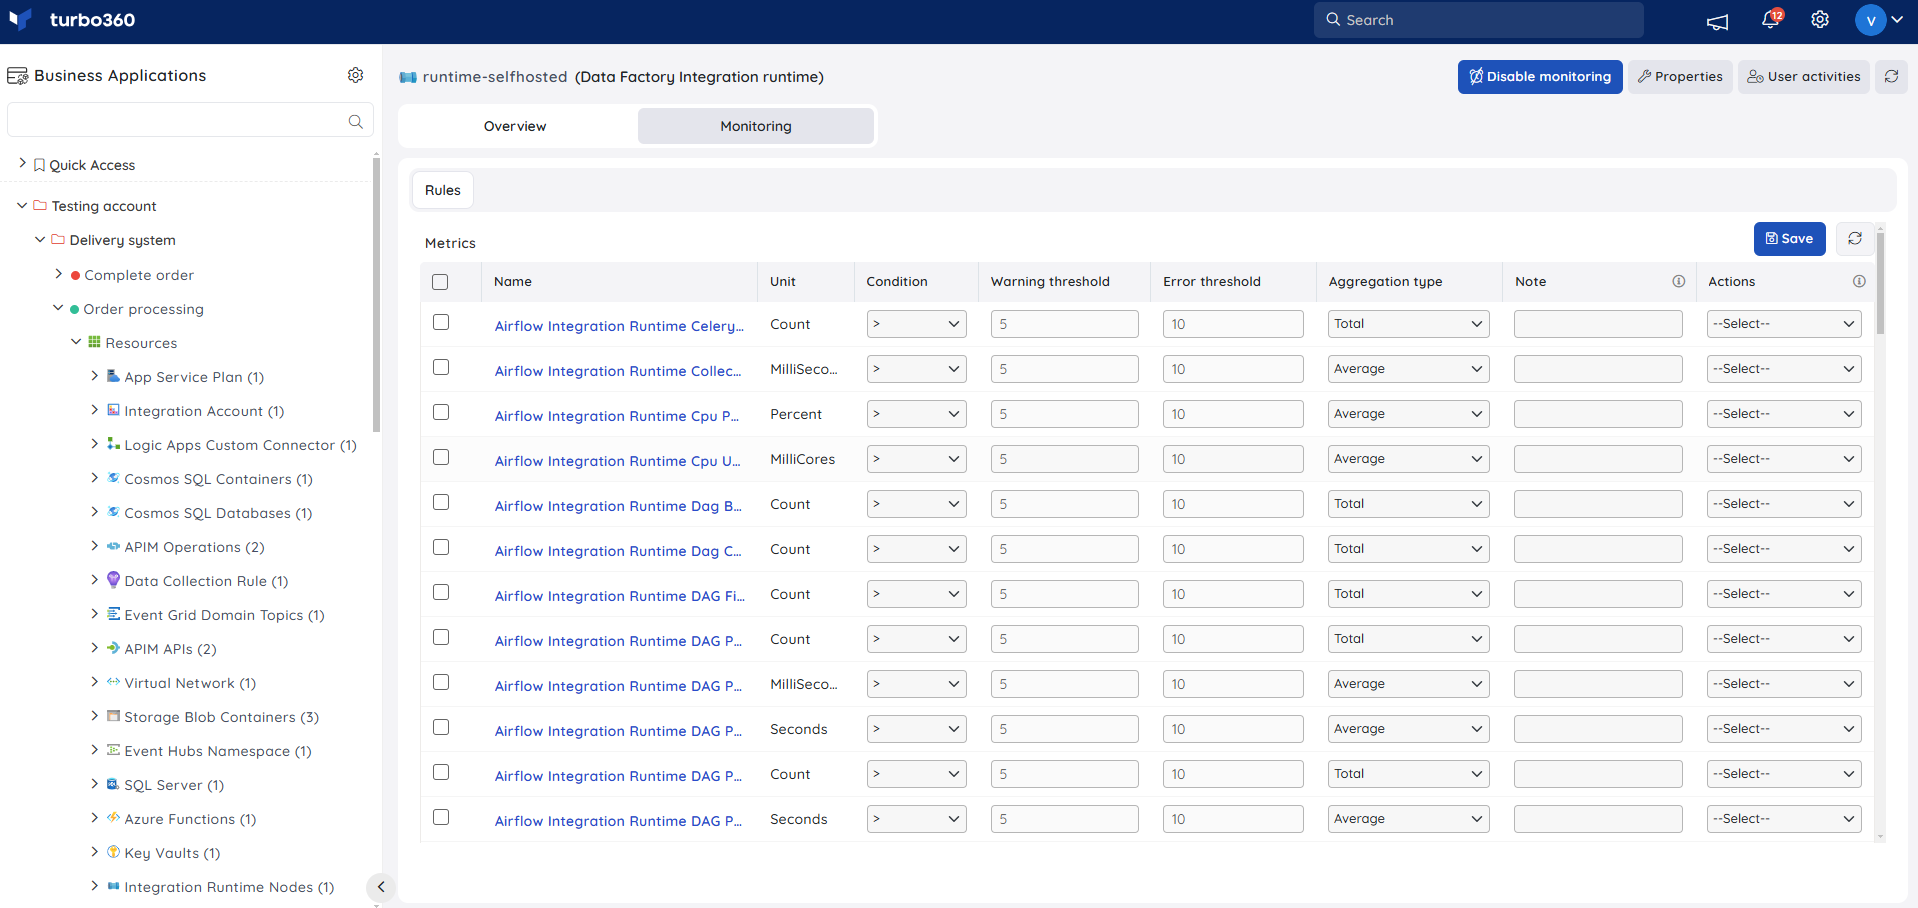
Data Factory Integration Runtime supports metric monitoring rules, configured from Data Factory Integration Runtime > Monitoring.
Monitoring rules are saved per resource, and the monitoring state is reflected after every monitoring cycle.
Metric monitoring
Tracks specific integration runtime metrics, such as CPU utilization or available nodes, against a configured threshold. Use this when you want to be alerted before a capacity issue affects pipeline execution.
- Select the monitoring metrics and configure the threshold values. Any metric name can be used; the rule is violated once the configured threshold is met.
- Click Save.
Troubleshooting
Integration runtime shows as Offline or Access Denied in Turbo360.
Cause: The integration runtime is unreachable from Azure, or its credentials have expired.
Fix: Verify the integration runtime status directly in the Azure portal and resolve connectivity or credential issues there.Self-hosted integration runtime doesn't appear under Linked nodes.
Cause: The node may not be registered yet, or the latest sync cycle hasn't completed.
Fix: Confirm node registration in Azure, then wait for the next sync cycle.SSIS Executions widget shows no data.
Cause: No SSIS packages have run recently, or the Azure-SSIS IR isn't linked correctly.
Fix: Confirm the Azure-SSIS IR is linked and has recent execution history.Metric monitoring rule doesn't trigger despite high CPU utilization.
Cause: The monitoring state updates only after a full monitoring cycle completes.
Fix: Wait for the next monitoring cycle, or verify the configured threshold value.Related Data Factory pipelines don't appear in the Essentials card.
Cause: The pipeline may not yet be linked to this integration runtime, or hasn't synced.
Fix: Confirm the pipeline's integration runtime assignment in Azure, then wait for the next sync.
Related articles
Was this article helpful?