

Databricks
- 05 Aug 2026
- 6 Minutes to read
- Print
- DarkLight
- Download PDF
Databricks
- Updated on 05 Aug 2026
- 6 Minutes to read
- Print
- DarkLight
- Download PDF
Article summary
Did you find this summary helpful?
Thank you for your feedback!
Overview
Azure Databricks is an analytics platform for big data and artificial intelligence (AI) that is quick, simple, and collaborative, and runs on Apache Spark. Turbo360's Business Application facilitates the management and monitoring of the following Databricks components:
- Databrick Compute Clusters
- Databrick Compute Pools
- Databrick Workflow Delta Live Tables
- Databrick Workflow Jobs
Business value
Managing and monitoring Databricks components from Turbo360 gives you a single place to control cluster and job state and respond to failures, without switching to the Databricks workspace.
How it works
- Once Databricks components are associated with a Business Application, their state can be monitored and controlled directly from Turbo360.
- Service principal access must be granted in the Databricks Workspace before Turbo360 can manage these resources. See Prerequisites below.
Prerequisites
Required permissions
The following steps must be performed to grant permissions for the integration of Databricks services with Turbo360:
- Launch Databricks Workspace and go to Profile -> Admin Settings.
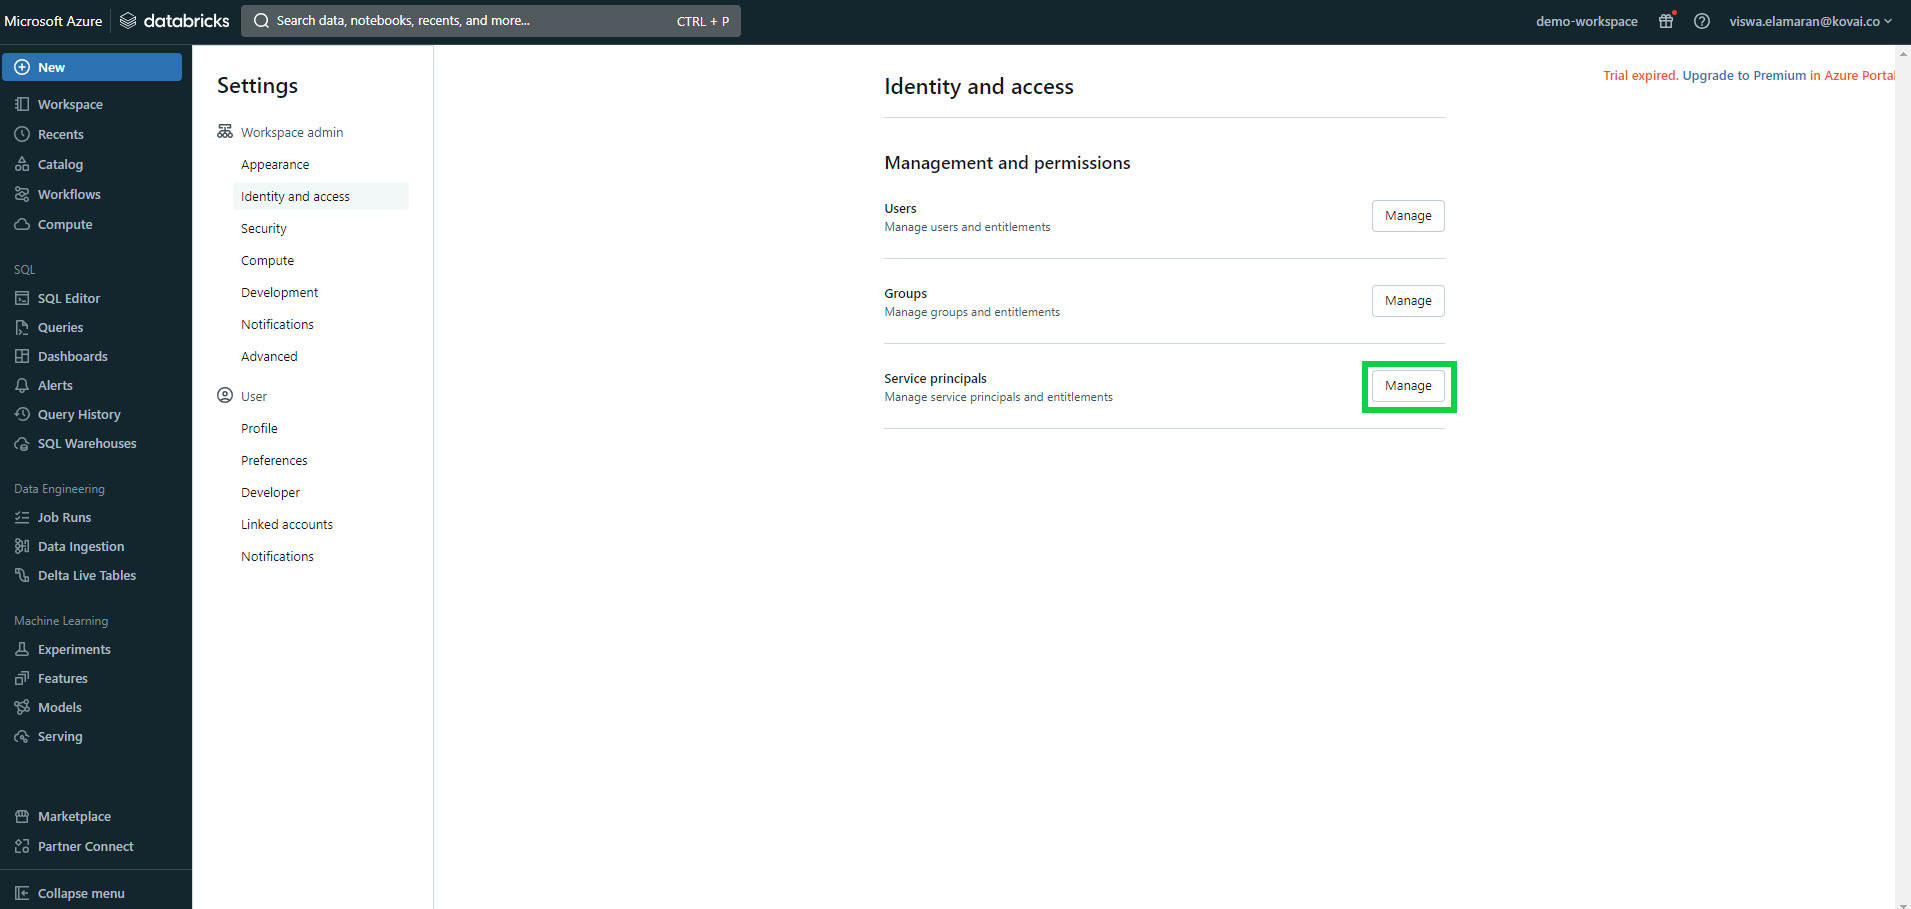
- Select Identify and access under Workspace admin settings and click Manage next to Service principals.
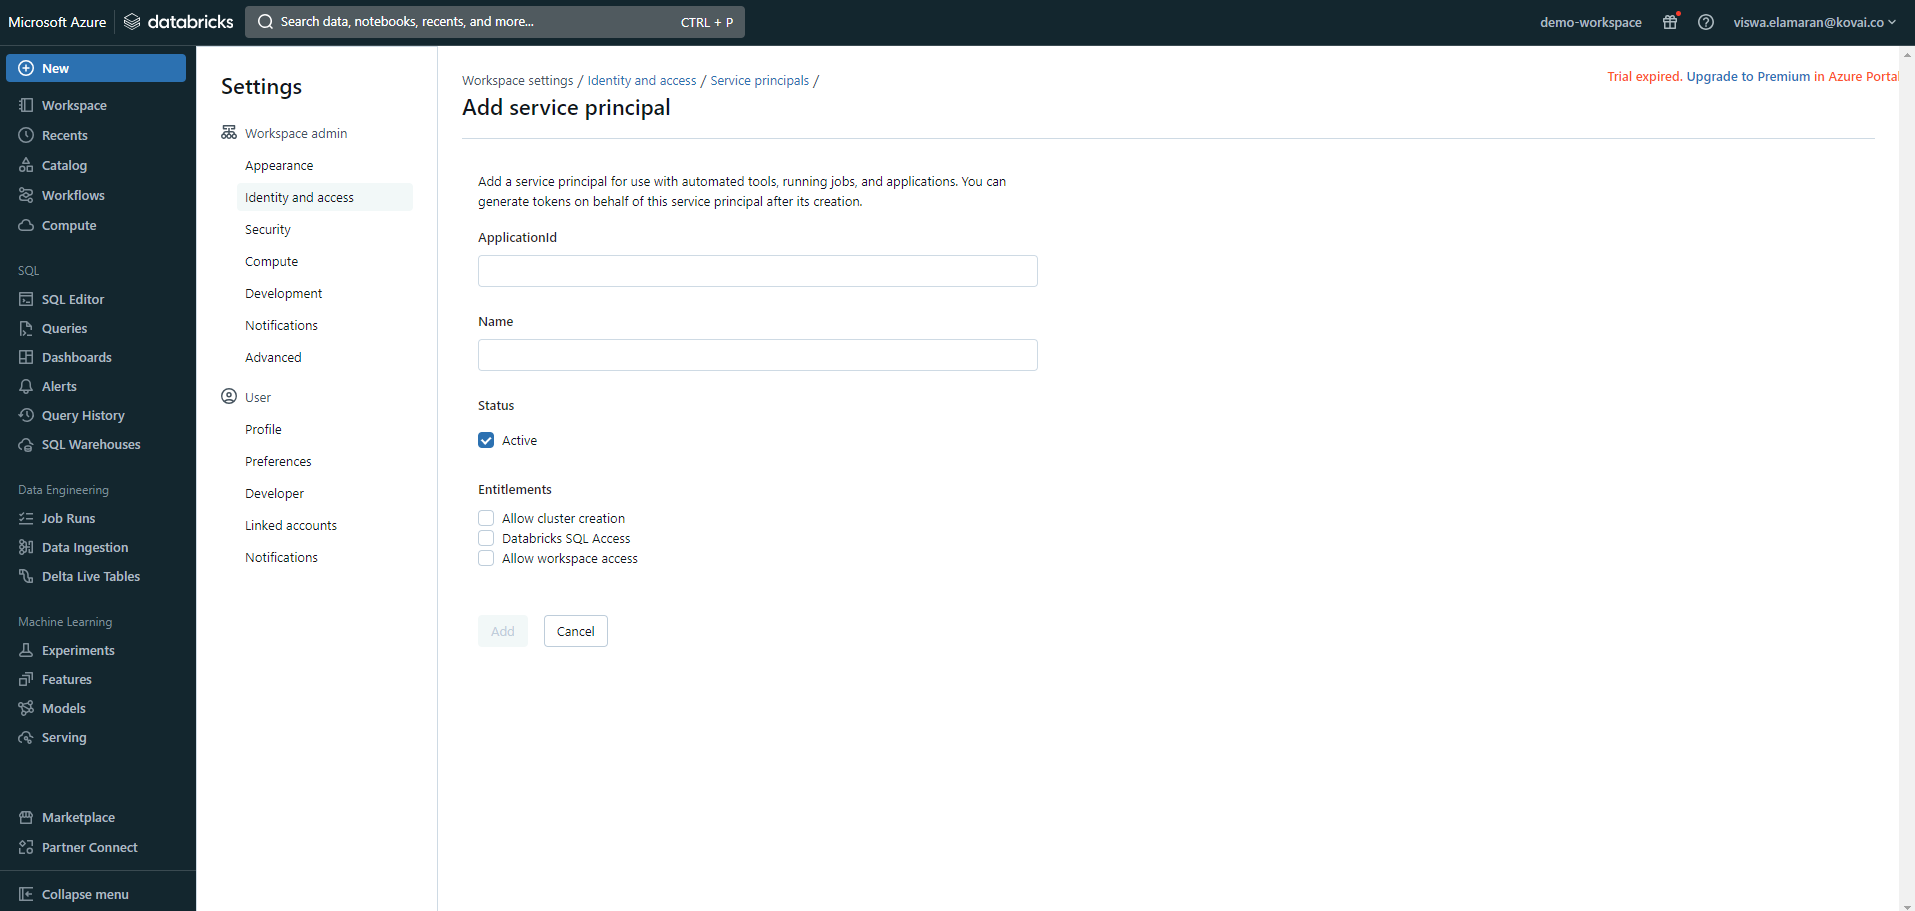
- Add the Service principal credentials that will be associated with Turbo360.
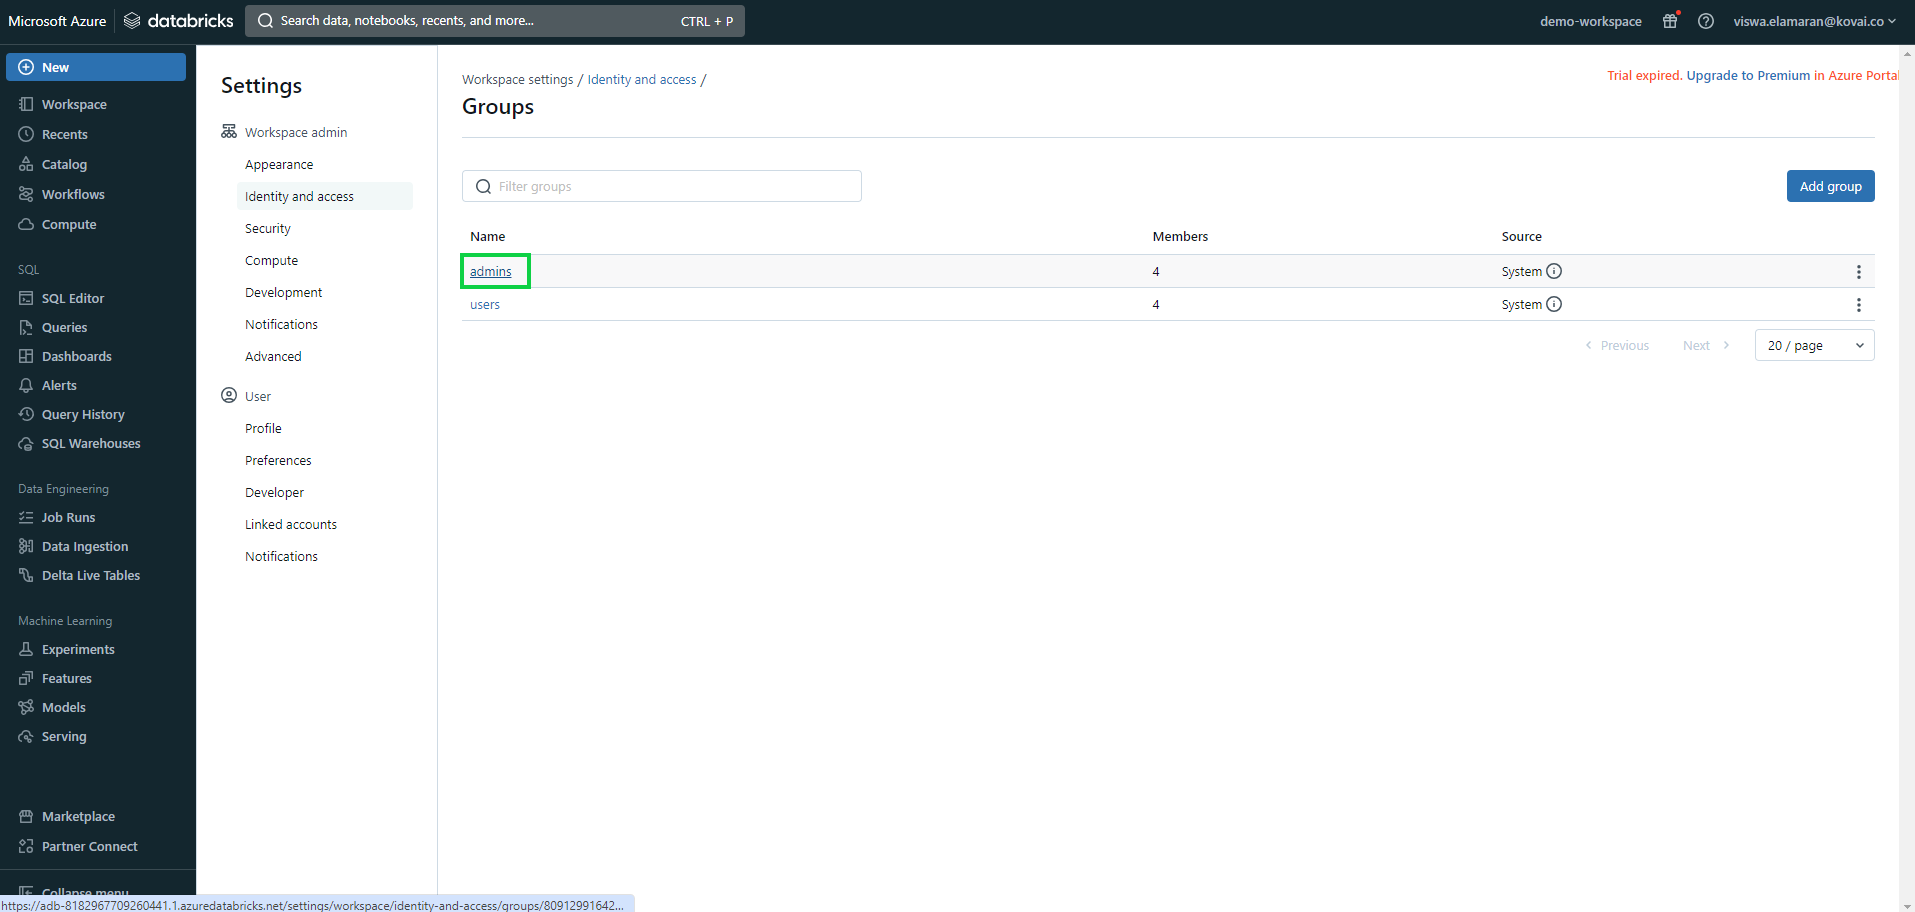
- Navigate to the following path: Identify and access -> Groups -> Manage -> admin.
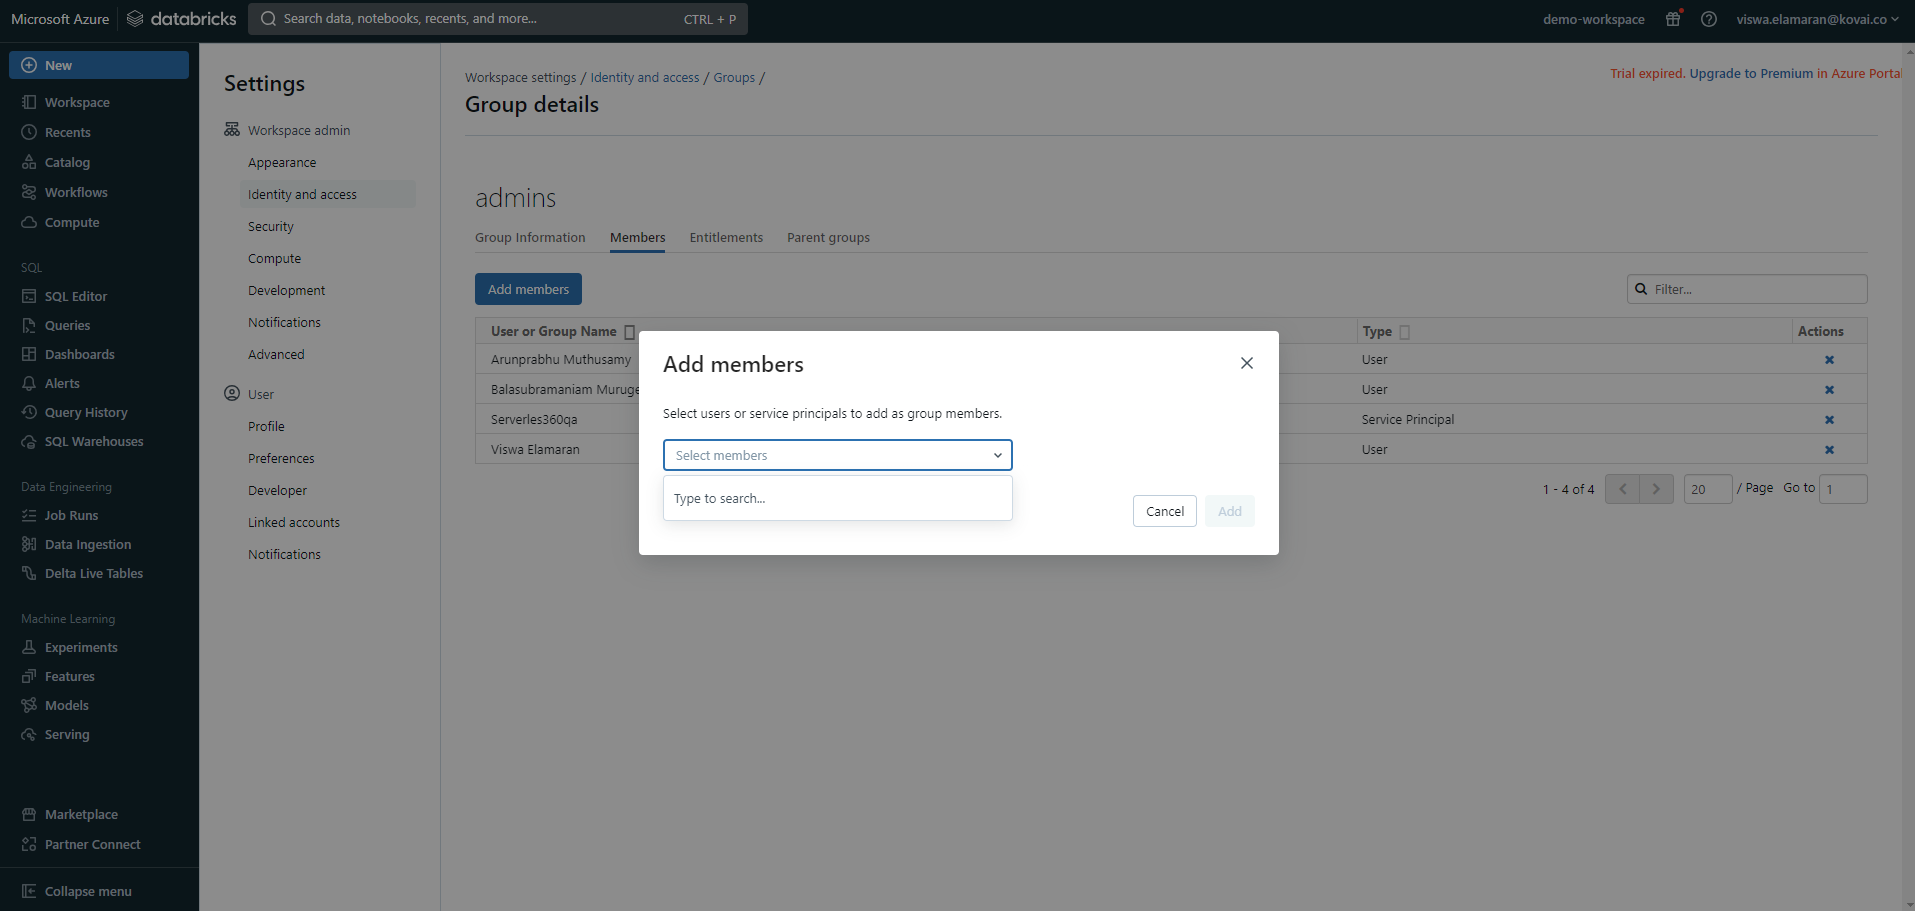
- Add the same Service principal as an admin group user.
Permissions
Access to Databricks resource actions is controlled through RBAC when adding a role to a Business Application.
| Permission | Description |
|---|---|
| Read | View resource state, run history, and monitoring rules. |
| Manage | Perform lifecycle operations (Start, Stop, Restart), trigger or cancel job runs, and configure monitoring rules. |
| Reprocess | Available for Databrick Workflow Job only — repair and resubmit failed job runs. |
Operations
Turbo360 lets you control the lifecycle of Databricks compute and workflow resources directly, without switching to the Databricks workspace — useful for incident response, scheduled maintenance, and recovery.
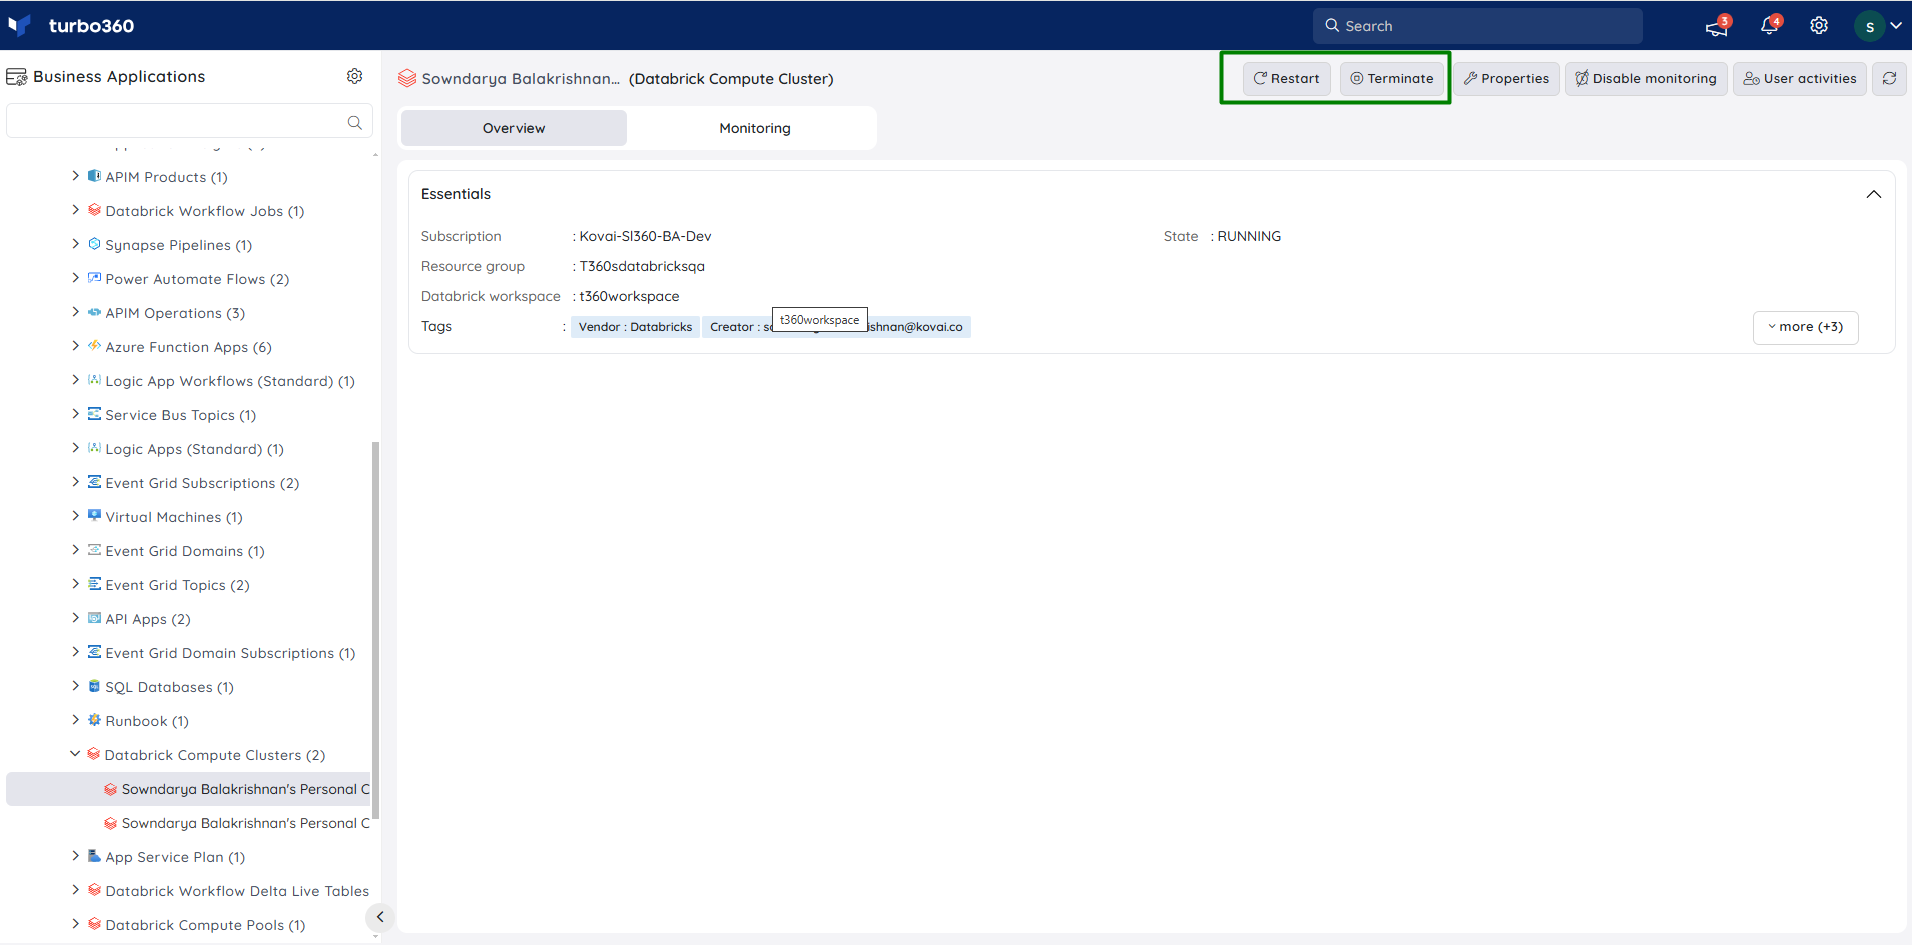
Start, Stop, and Restart (Compute Cluster)
Compute clusters are collections of computing resources used to carry out data analysis and processing operations defined in Databricks notebooks. These clusters are used by Databricks to divide and parallelize computations on big datasets.
- Start — bring a stopped cluster online. Use this when a scheduled job needs the cluster available.
- Stop — shut down a running cluster. Use this when the cluster is no longer needed, to control cost.
- Restart — stop and start the cluster in sequence. Use this when a cluster is unresponsive or needs a clean state.
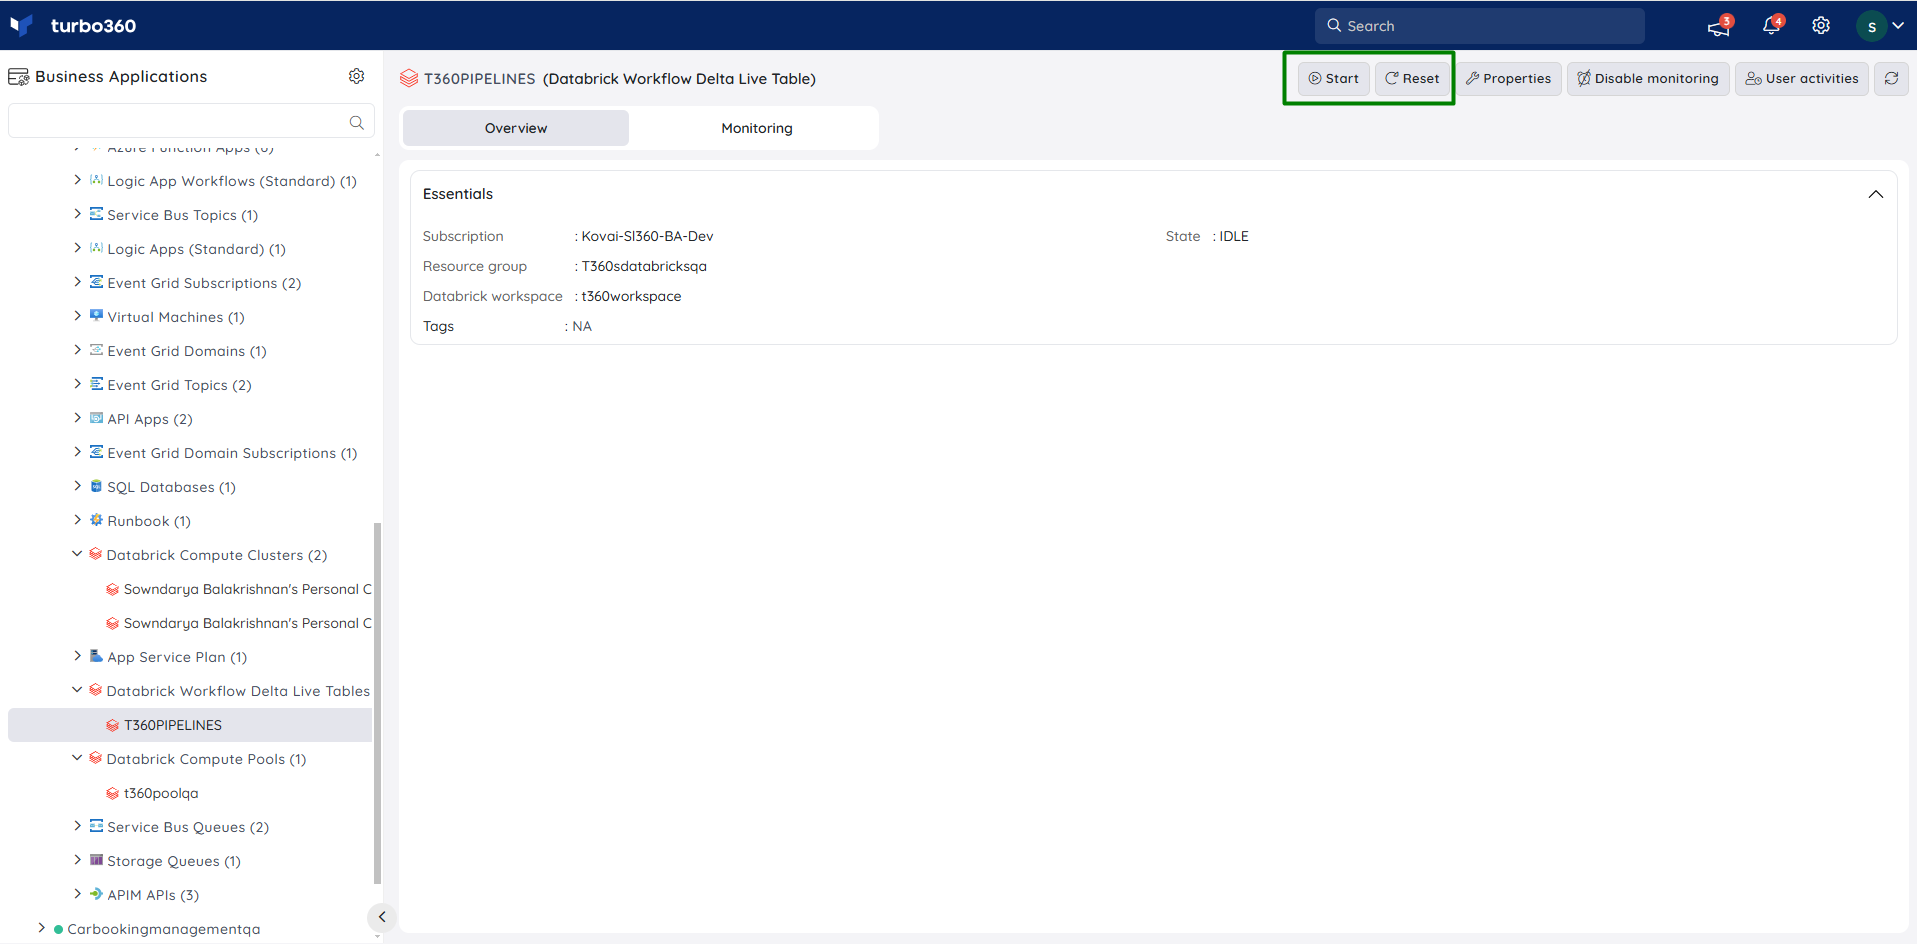
Start, Stop, and Restart (Delta Live Table pipelines)
Delta Live Tables, a declarative framework, facilitates the creation of data processing pipelines characterized by dependability, testability, and maintainability. Task orchestration, cluster management, monitoring, data quality, and error handling are managed by Delta Live Tables, allowing you to focus on specifying the transformations you want for your data. Pipelines available within a Delta Live Table can be managed using Turbo360.
- Start — bring a stopped pipeline online. Use this when the pipeline needs to resume processing.
- Stop — shut down a running pipeline. Use this when processing needs to be paused.
- Restart — stop and start the pipeline in sequence. Use this when a pipeline is stuck or needs a clean state.
Management operation
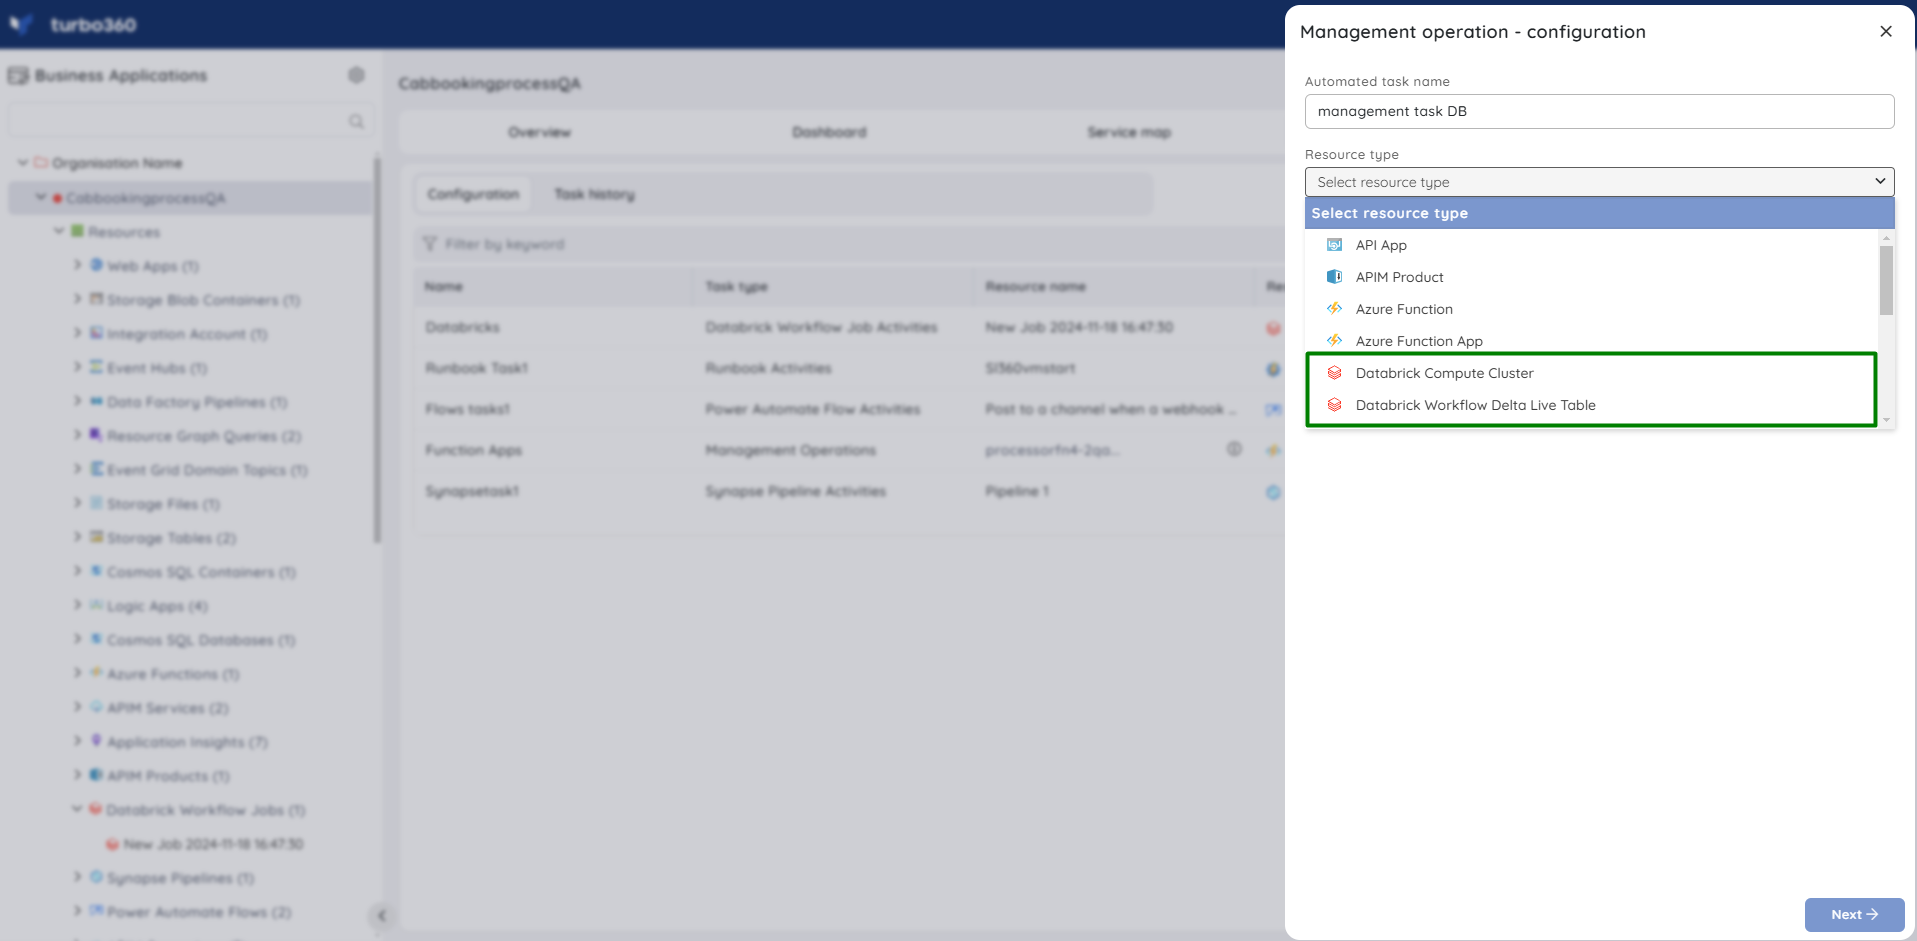
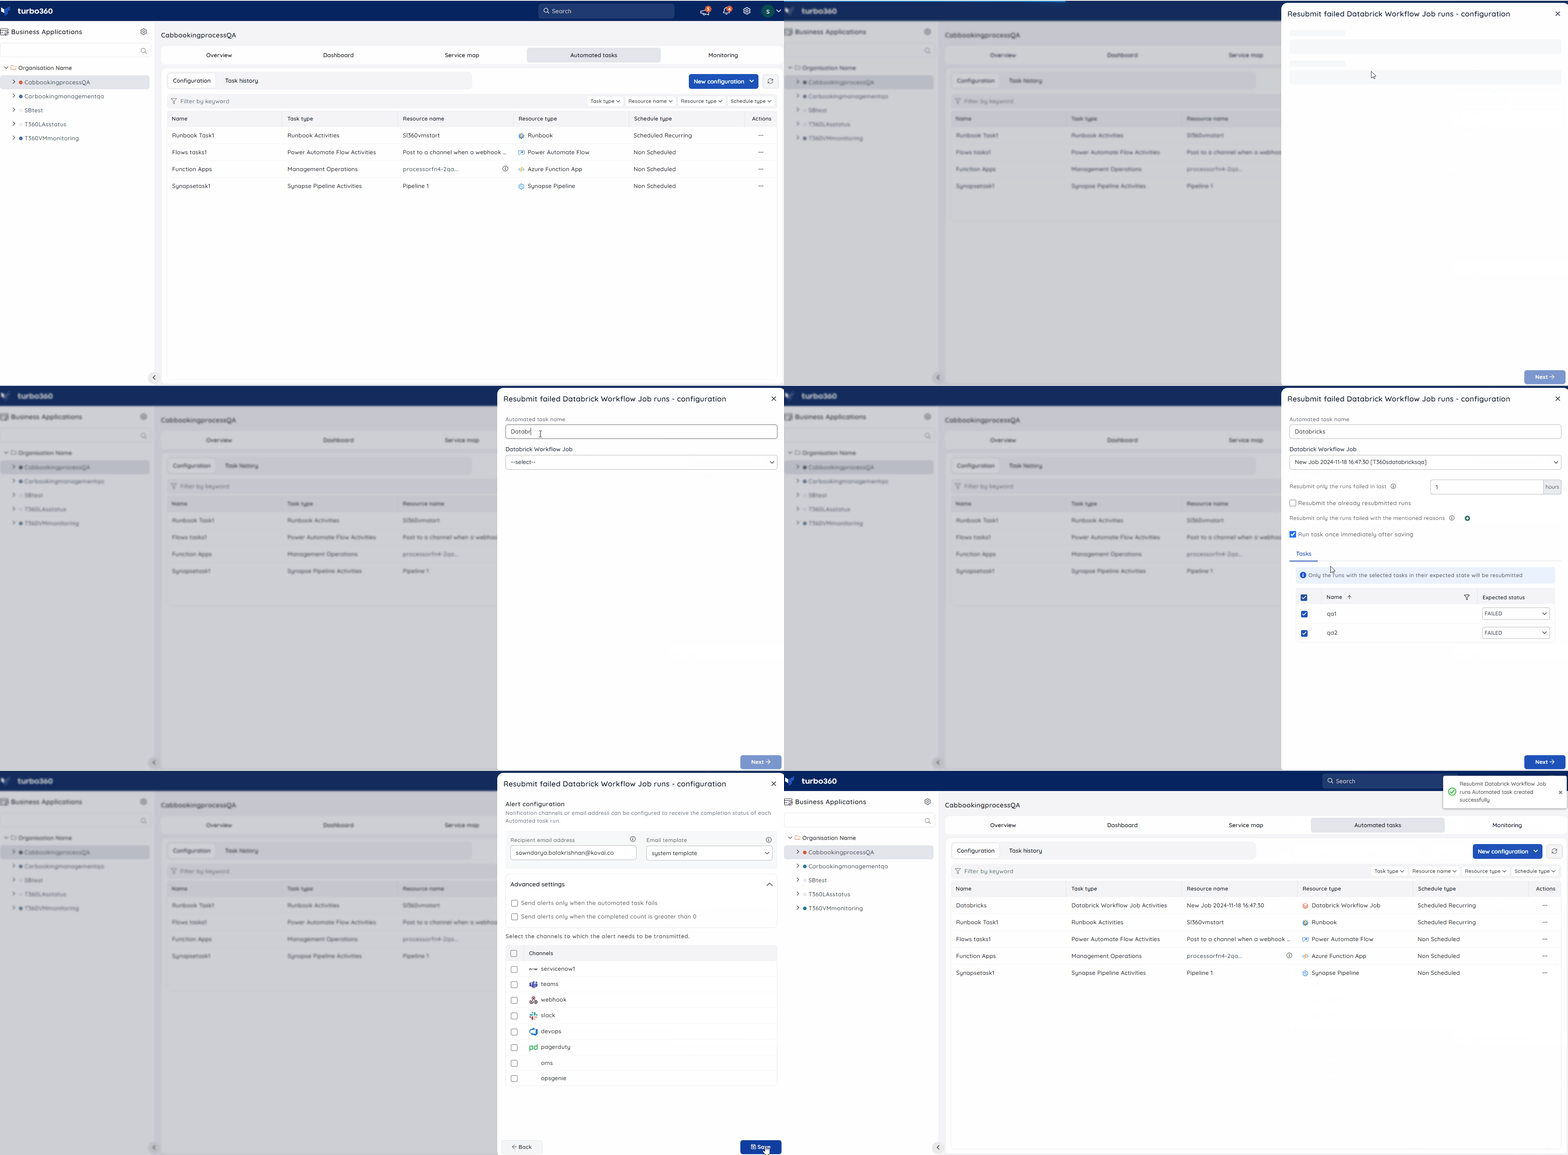
The Management operation in Automated task configuration lets you schedule a task to automatically update the state of pipelines within a Delta Live Table. Use this when pipeline state changes need to happen on a recurring schedule rather than manually.
- Go to the Automated tasks section in a Business Application that contains the Delta Live Table resource.
- Click New configuration -> Management operations.
- Choose DataBrick Workflow Delta Live Table from the Resource type dropdown.
- Configure the desired pipelines and resource status.
- Schedule the task if necessary.
- Save the task.
Run management (Workflow Job)
Databricks Workflows coordinate data processing, machine learning, and analytics pipelines on the Databricks Data Intelligence Platform, including Databricks Jobs for executing non-interactive code and Delta Live Tables for ETL pipelines.
- Run now — trigger a Workflow Job directly from Turbo360, customizing job parameters for the corresponding Workbook's language. Use this when a job needs to run on demand outside its schedule.
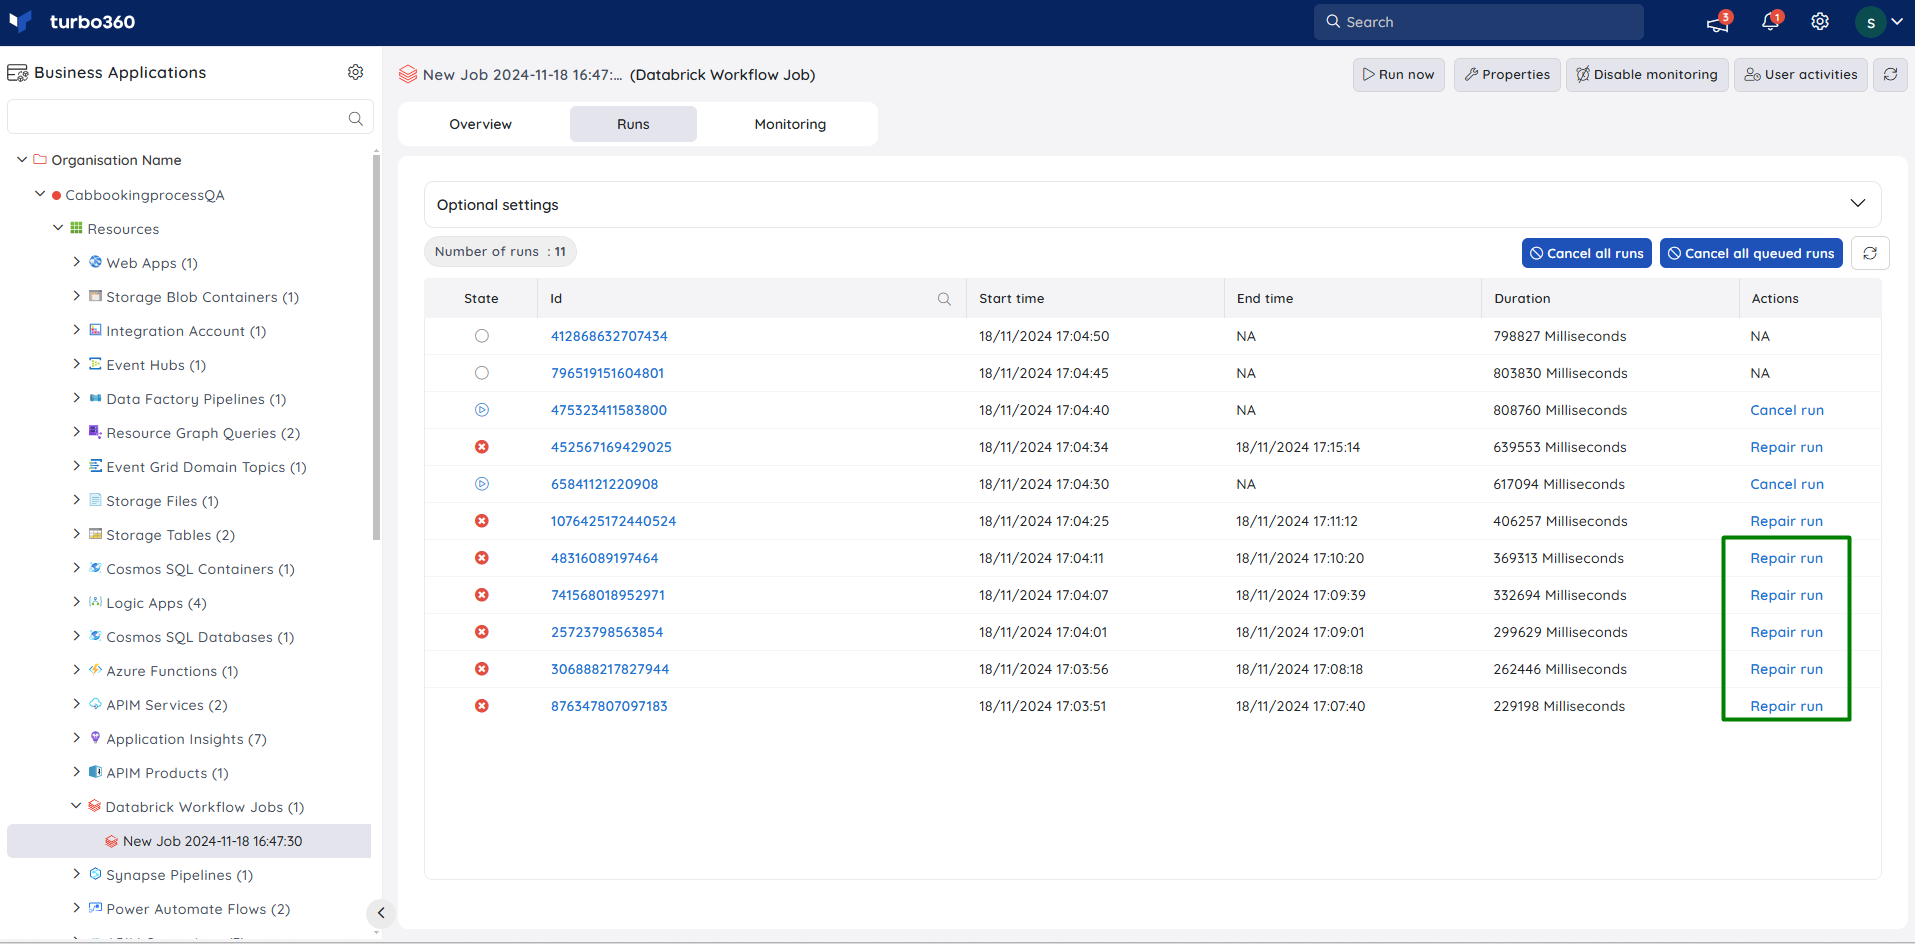
- Repair run — repair a failed run with a preferred key-value pair matching the Workbook's language, optionally triggering a full refresh on the Delta Live Table pipeline. Use this when a run failed due to a transient or correctable issue.
- Cancel run — cancel an ongoing or queued run. Use this when a run needs to be stopped before completion.
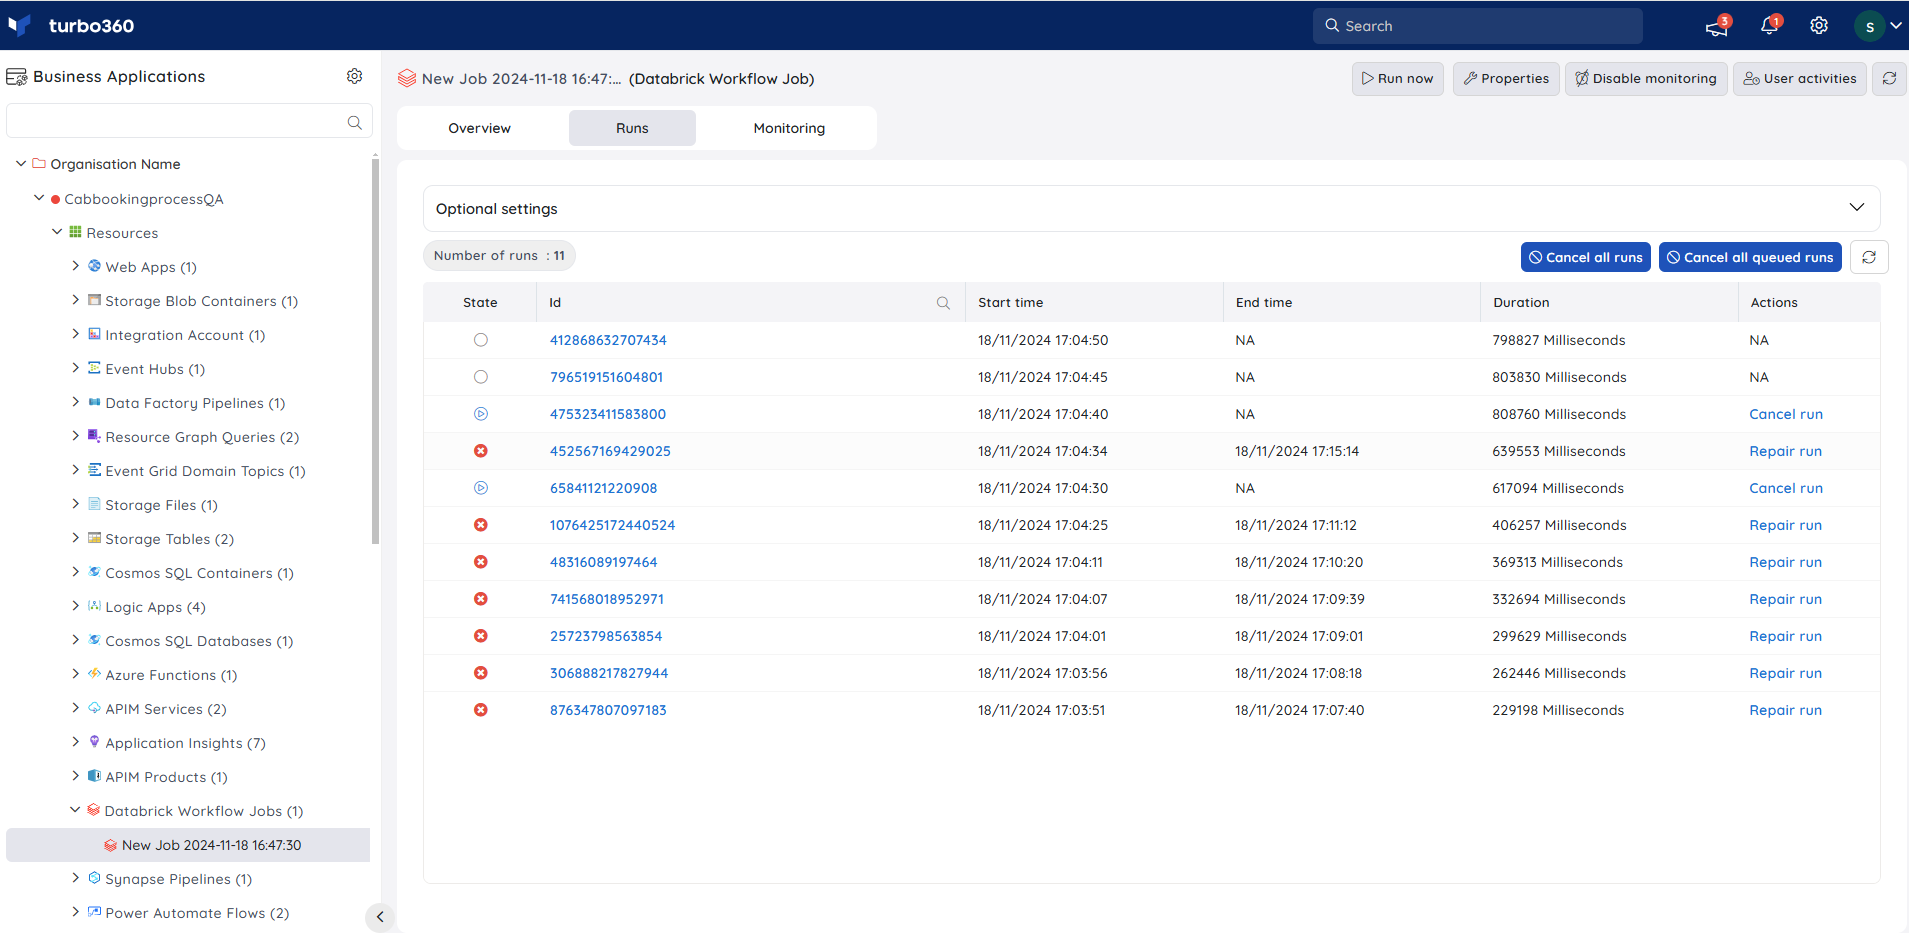
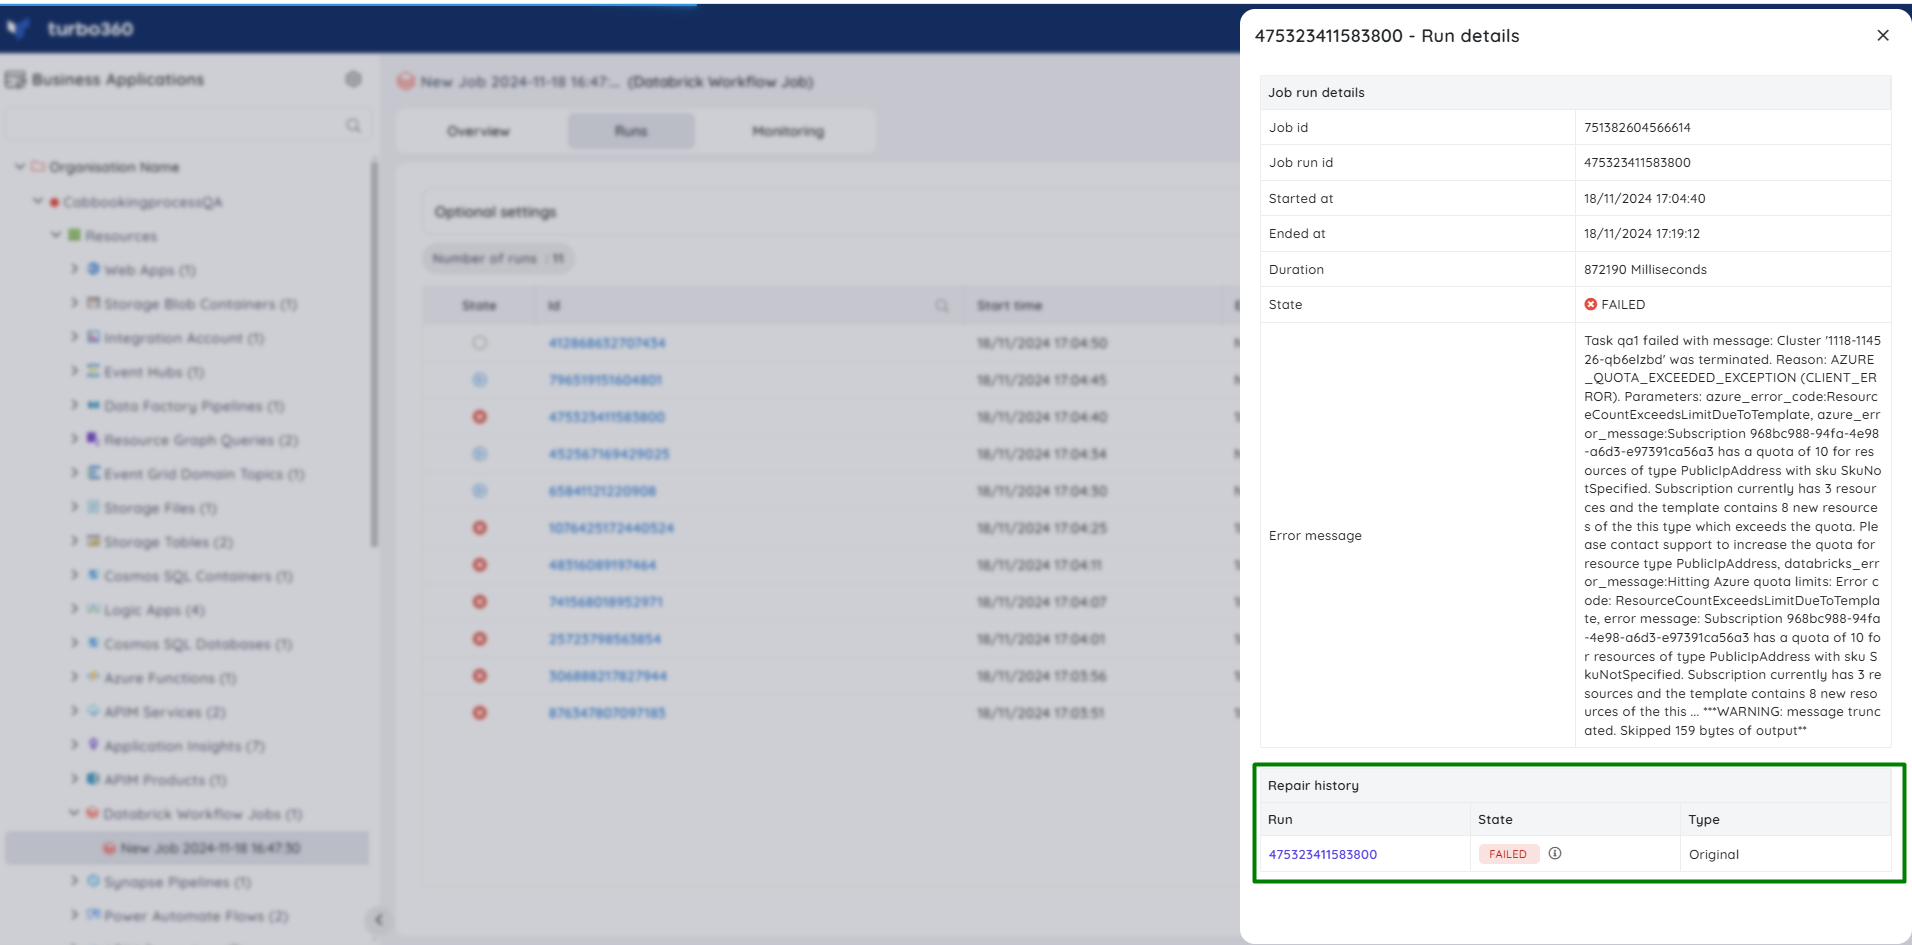
Repair history is accessible by clicking the relevant failed run identifier.
Bulk operations
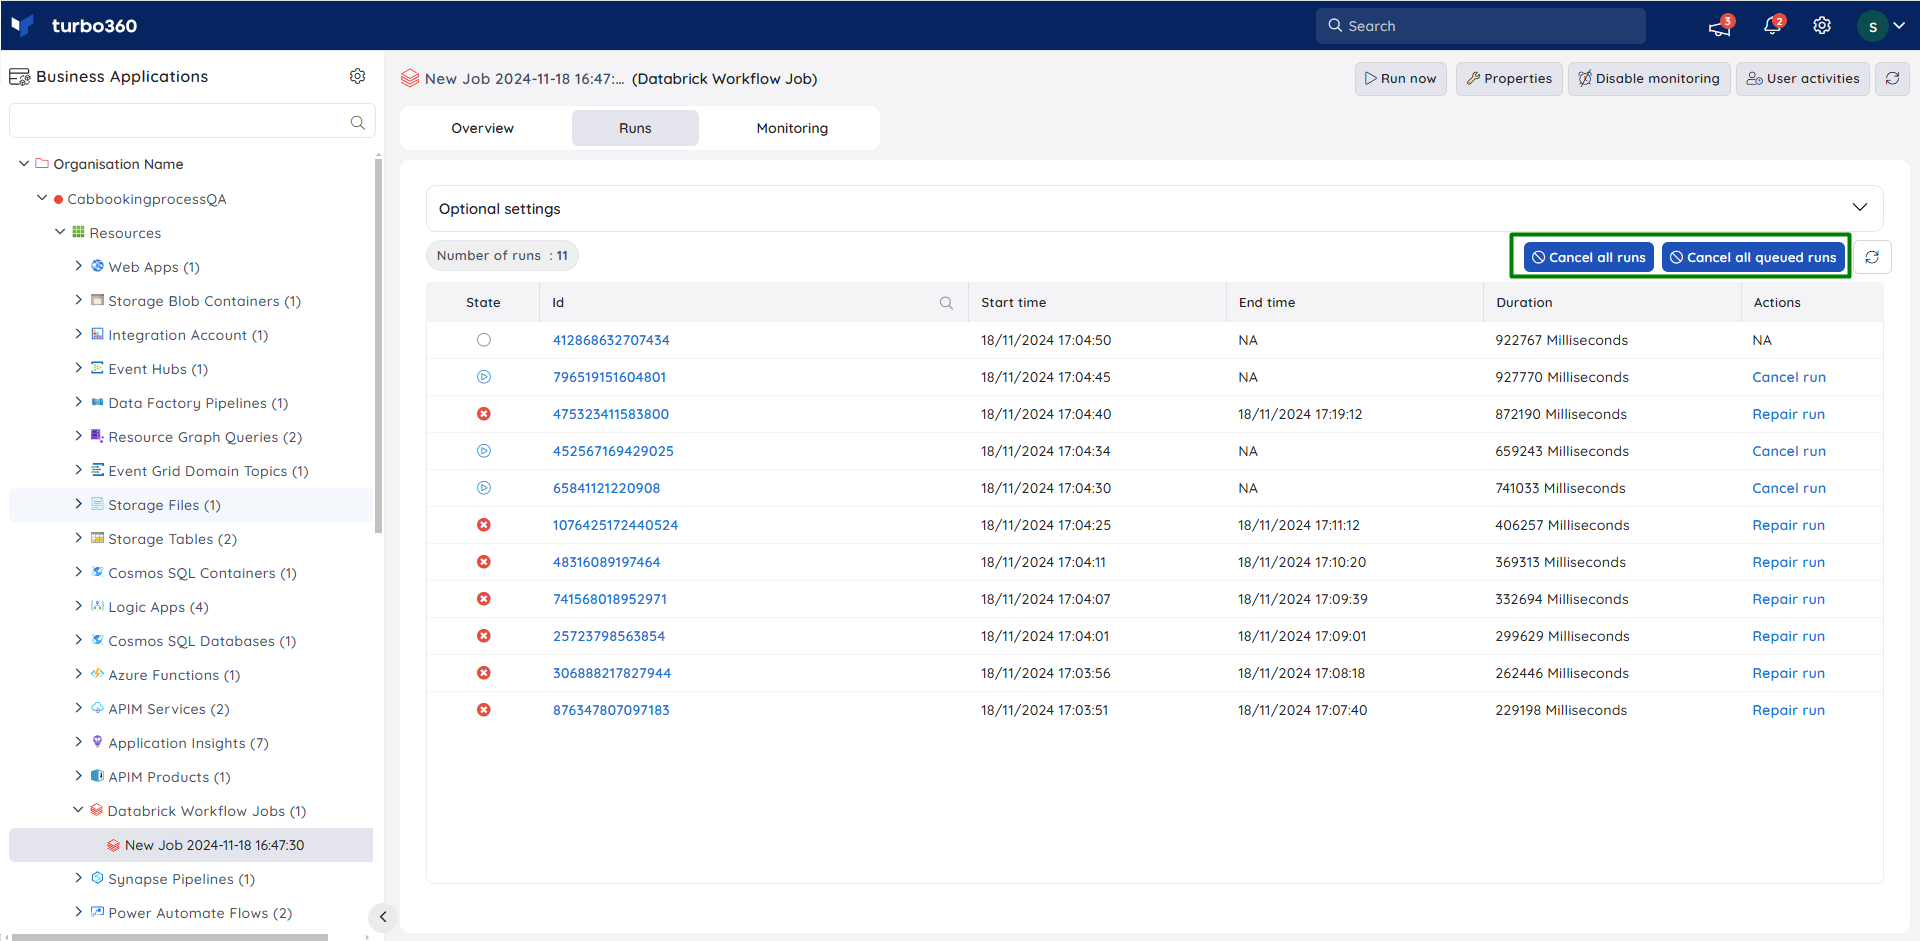
- Bulk cancel — cancel multiple ongoing or queued job runs in a single action from the Runs section. Use this when several runs need to be stopped together, such as after identifying a faulty deployment, rather than cancelling each one individually.
Monitoring
Databricks resources support state, failure, and duration monitoring rules, configured under each resource's Monitoring -> Rules tab.
Monitoring rules are saved per resource, and the monitoring state is reflected after every monitoring cycle.
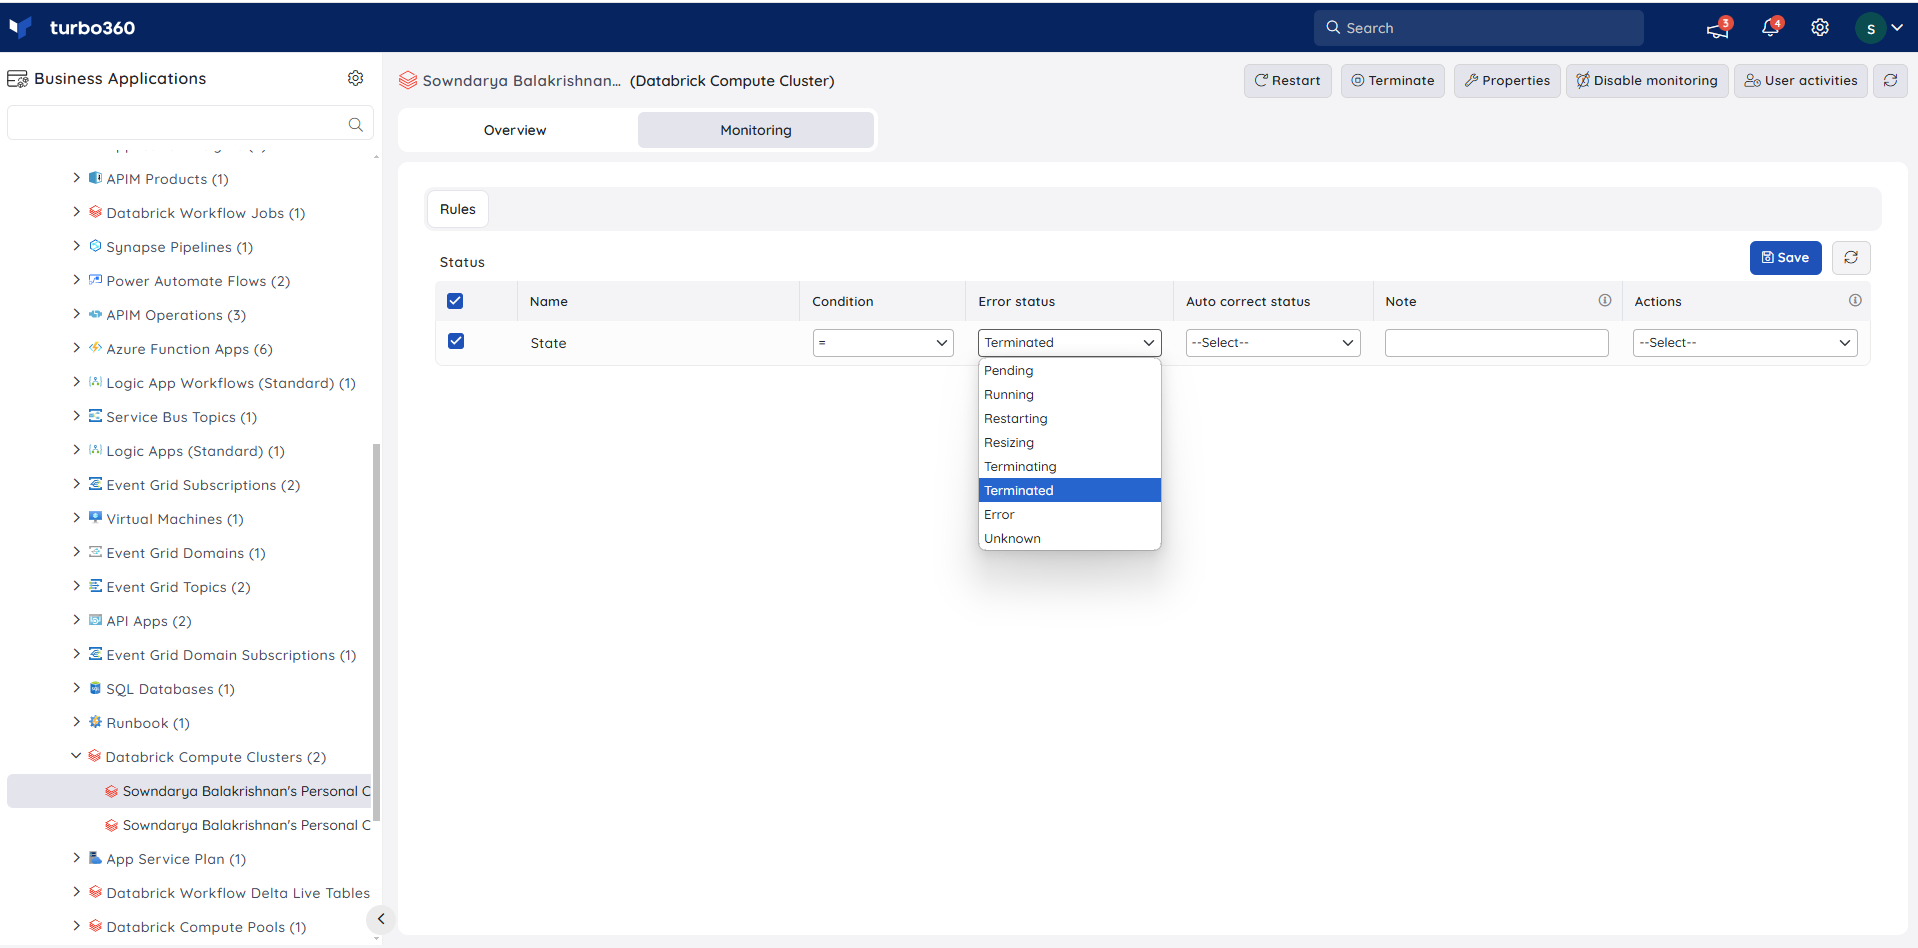
State monitoring (Compute Cluster)
Tracks the health state of a compute cluster. Use this when you need to be alerted, or auto-corrected, when a cluster enters an unexpected state.
- Navigate to Databrick Compute Cluster -> Monitoring -> Rules.
- Configure the threshold value for the cluster state to determine the health state.
- Click Save.
An auto-correct status can be specified to automatically change the cluster state in the event of a violation.
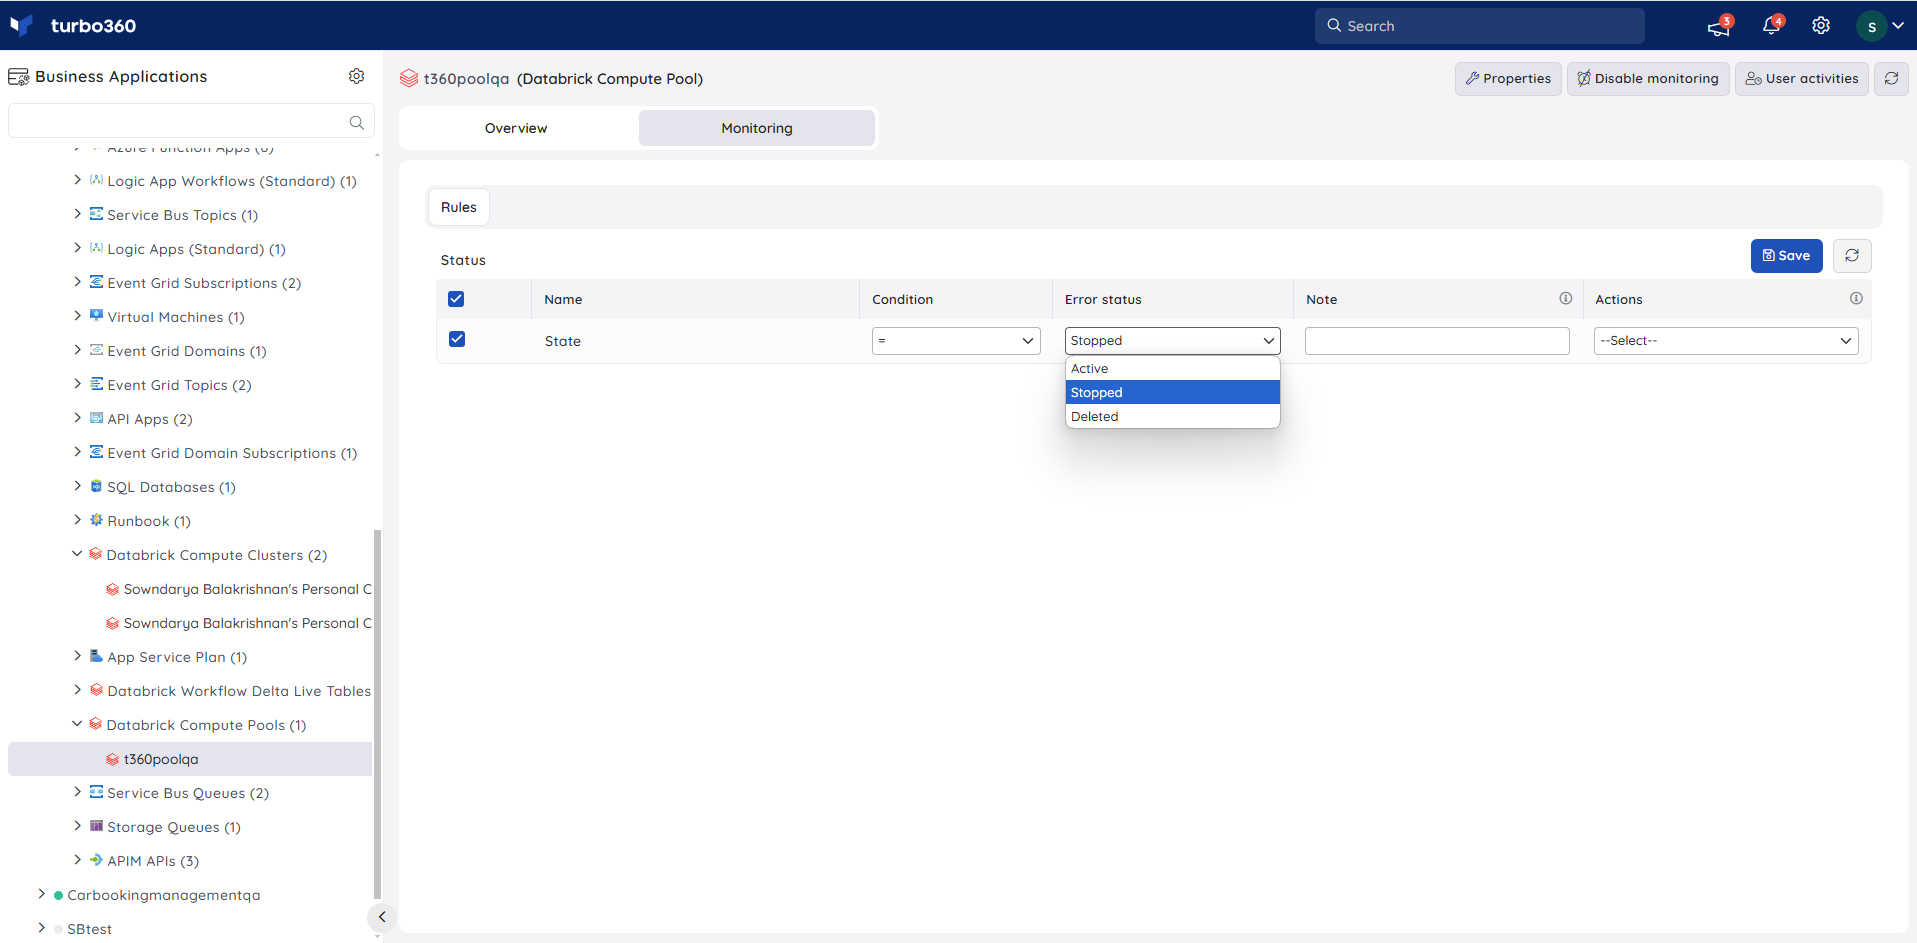
State monitoring (Compute Pool)
Instances that are idle and available for use in specific Databrick Workflows are referred to as Databrick compute pools. This rule tracks their health state.
- Navigate to Databrick Compute Pool -> Monitoring -> Rules.
- Configure the threshold value for the compute pool state to determine the health state.
- Click Save.
State monitoring (Delta Live Table)
Tracks the health state of a Delta Live Table pipeline. Use this when you need to be alerted if a pipeline enters an unexpected state.
- Navigate to Databrick Delta Live Table -> Monitoring -> Rules.
- Configure the threshold value for the pipeline state to determine the health state.
- Click Save.
Failure monitoring (Workflow Job)
Tracks failed job runs. Use this when you need to be alerted as soon as a job run fails.
- Navigate to Databrick Workflow Job -> Monitoring -> Rules.
- Select Failed Job Runs under Failures and configure the threshold values.
- Click Save.
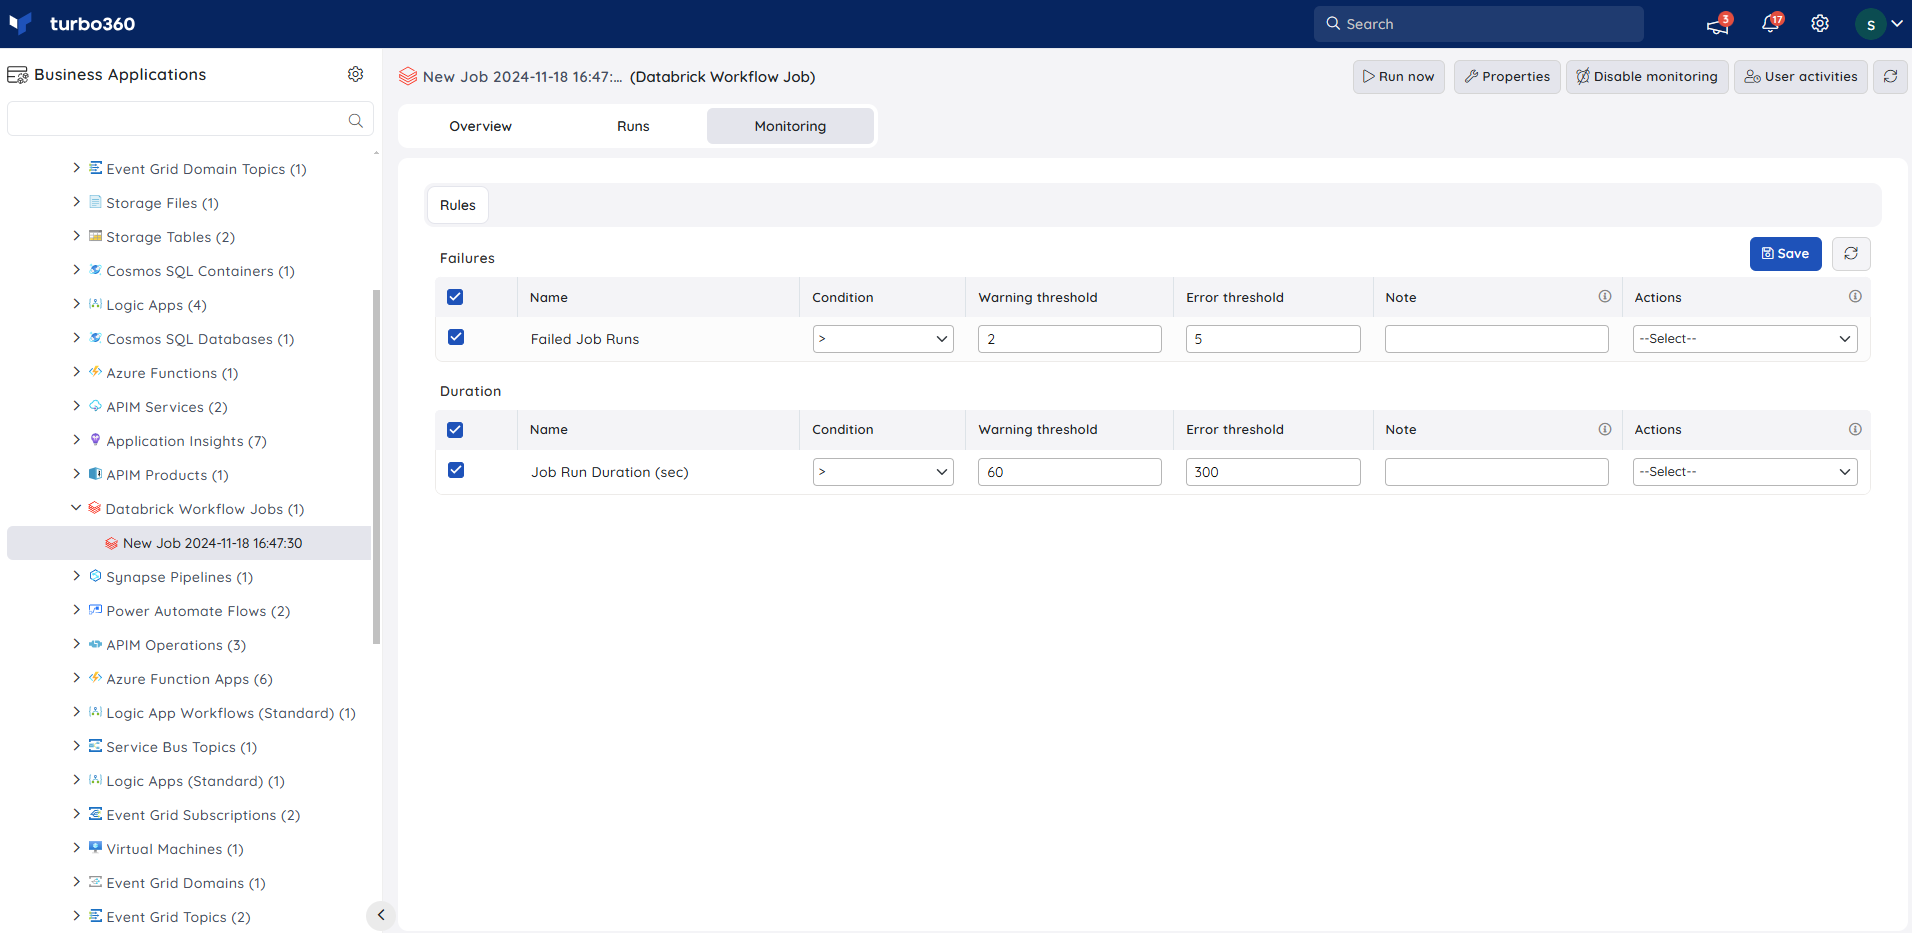
Duration monitoring (Workflow Job)
Tracks job run duration. Use this when a job running longer than expected indicates a stuck or degraded process.
- Navigate to Databrick Workflow Job -> Monitoring -> Rules.
- Select Job Run Duration under Duration and configure the threshold values.
- Click Save.
Troubleshooting
- Service principal cannot access Databricks resources
Cause: The service principal was not added to the admin group in the Databricks Workspace.
Fix: Complete the Prerequisites steps to add the service principal under Identity and access -> Groups -> admin. - Start, Stop, or Restart operation fails
Cause: The target cluster or pipeline is in a transitional state.
Fix: Wait for the current state transition to complete, then retry the operation. - Repair run option is unavailable
Cause: The selected run did not fail, or the Reprocess permission is not granted to the role.
Fix: Confirm the run status is Failed and that the role has the Reprocess permission. - State monitoring rule does not auto-correct
Cause: No auto-correct status was configured on the rule.
Fix: Edit the rule and specify an auto-correct status. - Monitoring state appears stale
Cause: The displayed state reflects the last completed monitoring cycle, not real time.
Fix: Allow the next monitoring cycle to complete before re-checking the state.
Related articles
Was this article helpful?