

Event Hub
- 05 Aug 2026
- 3 Minutes to read
- Print
- DarkLight
- Download PDF
Event Hub
- Updated on 05 Aug 2026
- 3 Minutes to read
- Print
- DarkLight
- Download PDF
Article summary
Did you find this summary helpful?
Thank you for your feedback!
Overview
Azure Event Hub is a highly scalable data streaming platform and event ingestion service that can receive and process millions of events per second. Events, data, and telemetry generated by distributed software and devices can be processed and stored by Event Hubs. Event Hubs serve as the on-ramp for Big Data because of their ability to provide publish-subscribe capabilities with low latency and at massive scale.
Business value
Managing and testing Event Hub status and event flow from Turbo360 gives you a single place to control resource state and verify ingestion, reducing the time to detect and resolve streaming pipeline issues.
How it works
- Once an Event Hub is associated with a Business Application, its status, event flow, and monitoring become directly manageable from Turbo360.
- Any real-time analytics provider or batching/storage adapter can be used to transform and store data sent to an Event Hub.
Permissions
Access to Event Hub actions is controlled through RBAC when adding a role to a Business Application.
| Permission | Description |
|---|---|
| Read | View Event Hub details, status, and monitoring rules. |
| Manage | Update resource status, send test events, and configure monitoring rules. |
Operations
Turbo360 lets you update Event Hub status and send test events directly from the resource, without switching to the Azure portal.
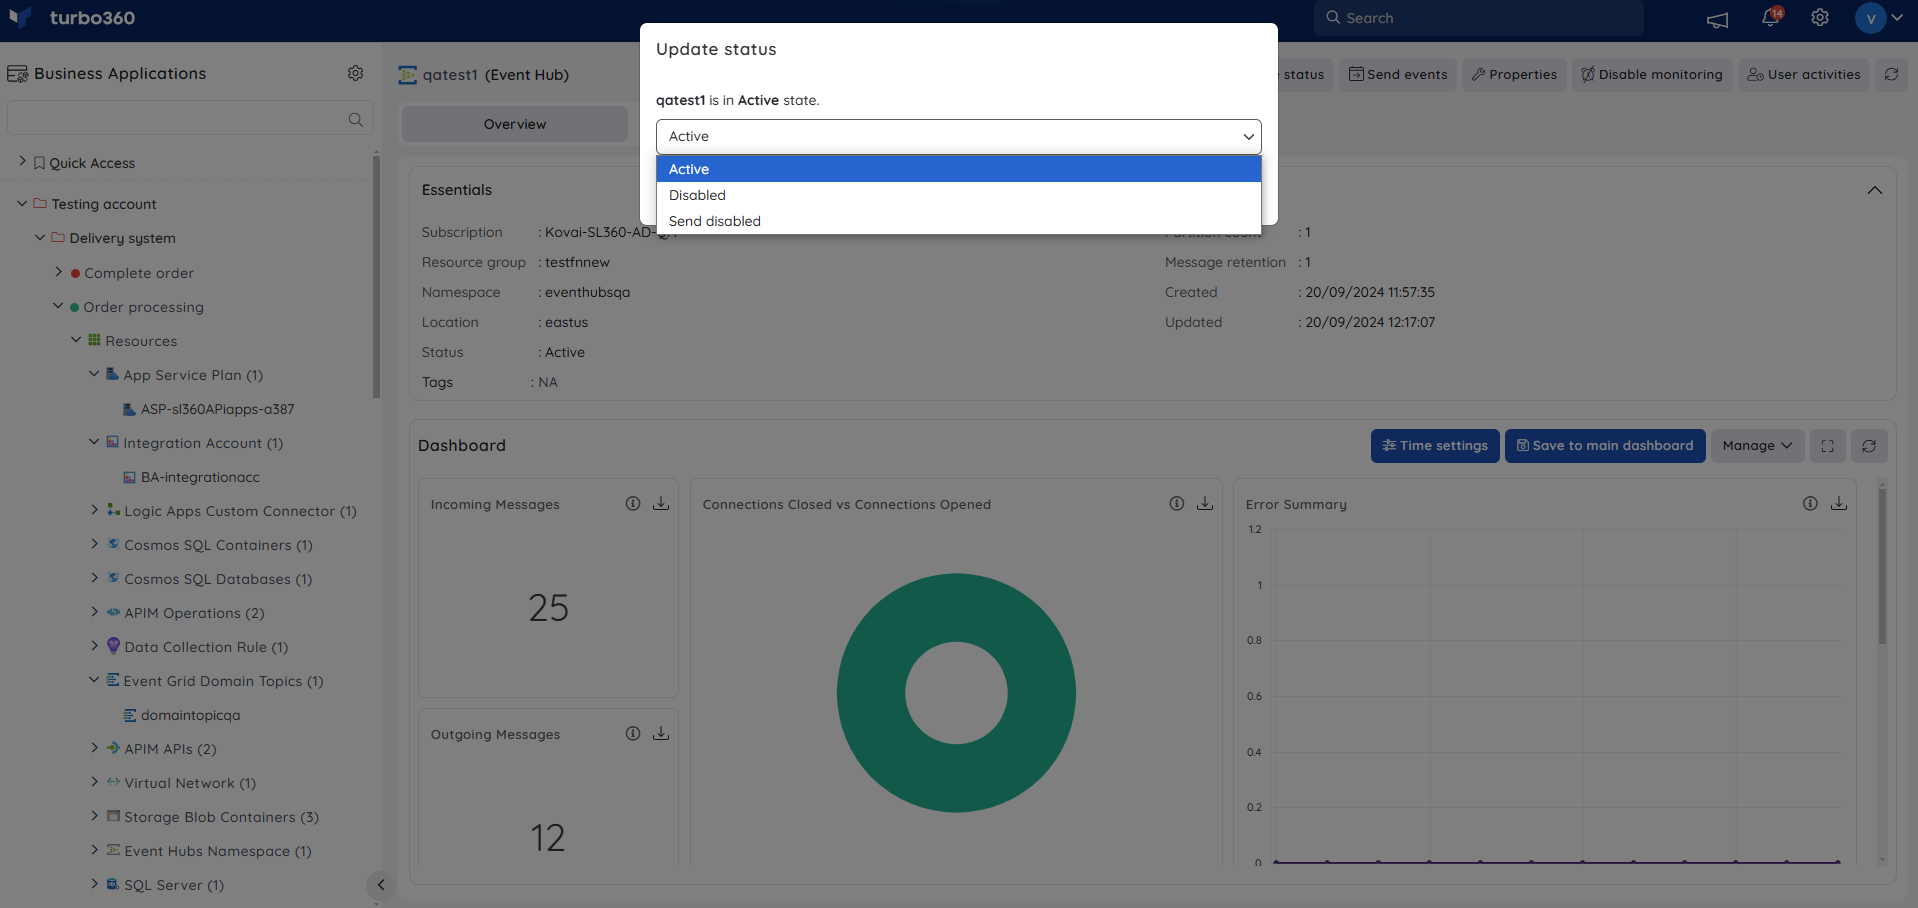
Update status
- Update status — change the status of the Event Hub resource by selecting one of the available options. Use this when the resource state needs to be changed as part of incident response or maintenance.
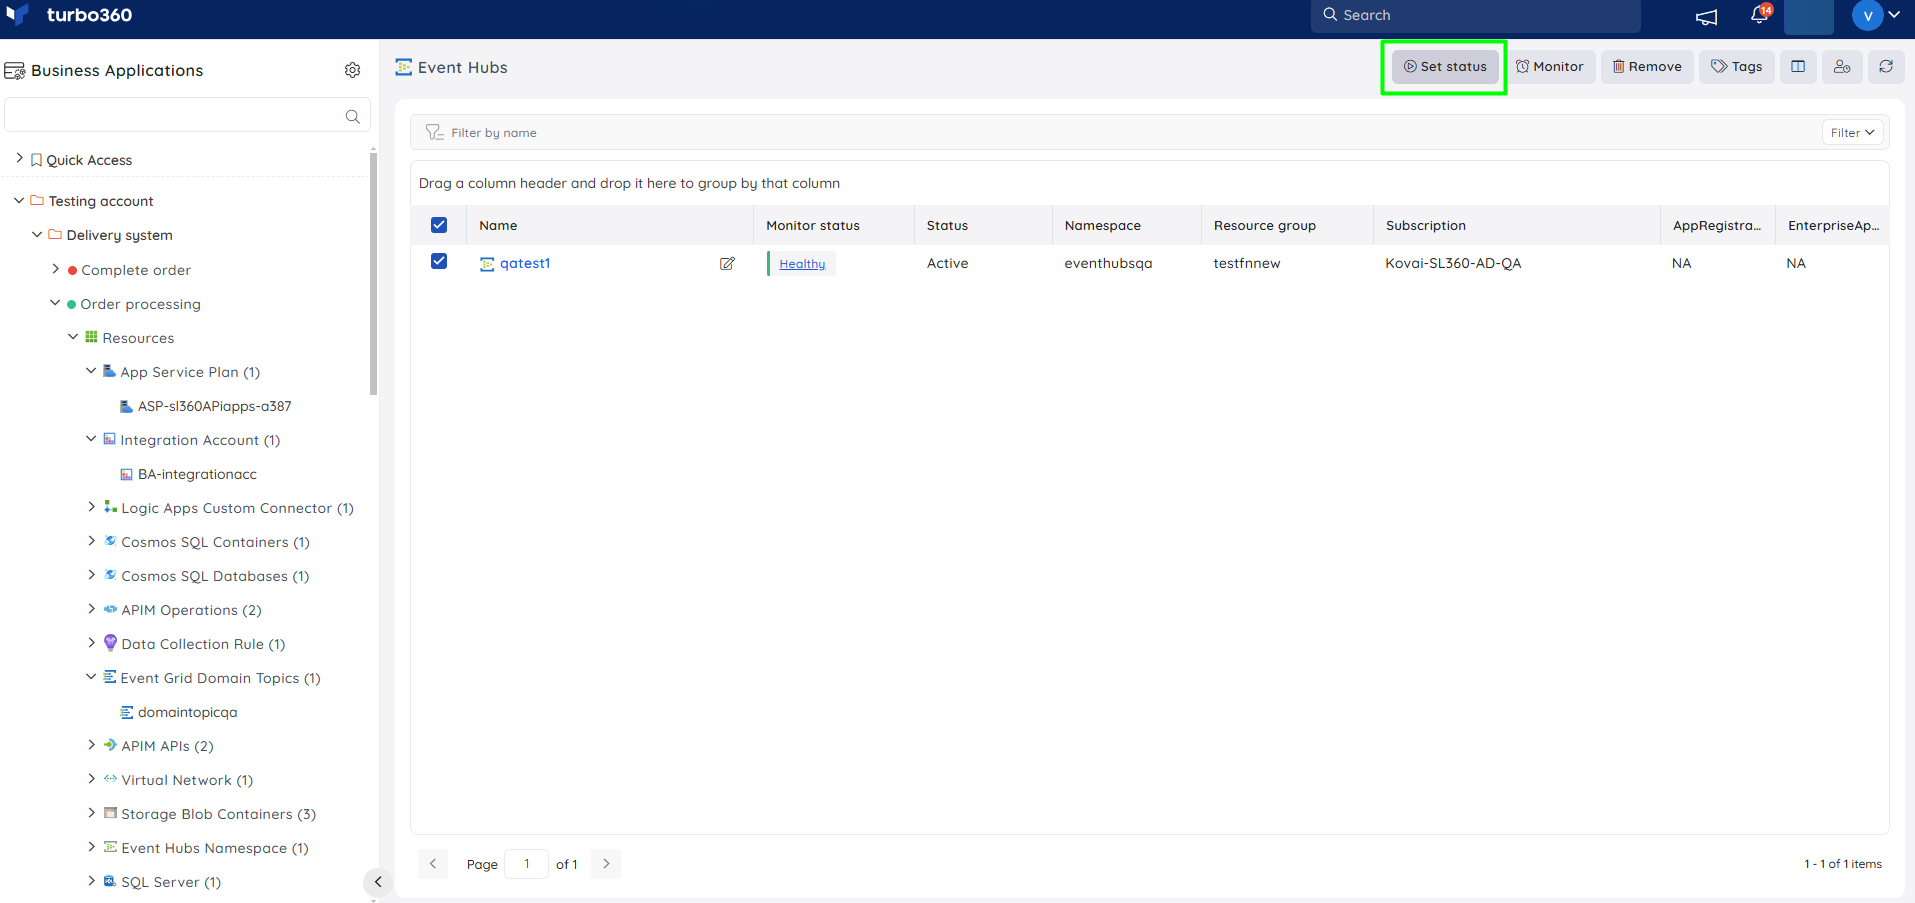
Bulk operations
- Bulk status update — update the status for multiple Event Hubs simultaneously. Use this when several Event Hubs need the same status change, such as during planned maintenance, rather than updating each one individually.
Sending test events
- Inline task to send events — quickly send events to the Event Hub by providing Event message, Key, Value, Event data count, and an optional configuration name to save it. Use this when you need to verify ingestion without configuring a full automated task.
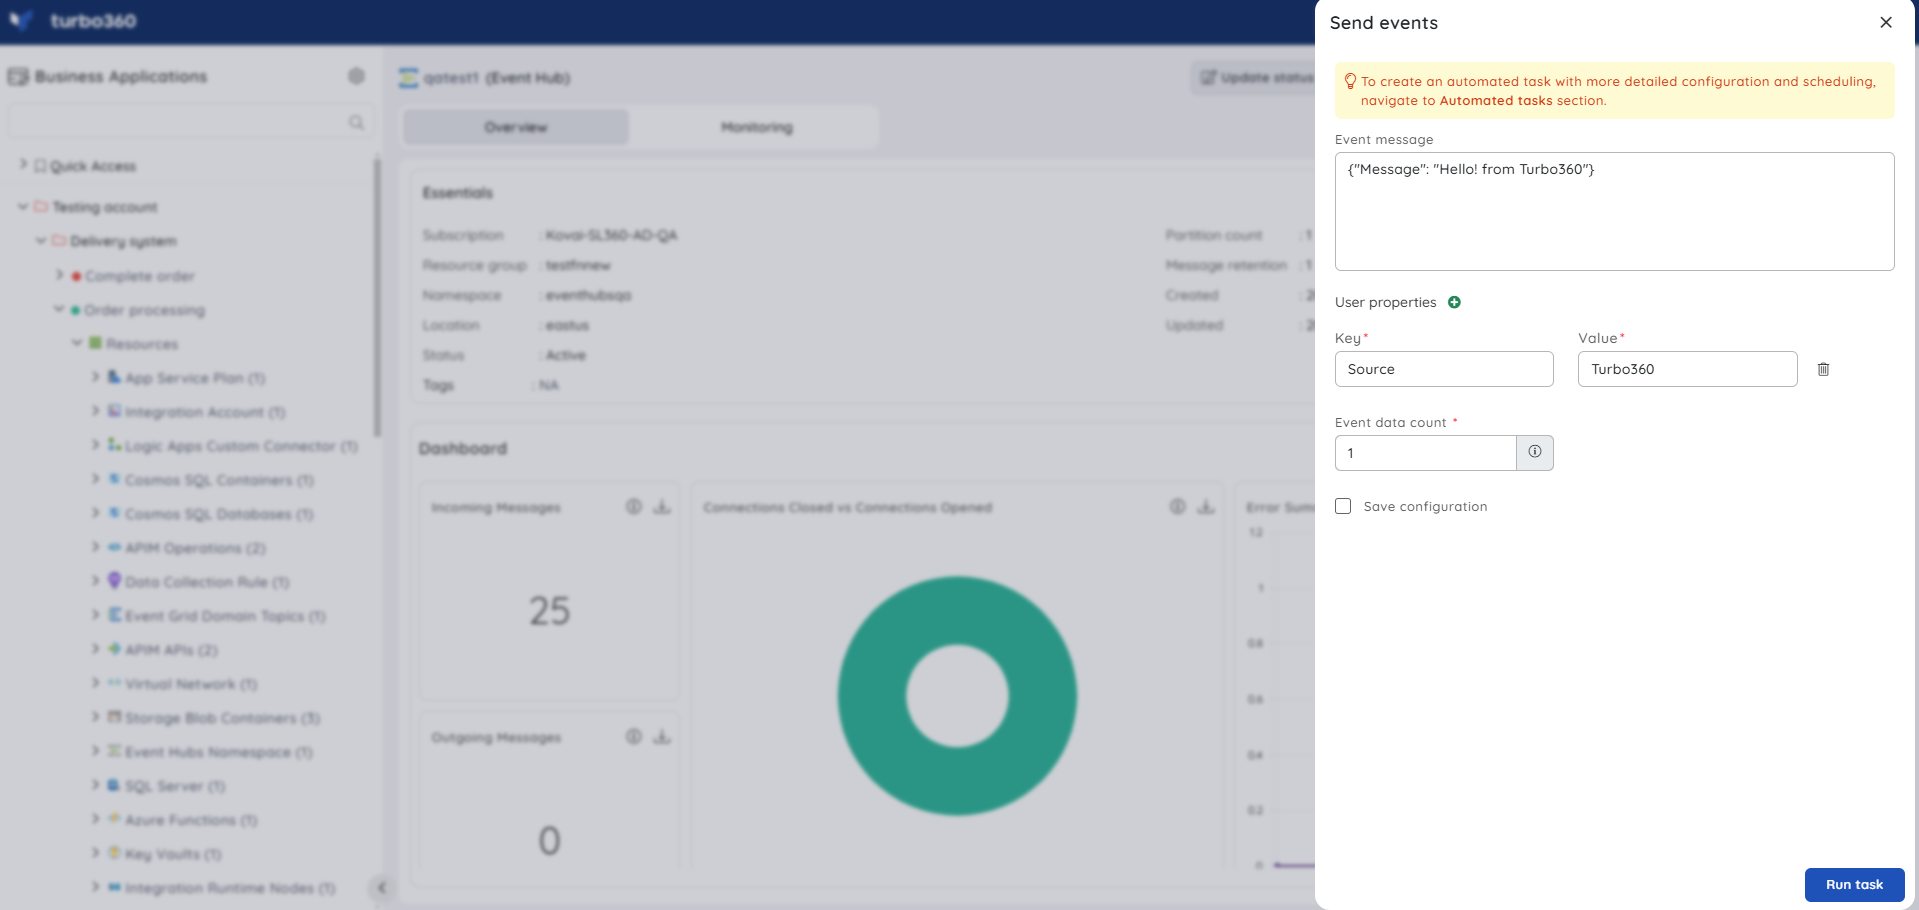
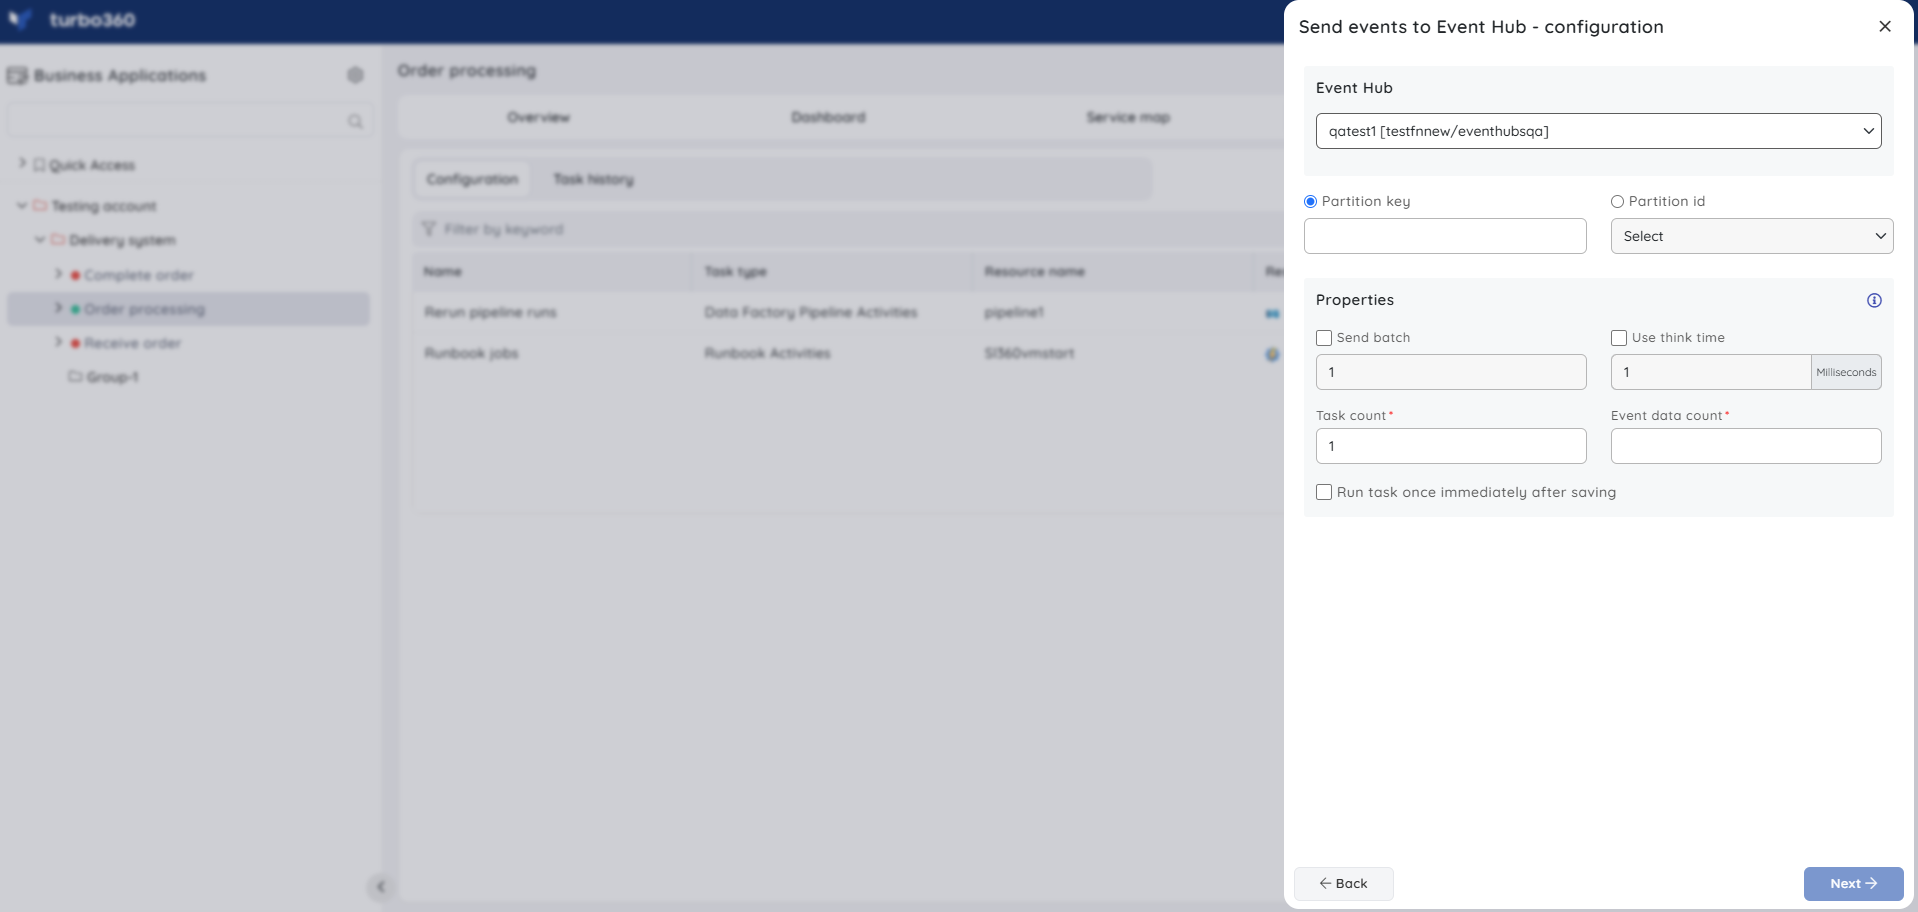
Task status can be viewed under Automated tasks -> Task history.
The Automated task feature is also useful when a single Azure Subscription contains multiple Event Hubs and you need to send events to a specific one.
Resource dashboard
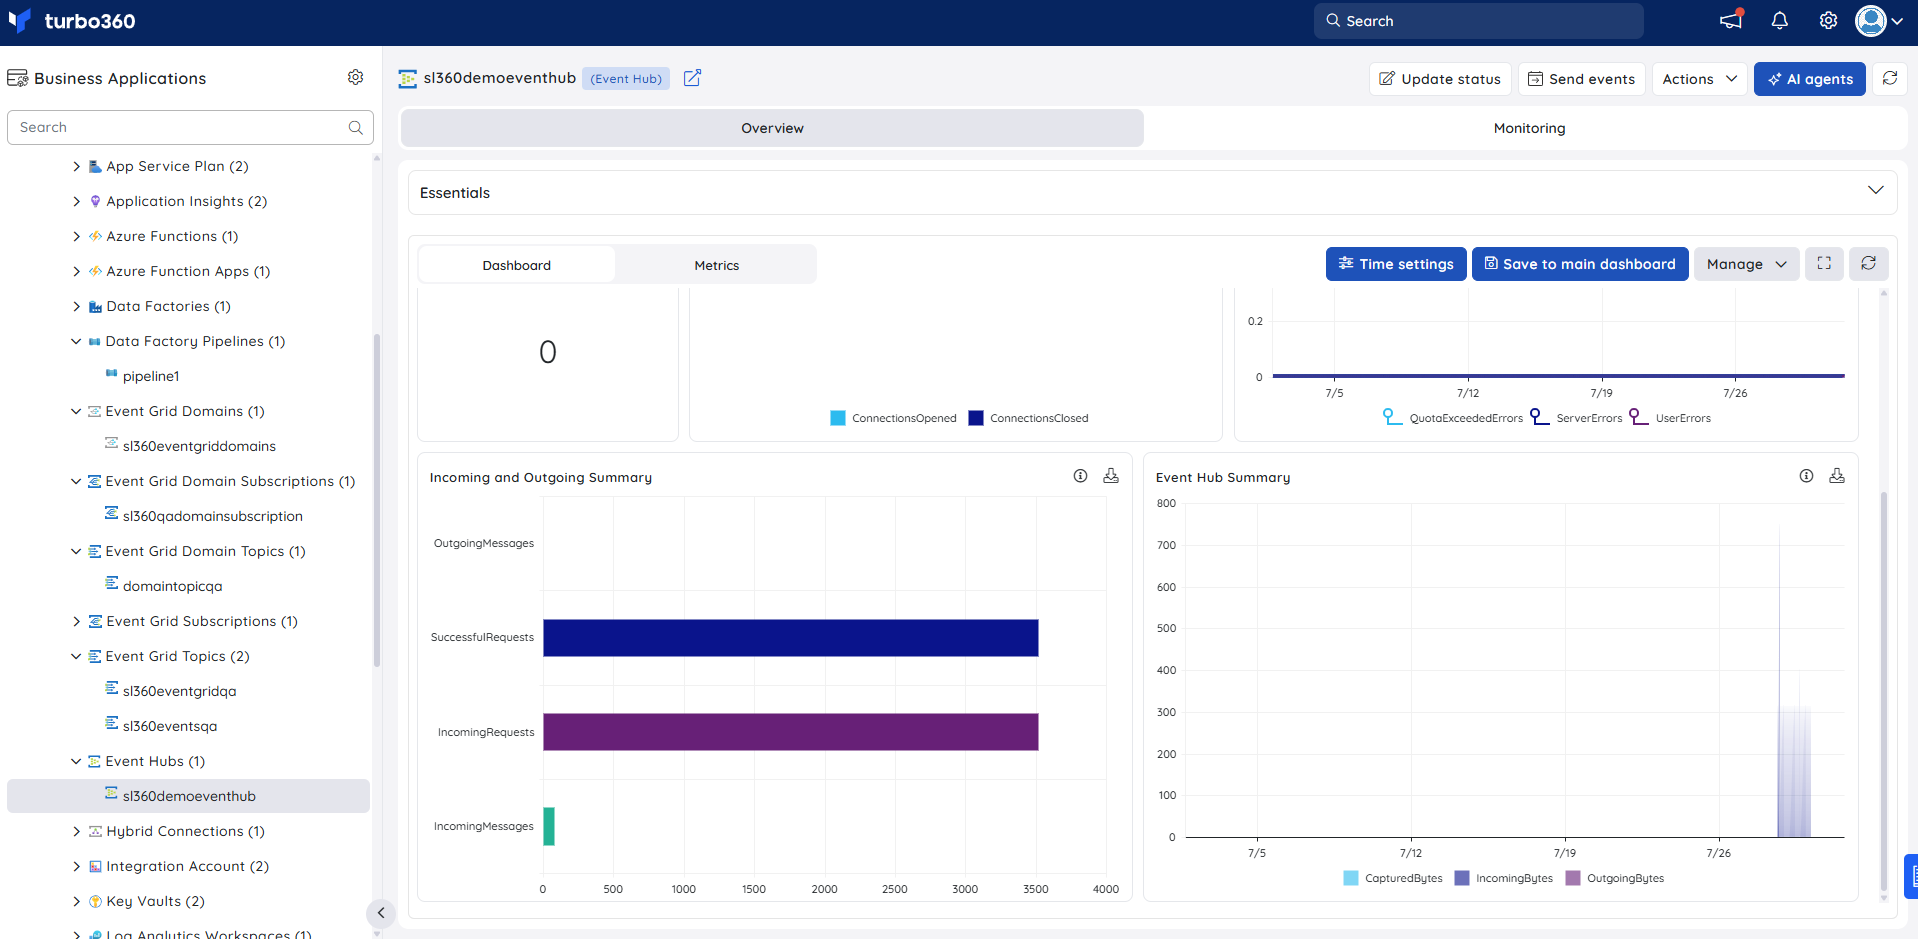
The Event Hub dashboard surfaces message throughput and connection signals so you can spot ingestion or connectivity issues without leaving Turbo360.
| Widget | What it shows |
|---|---|
| Incoming Messages | Volume of messages received by the Event Hub. |
| Connections Closed vs Connections Opened | Compares connection churn to spot instability. |
| Error Summary | At-a-glance summary of resource errors. |
| Outgoing Messages | Volume of messages delivered out of the Event Hub. |
| Incoming and Outgoing Summary | Combined view of message throughput in both directions. |
| Event Hub Summary | At-a-glance Event Hub health and configuration summary. |
Metrics
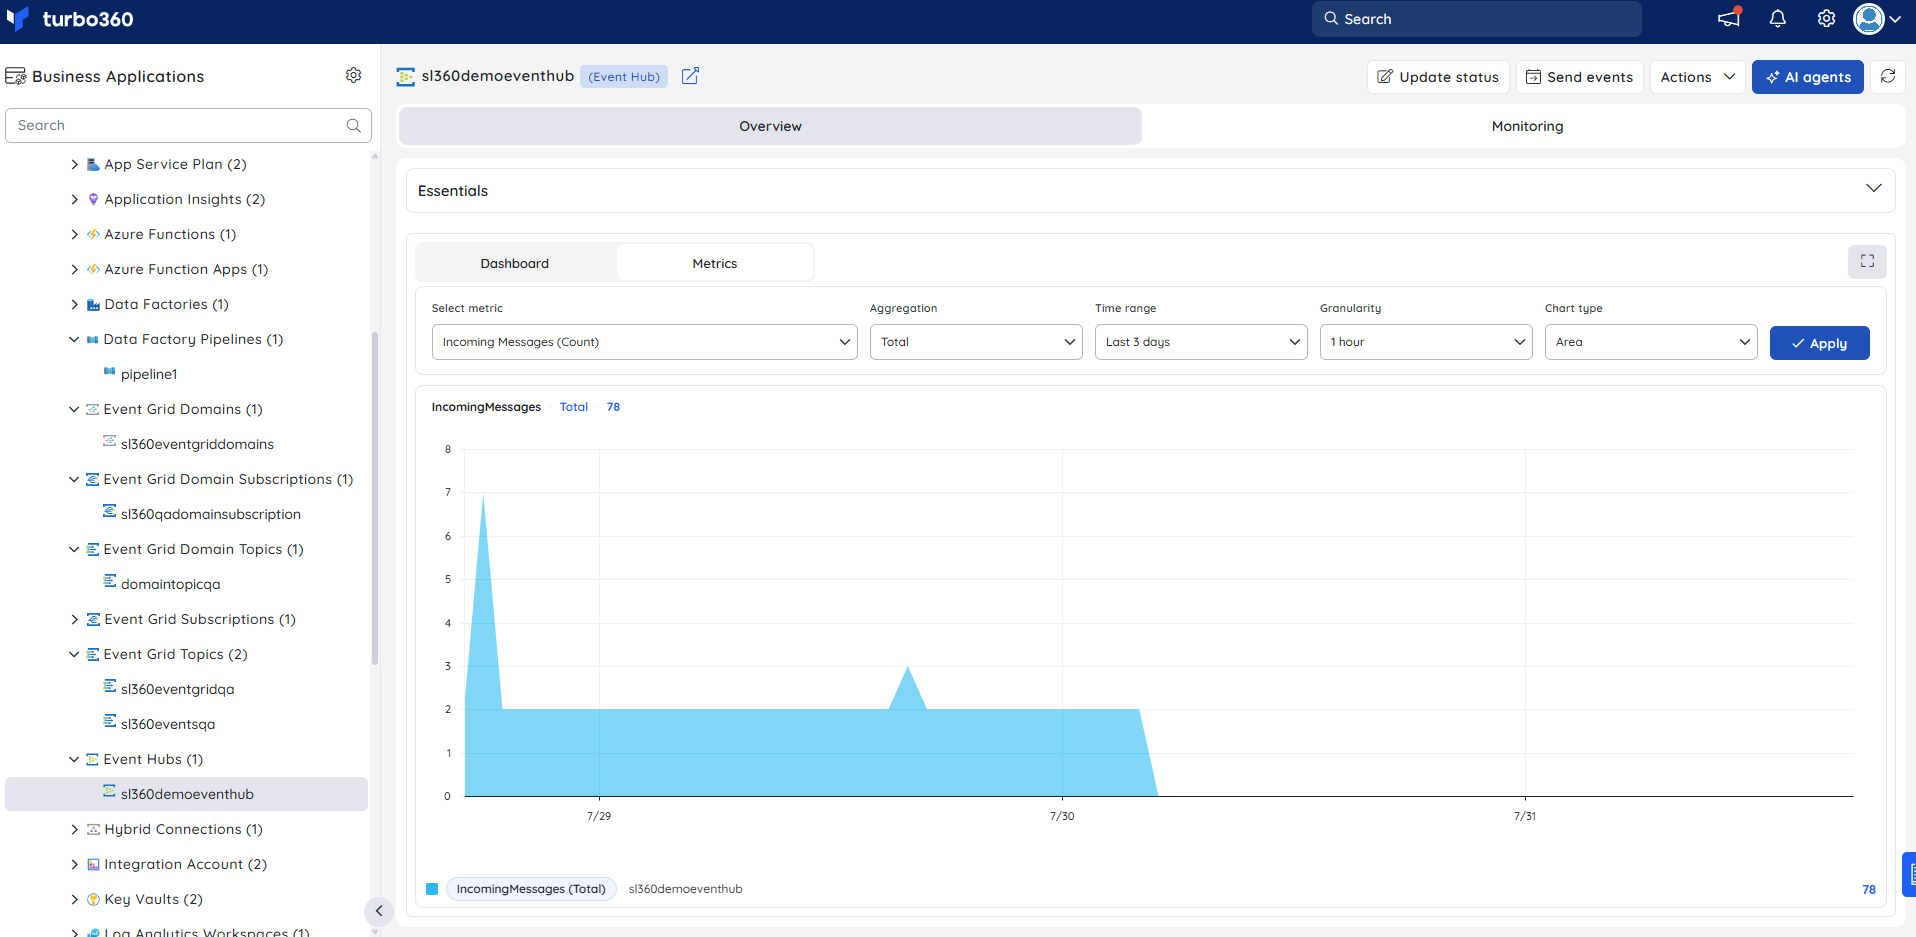
The Metrics tab surfaces throughput and connection data for Event Hub, giving you visibility into streaming pipeline health and ingestion trends. Use the Metrics tab to identify message volume drops or connection instability that precede delivery failures, and to confirm that throughput normalizes after a status change or maintenance window.
You can add, remove, or reconfigure widgets to focus on the metrics most relevant to your support scenario.
Monitoring
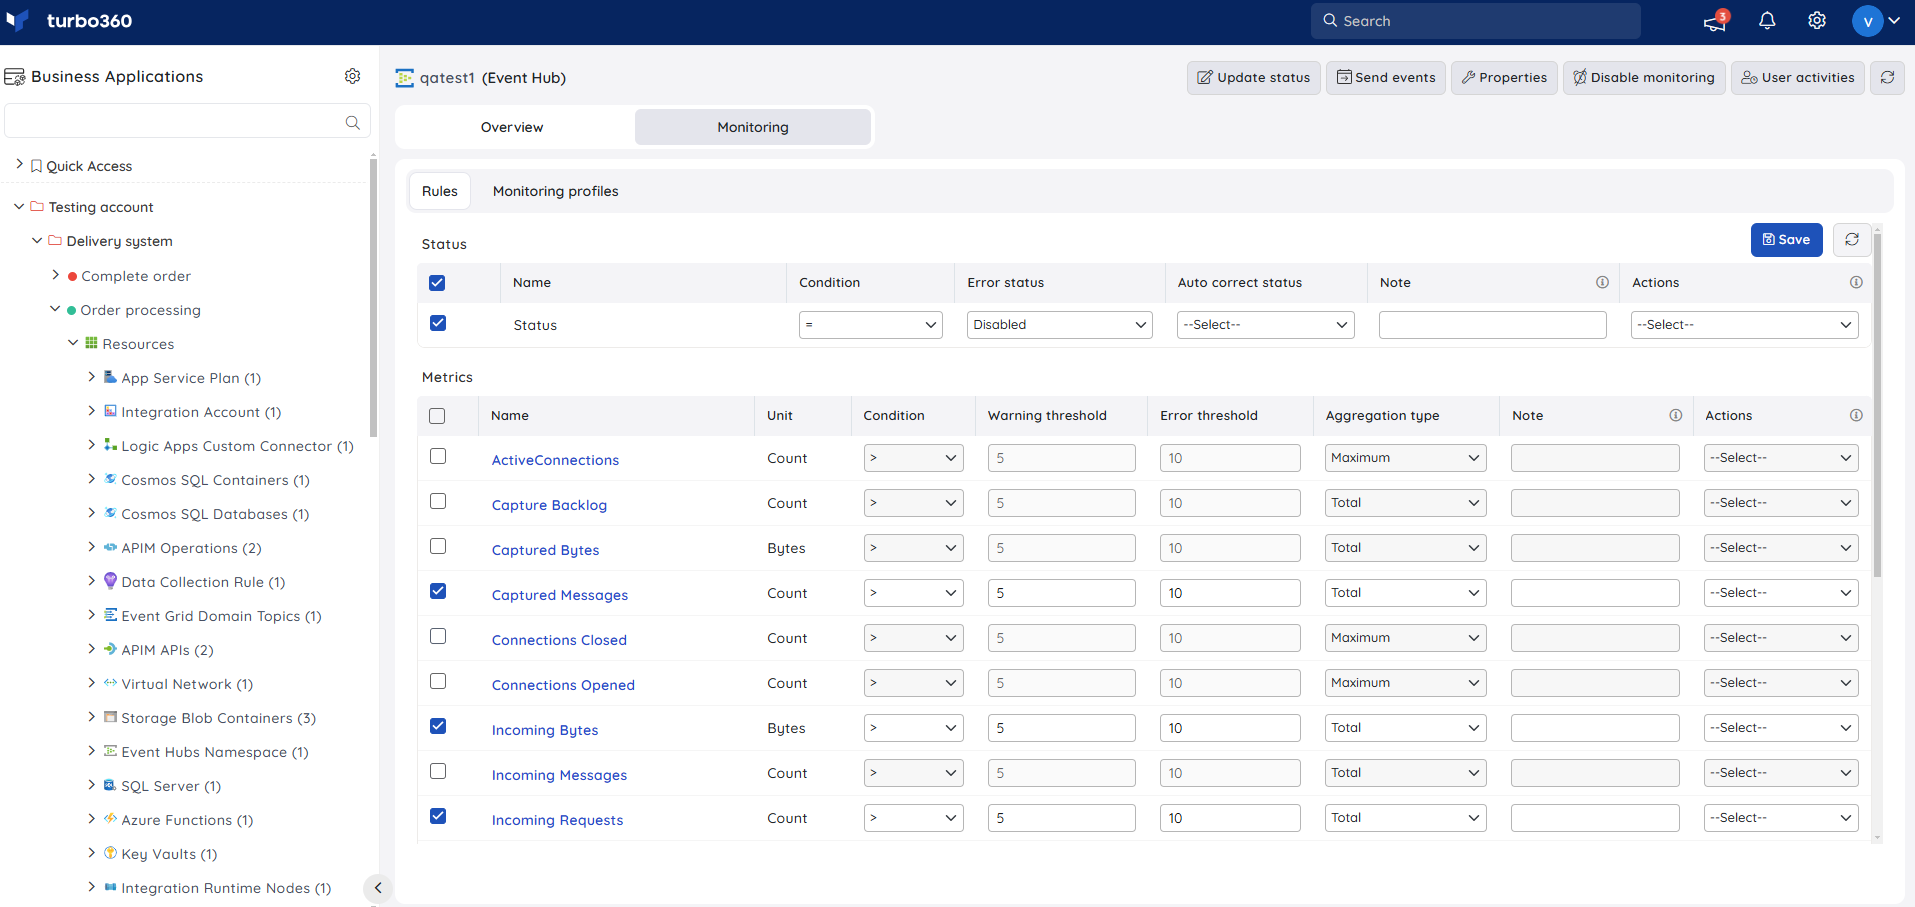
Event Hub supports metric monitoring rules, configured under Event Hub -> Monitoring.
Monitoring rules are saved per resource, and the monitoring state is reflected after every monitoring cycle.
Metric monitoring
Tracks resource metrics against a configured threshold. Use this when you need to be alerted if incoming or outgoing message volume, or another metric, exceeds expected bounds.
- Navigate to Event Hub -> Monitoring to configure the monitoring rules for Event Hubs.
- Select the necessary monitoring metrics and configure the threshold values.
- Click Save.
The threshold values can be provided with any metric name; the rule is violated when the configured threshold value is met.
Troubleshooting
- Status update fails
Cause: The Event Hub is in a transitional state, or the role lacks the Manage permission.
Fix: Wait for the current state transition to complete, or confirm the role has Manage access, then retry. - Bulk status update only applies to some Event Hubs
Cause: One or more selected Event Hubs were in an incompatible state for the requested status change.
Fix: Review the bulk operation result and retry the status change for the remaining Event Hubs individually. - Inline task to send events does not appear in Task history
Cause: The task was not saved to Automated Tasks before running.
Fix: Re-run the inline task with Save configuration enabled to track it under Task history. - Dashboard widgets show no data
Cause: The Event Hub was recently associated and has not completed its first monitoring cycle.
Fix: Wait for the next monitoring cycle, then refresh the dashboard.
Related articles
Was this article helpful?