

Executive cost summary
- 05 Aug 2026
- 8 Minutes to read
- Print
- DarkLight
- Download PDF
Executive cost summary
- Updated on 05 Aug 2026
- 8 Minutes to read
- Print
- DarkLight
- Download PDF
Article summary
Did you find this summary helpful?
Thank you for your feedback!
Overview
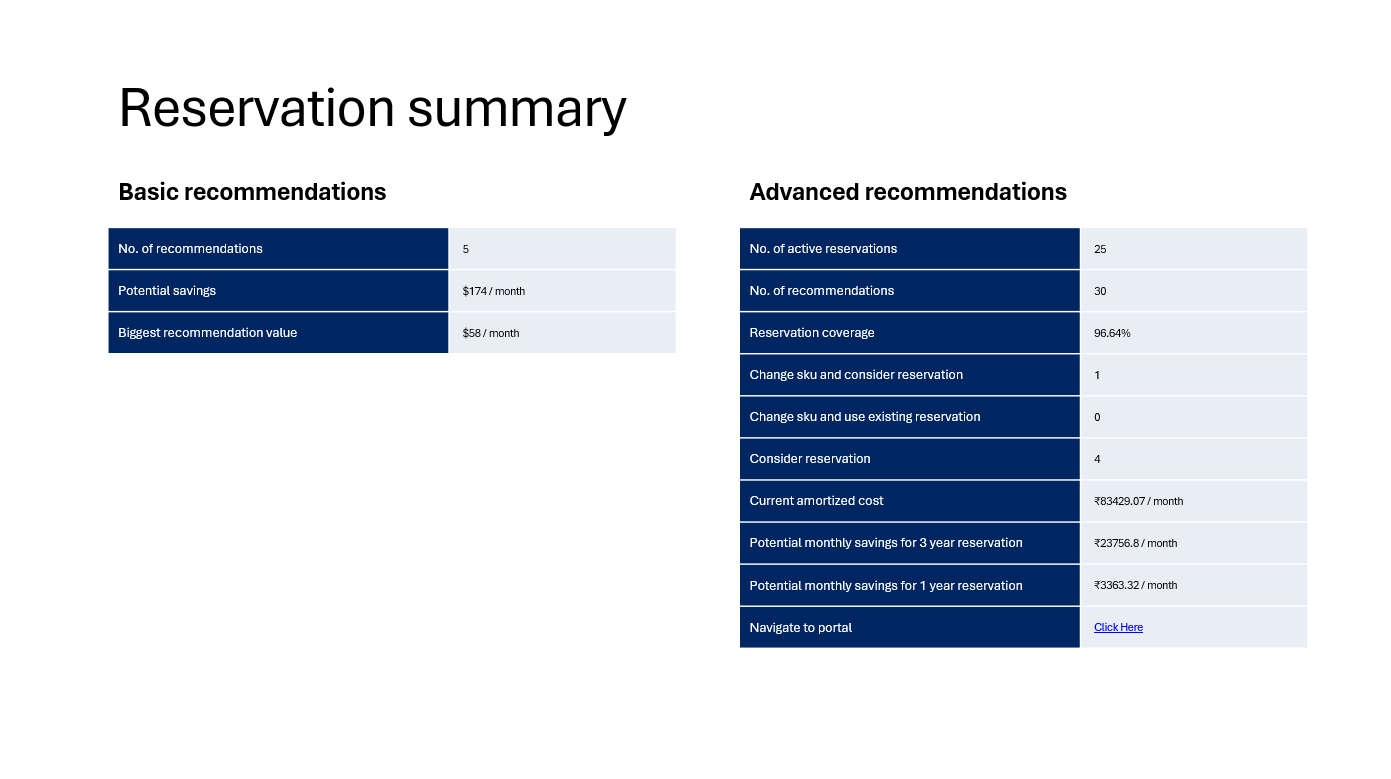
Executive cost summary is a presentation-ready report that gives leadership a high-level view of cloud spend across a cost management group. It's delivered as a PowerPoint (.pptx) file and consolidates spend data, key cost drivers, and optimization recommendations from Rightsizing, Reservations, and Savings plans into a single deck. Reports are available for download from Generation history.
The report also surfaces scheduled optimization savings, summarizes forecasting and monitoring activity, and incorporates Budget planner data to show planning accuracy over time.
Business value
Executive cost summary lets leadership review spending patterns, evaluate savings opportunities, and prioritize optimization efforts without digging through raw cost data — reducing the time it takes to align cloud spend with financial and operational strategy.
Prerequisites
A cost management group must be created and actively tracking cost data.
Required permissions
Access to the Executive cost summary report is controlled by the same Reports permission that governs Cost Analyzer's reporting suite:
| Role | Permission level | Access |
|---|---|---|
| Account owner, Owner, Contributor | — | Full access to Reports |
| Custom role | Reports: Read | View all reports |
| Custom role | Reports: Manage | Edit report configuration and generate reports |
.jpg)
When assigning a custom role, grant Read or Manage on Reports under Specify feature permissions.
How it works
- Executive cost summary can be scheduled to generate weekly, monthly, or both, for a given cost management group.
- Reports can also be generated instantly, on demand, outside the configured schedule.
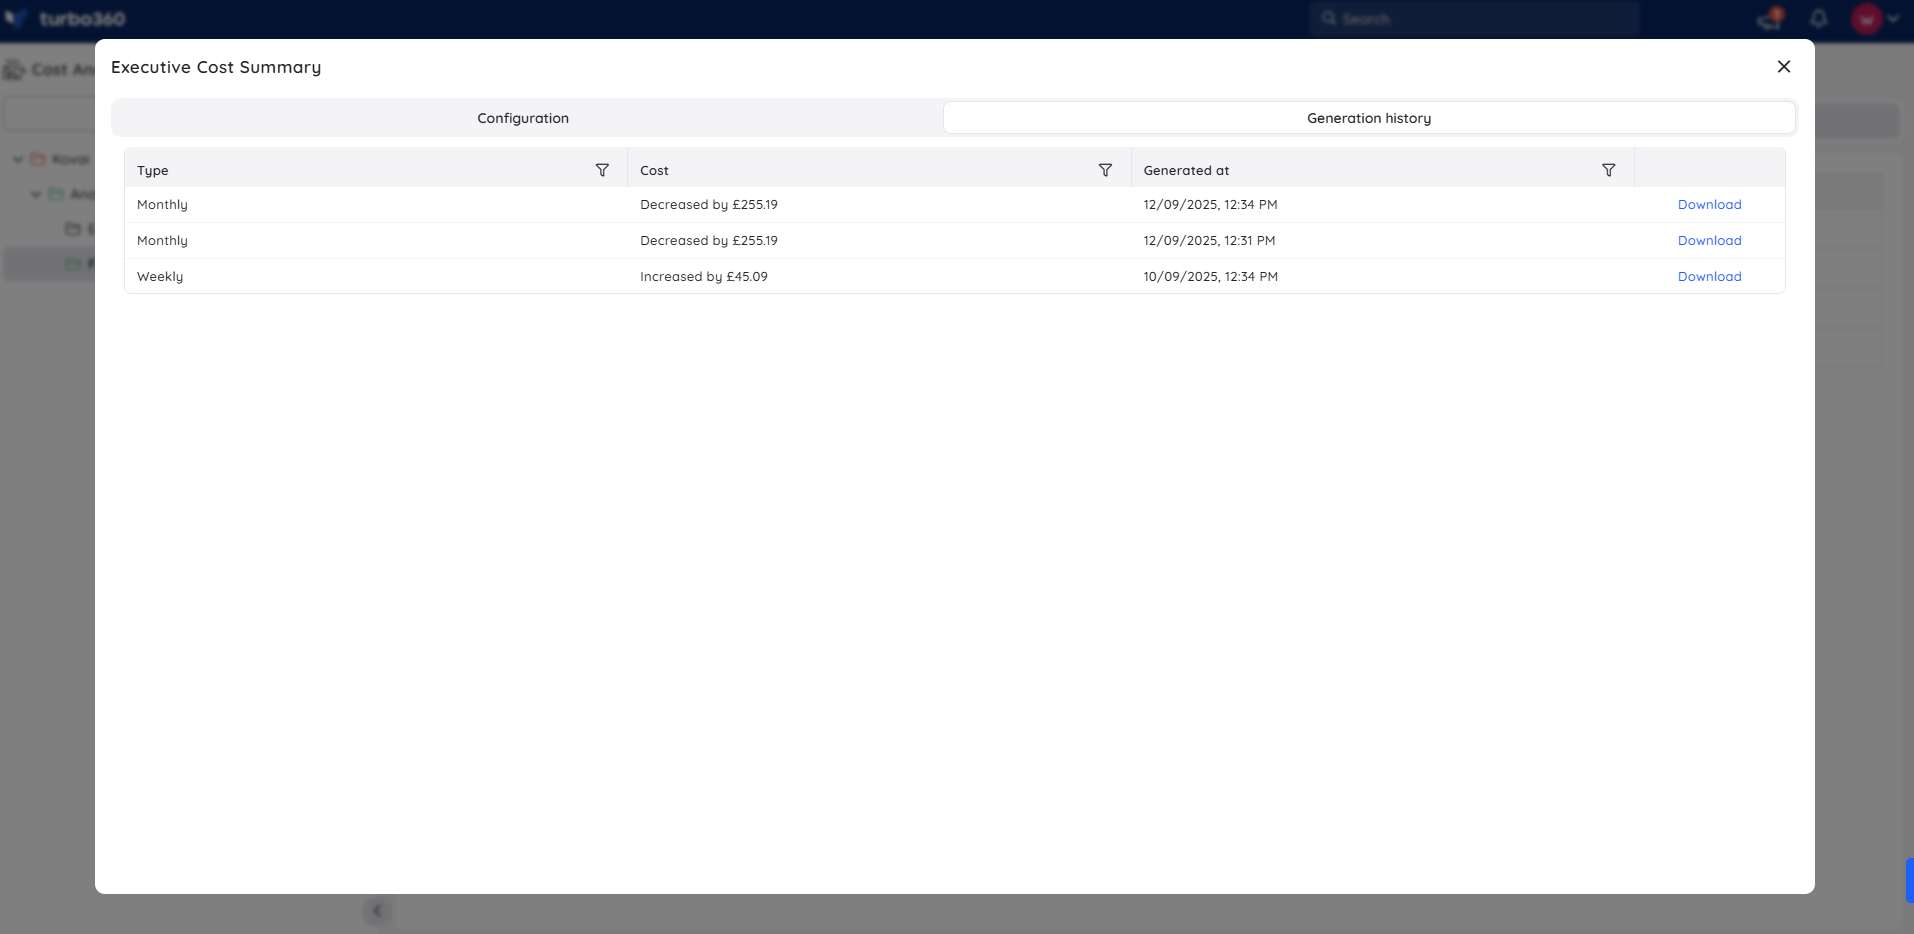
- Every generated report is logged in the Generation history, with a direct download available for each entry.
- Report content pulls from cost analysis, rightsizing, reservations, savings plans, and Budget planner data at the time of generation.
Report contents
The Executive cost summary deck covers the following sections, in order. Each section corresponds to one or more slides in the generated .pptx.
1. Cost summary
The opening slide shows the total amortized cost for the current period compared with the previous period, and the average daily cost for both periods. Each metric includes the absolute difference and percentage change, with directional indicators (↑/↓) so leadership can immediately see whether spend increased or decreased.
2. Subscription cost changes
A table listing every Azure subscription in the cost management group, with its amortized cost for the previous period, the current period, and the difference. Subscriptions with increased spend are shown with an upward indicator; reductions with a downward indicator. This slide identifies which subscriptions are driving cost movement.
3. Cost split by sub-groups
If the cost management group contains sub-groups, this slide breaks down amortized cost by sub-group across both periods, with the cost difference for each. This lets teams with hierarchical cost structures trace spend changes to a specific team, project, or environment grouping.
4. Service cost changes
A table showing cost changes broken down by Azure service category (for example, Virtual Network, Microsoft Defender for Cloud, Storage, Load Balancer). Services with the largest increases appear first. Services with no change are included for completeness. This slide helps identify which service categories are driving the week-over-week or month-over-month spend shift.
5. Accumulated cost — last period
A chart showing the cumulative amortized cost build-up day by day across the report period, with the total amortized cost and the average daily cost as headline figures. This view surfaces whether spend was front-loaded, back-loaded, or consistent across the period.
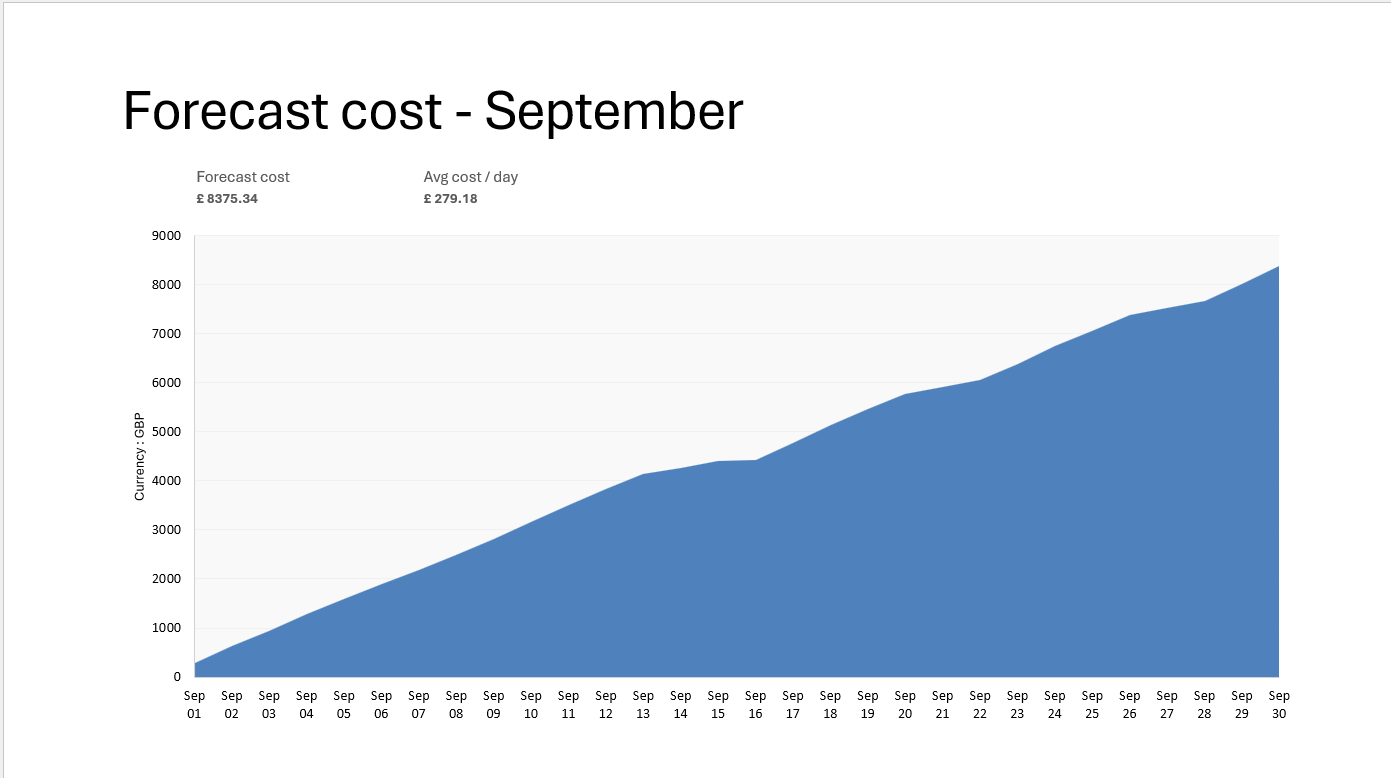
6. Forecast cost — next period
The projected spend for the coming period, broken down as a forecast total and an average daily cost. The forecast is based on Turbo360's cost forecasting model applied to the cost management group's recent spend trend.
7. Monitoring service summary
A summary of alert and budget activity during the report period, showing the number of budget violations, the number of cost anomalies detected, the initial and closing group budget values, and the average daily cost. This gives finance and operations teams a quick read on whether any monitoring thresholds were breached.
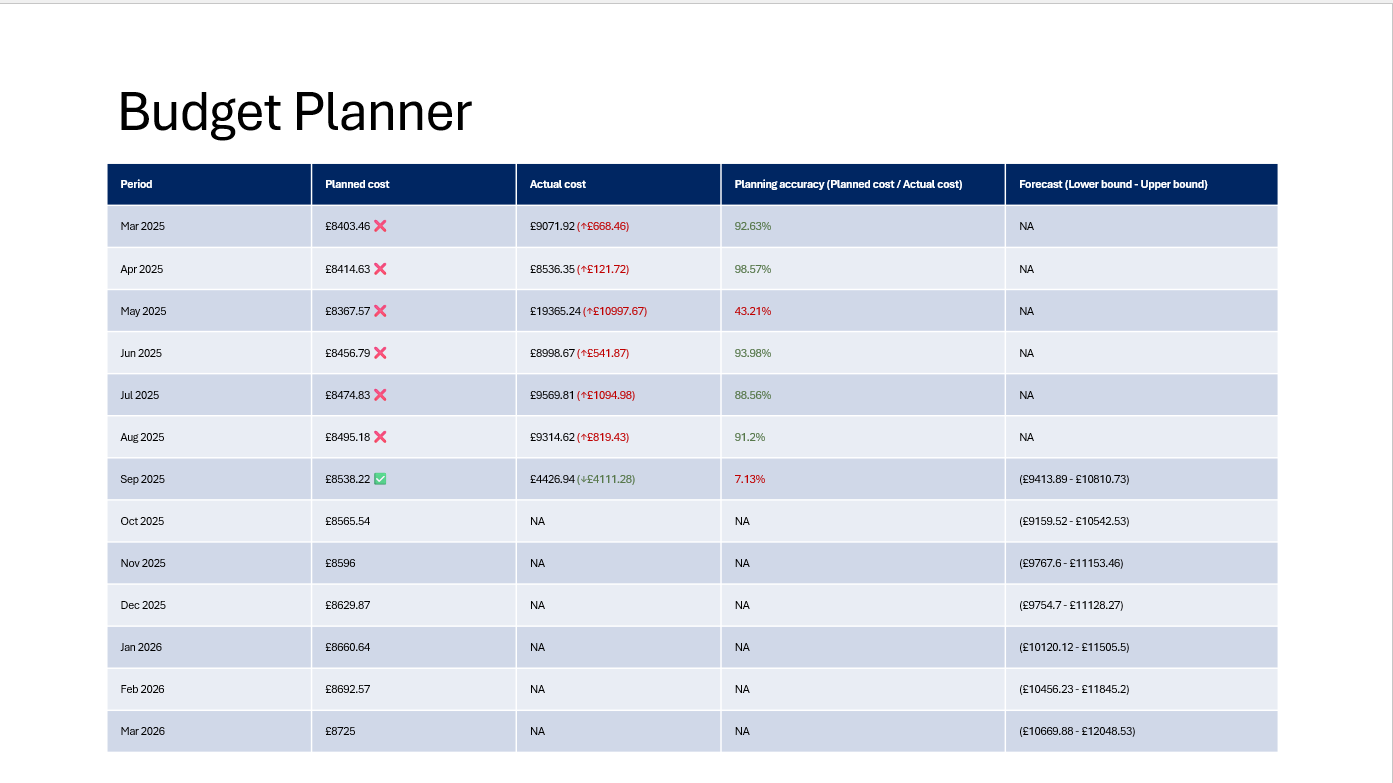
8. Budget planner
A month-by-month table covering the full planning horizon configured for the cost management group. For each month it shows the planned cost, the actual cost (where available), the planning accuracy expressed as a percentage, and the forecast range (lower bound to upper bound) for future months. Months where actuals are complete are marked with a checkmark (✅). This section lets leadership assess how closely Azure spend is tracking against the financial plan and whether forecast ranges are tightening or widening.
9. Rightsizing recommendations summary
A high-level view of the rightsizing analysis for the cost management group, showing the total number of resources assessed, the split between idle, downgrade, and no-change recommendations, the current amortized monthly cost, the projected cost after applying recommendations, and the overall rightsize savings percentage. A Navigate to portal link takes reviewers directly to the full rightsizing view in Turbo360.
10. Rightsizing recommendations detail
A resource-level breakdown of the top rightsizing opportunities, listing each resource by name and type, the recommendation category (Idle or Downgrade), the current SKU, the recommended SKU, the current monthly cost, and the potential monthly saving. This slide gives engineering and finance teams the specific action items needed to act on the summary.
11. Subscription cost overview — last 3 months
A chart showing the month-by-month total cost across all subscriptions in the cost management group for the preceding three months, with a cumulative total. This provides a trend view beyond the current report period to show whether spend is on an upward or downward trajectory.
12. Cost split across sub-groups — last 3 months
The same three-month trend broken down by sub-group, with a cumulative total. This helps teams understand whether cost growth or reduction is concentrated in specific groups or distributed evenly.
13. Other recommendations summary
A table of additional cost optimization recommendations identified by Turbo360, grouped by recommendation type (for example, Log Analytics workspaces with no data cap, API Connections with no Logic App, Storage accounts with higher-than-necessary replication, Resource Groups with no resources). Each row shows the count of affected resources and their cost over the last 30 days where applicable.
14. Scheduling summary
A summary of the cost optimization schedules configured for the group, showing the number of configured schedules, the number of resources on schedules, and the potential monthly savings from scheduled start/stop automation. If no schedules are configured, the values are shown as zero.
Steps
Use the following steps to schedule, generate, and access Executive cost summary reports for a cost management group. Navigate to Cost management group > Reports to get started.
Schedule a report
Scheduling generates the report automatically at the interval you choose, so leadership receives it without manual effort.
- Navigate to Cost management group > Reports.
- Click the Edit icon next to the Executive cost summary report type.
- Specify the report frequency. You can select one interval or both.
- Check Download report from notifications to allow the report to be downloaded from alerts.
- Choose the notification services that should receive alerts.
- Click Save.
- Enable the Executive cost summary report type toggle.
.png)
Generate a report on demand
Generating a report on demand creates an instant copy without waiting for the next scheduled run.
- Go to the Executive cost summary report type row.
- Click the Actions menu next to it.
- Select Generate Now.
.png)
The report type toggle must be enabled in the Reports section, before a report can be generated.
View report generation history
Generation history keeps a record of every report run for the cost management group. Each record shows the report Type (Weekly or Monthly), the Cost change for that period (for example, "Decreased by ₹1,910.49"), and the Generated at timestamp, with a Download link next to each entry.
- Navigate to Cost management group > Reports > Generation history.
- Locate the relevant report entry.
- Click Download next to the entry to retrieve it.
Example scenario
A finance lead schedules the Executive cost summary to run Monthly for the Production cost management group, with Download report from notifications enabled and Microsoft Teams selected as the notification channel. Each month, the team receives a .pptx deck summarizing spend trends, rightsizing and reservation savings, and Budget planner accuracy — ready to present without additional formatting.
The following slides illustrate a sample weekly Executive cost summary report downloaded from Generation history:
Limitations
- On-demand generation via Generate Now always produces a monthly report, regardless of the configured schedule frequency.
- The report format is fixed to
.pptx; other export formats aren't supported.
Troubleshooting
Generate Now is unavailable or fails
Cause: The report type toggle isn't enabled in the Reports section.
Fix: Enable the Executive cost summary toggle, then retry.Report isn't delivered after generation
Cause: No notification channel is selected, or Download report from notifications is disabled.
Fix: Select at least one notification service and enable the download option, then save.Scheduled report doesn't generate at the expected time
Cause: The report frequency wasn't saved, or the toggle was disabled after configuration.
Fix: Reopen the report configuration and confirm both the frequency and toggle are set correctly.Report doesn't appear in Generation history
Cause: The report generation is still in progress or failed silently.
Fix: Wait a few minutes and refresh; if it still doesn't appear, regenerate using Generate Now.
FAQs
Can I schedule Executive cost summary for both weekly and monthly delivery?
Yes. You can select one interval or both when configuring the report frequency.Does Generate Now affect the scheduled report cadence?
No. Generating a report on demand doesn't change or reset the configured schedule.What data feeds into the Executive cost summary report?
Cost analysis, rightsizing, reservations, savings plans, and Budget planner data, as of the generation time.
Related articles
Was this article helpful?