

Home screen dashboard
- 11 Aug 2026
- 8 Minutes to read
- Print
- DarkLight
- Download PDF
Home screen dashboard
- Updated on 11 Aug 2026
- 8 Minutes to read
- Print
- DarkLight
- Download PDF
Article summary
Did you find this summary helpful?
Thank you for your feedback!
Overview
The Turbo360 Home screen dashboard is a centralized, cross-module workspace that surfaces key metrics and operational data from all active Turbo360 modules. Through configurable widgets, you can monitor budgets, application health, document generation activity, and business transaction status from a single view.
The dashboard updates in real time and supports data visualizations including charts, tables, and trend indicators. You can personalize the layout by selecting which widgets to display, how they are arranged, and how they are sized.
Business value
A unified dashboard reduces context-switching between modules. Teams responsible for cost management, application monitoring, document generation, or transaction tracking can configure a single view that reflects their operational priorities — without navigating into each module individually.
Prerequisites
- A Turbo360 account with at least one module configured
- Each module you want to display widgets for must be set up before widgets for that module can be added
Required permissions
Widget access on the Home screen dashboard is determined by the type of permission a user holds on the source module.
| Permission type | Widget access |
|---|---|
| Specified permission | View widget data scoped to the groups assigned to the user only; no configuration access |
| Direct permission | Full access — view all widget data and configure widgets for the module |
Dependencies
Widget availability depends on the modules active in your Turbo360 account. Widgets for a module only appear in the widget selector after that module has been initially configured.
How it works
Each widget on the Home screen dashboard is linked to a specific module and a scope you define during configuration — such as a cost management group, Business Application group, document group, or Business Process group. When you add a widget, you select the module, the data source within that module, and the chart format.
Widgets pull live data from their source module and reflect the current state at the time of viewing. The dashboard layout is per-user — each user configures and arranges their own widgets independently.
The data visible within a widget depends on the user's permission type on the source module. Users with specified permissions see data only for the groups they have been granted access to. Users with direct permissions see all data for that module and can manage widget configuration.
Steps
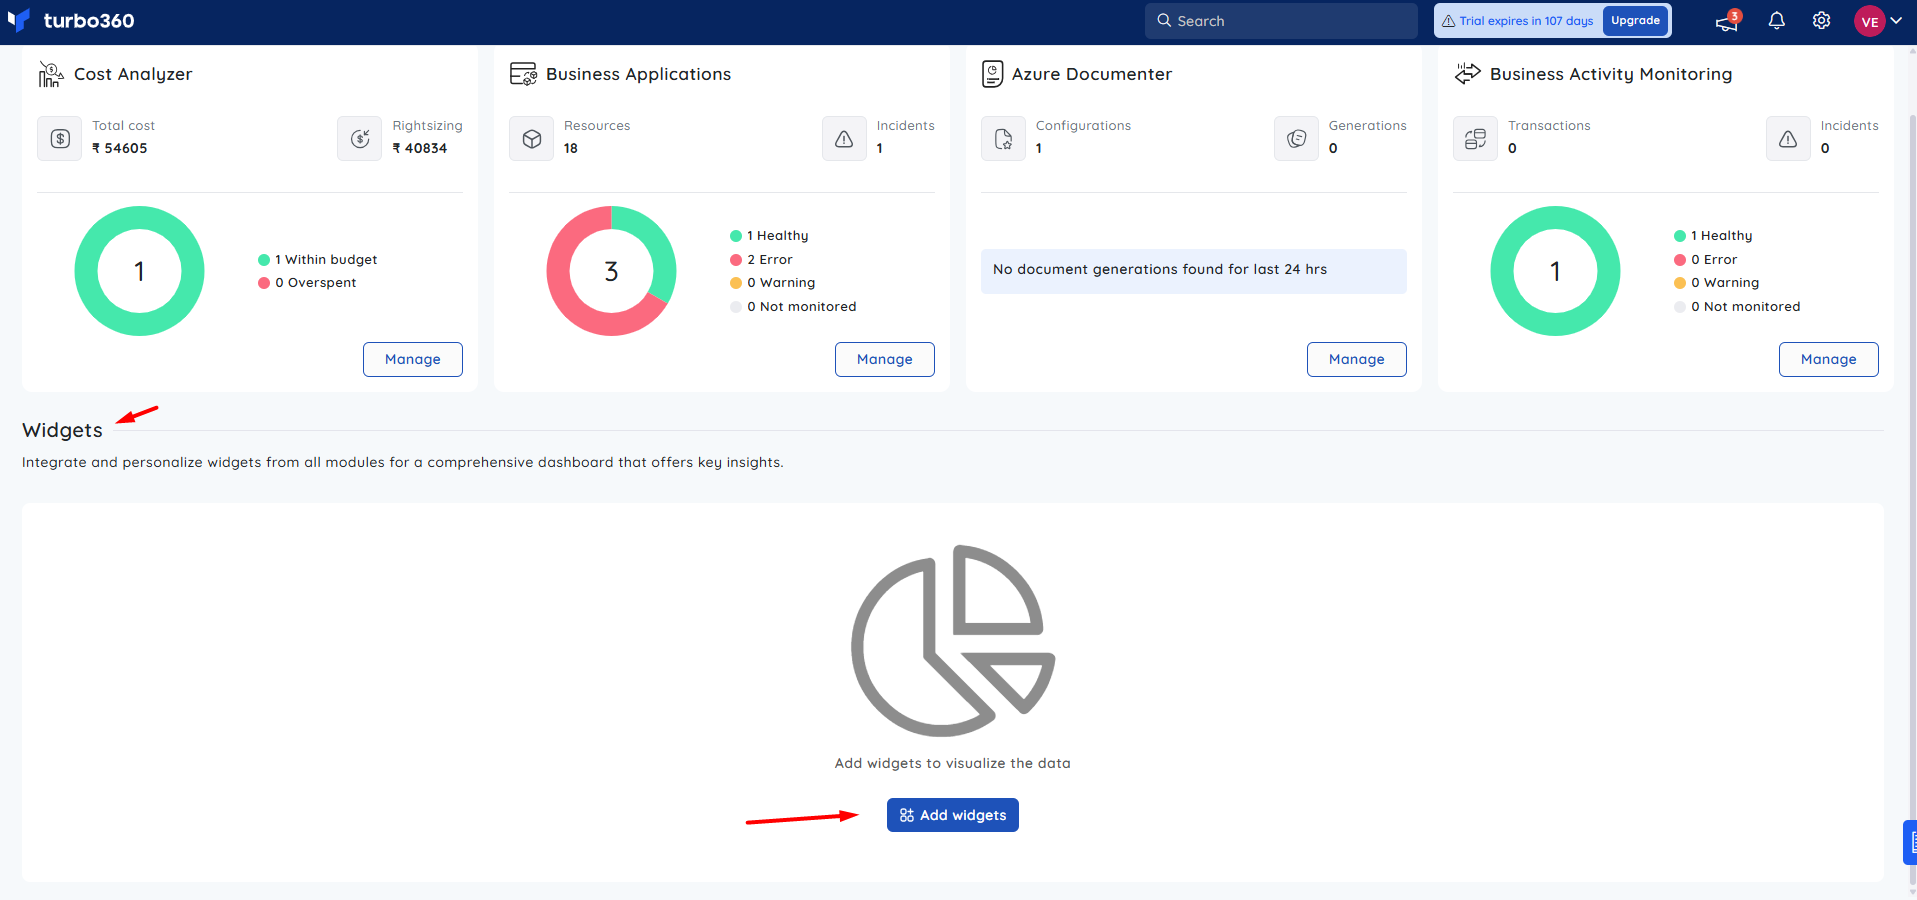
To add widgets to the Home screen dashboard:
- On the Turbo360 home page, locate the Widgets section.
- Click Edit > Add widget, or click Add widgets if no widgets have been added yet.
- Select the module you want to add widgets for.
- Choose the widgets you want to display and configure each one — selecting the data scope, metric, and chart format.
- Click Save to apply.
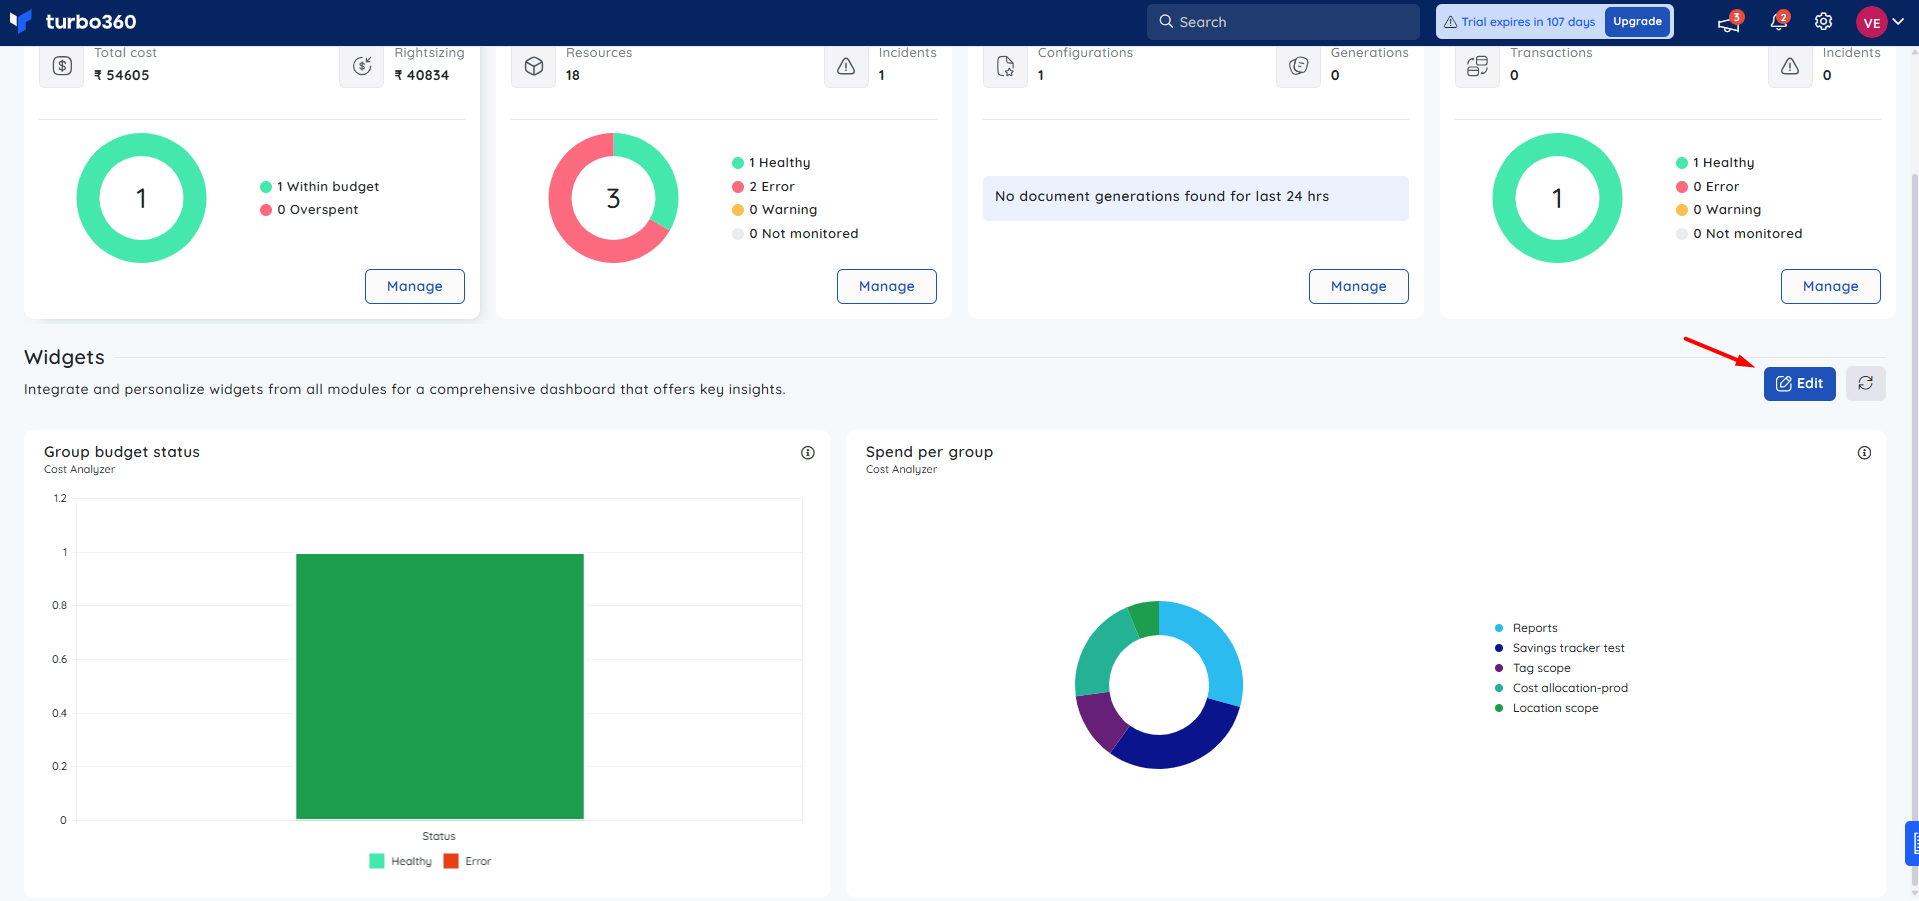
To edit an existing widget:
- Click Edit option in the Widgets section.
- Locate the widget on the dashboard.
- Click the Edit option on the widget.
- Update the configuration as needed.
- Save your changes.
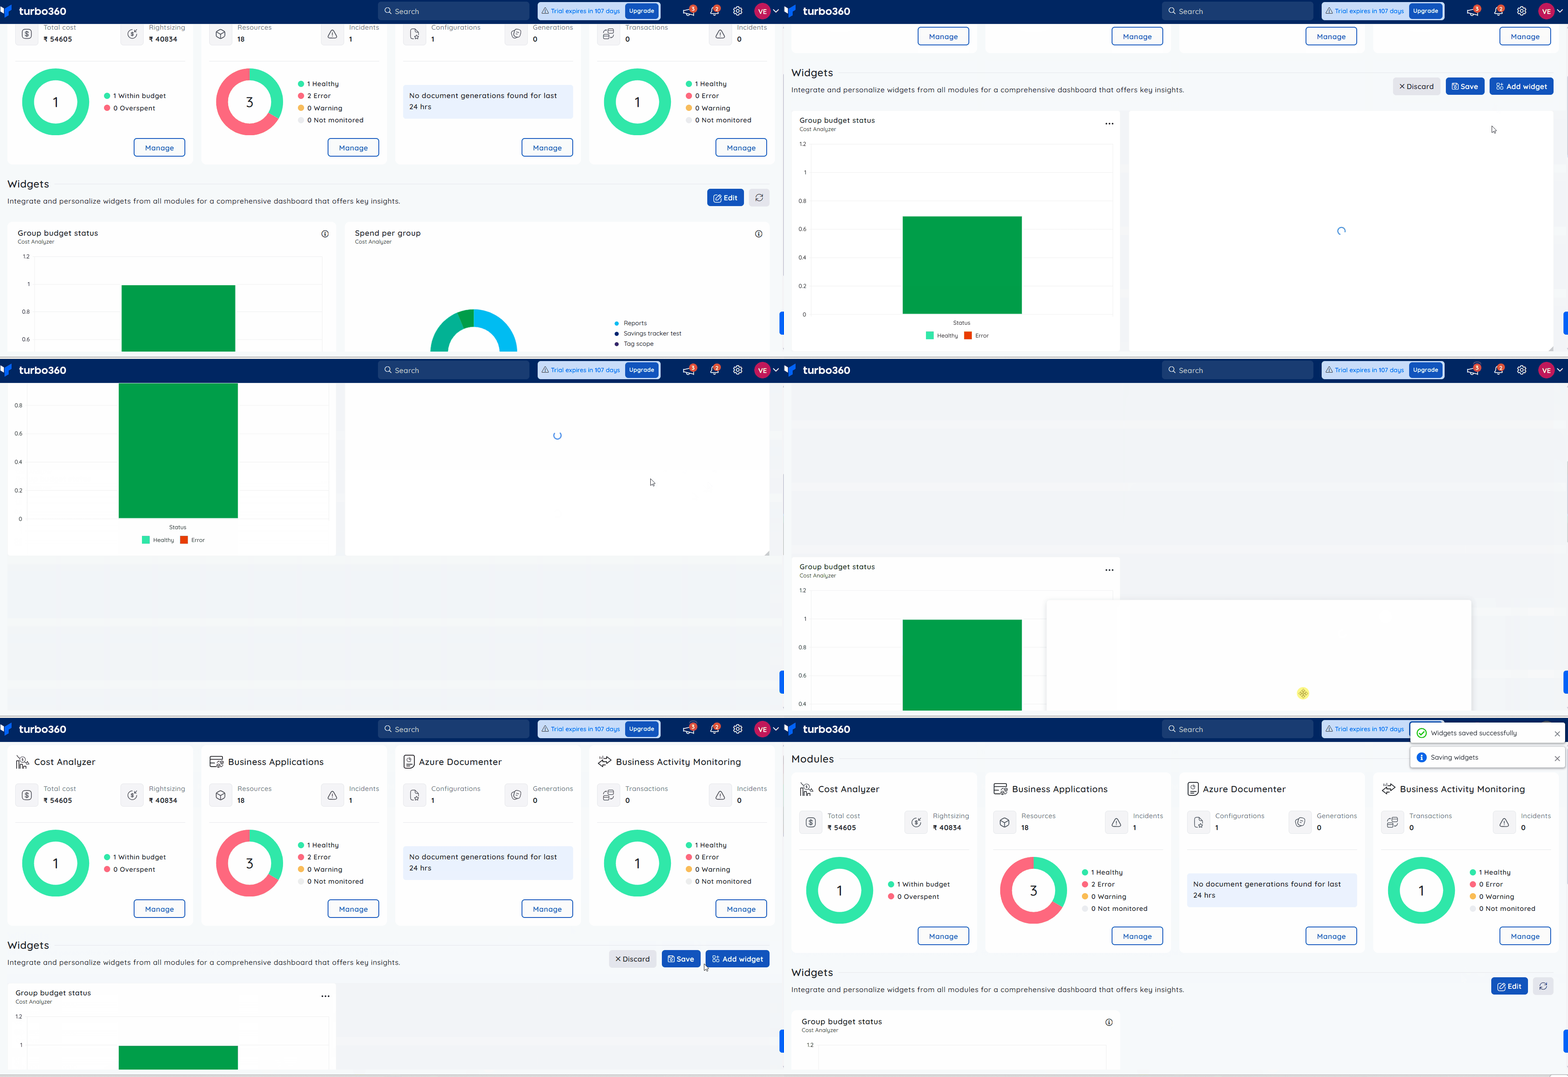
To reorder or resize widgets:
- Click Edit option in the Widgets section.
- Click and drag a widget to the desired position on the dashboard.
- Resize the widget by dragging its edges to fit your preferred layout.
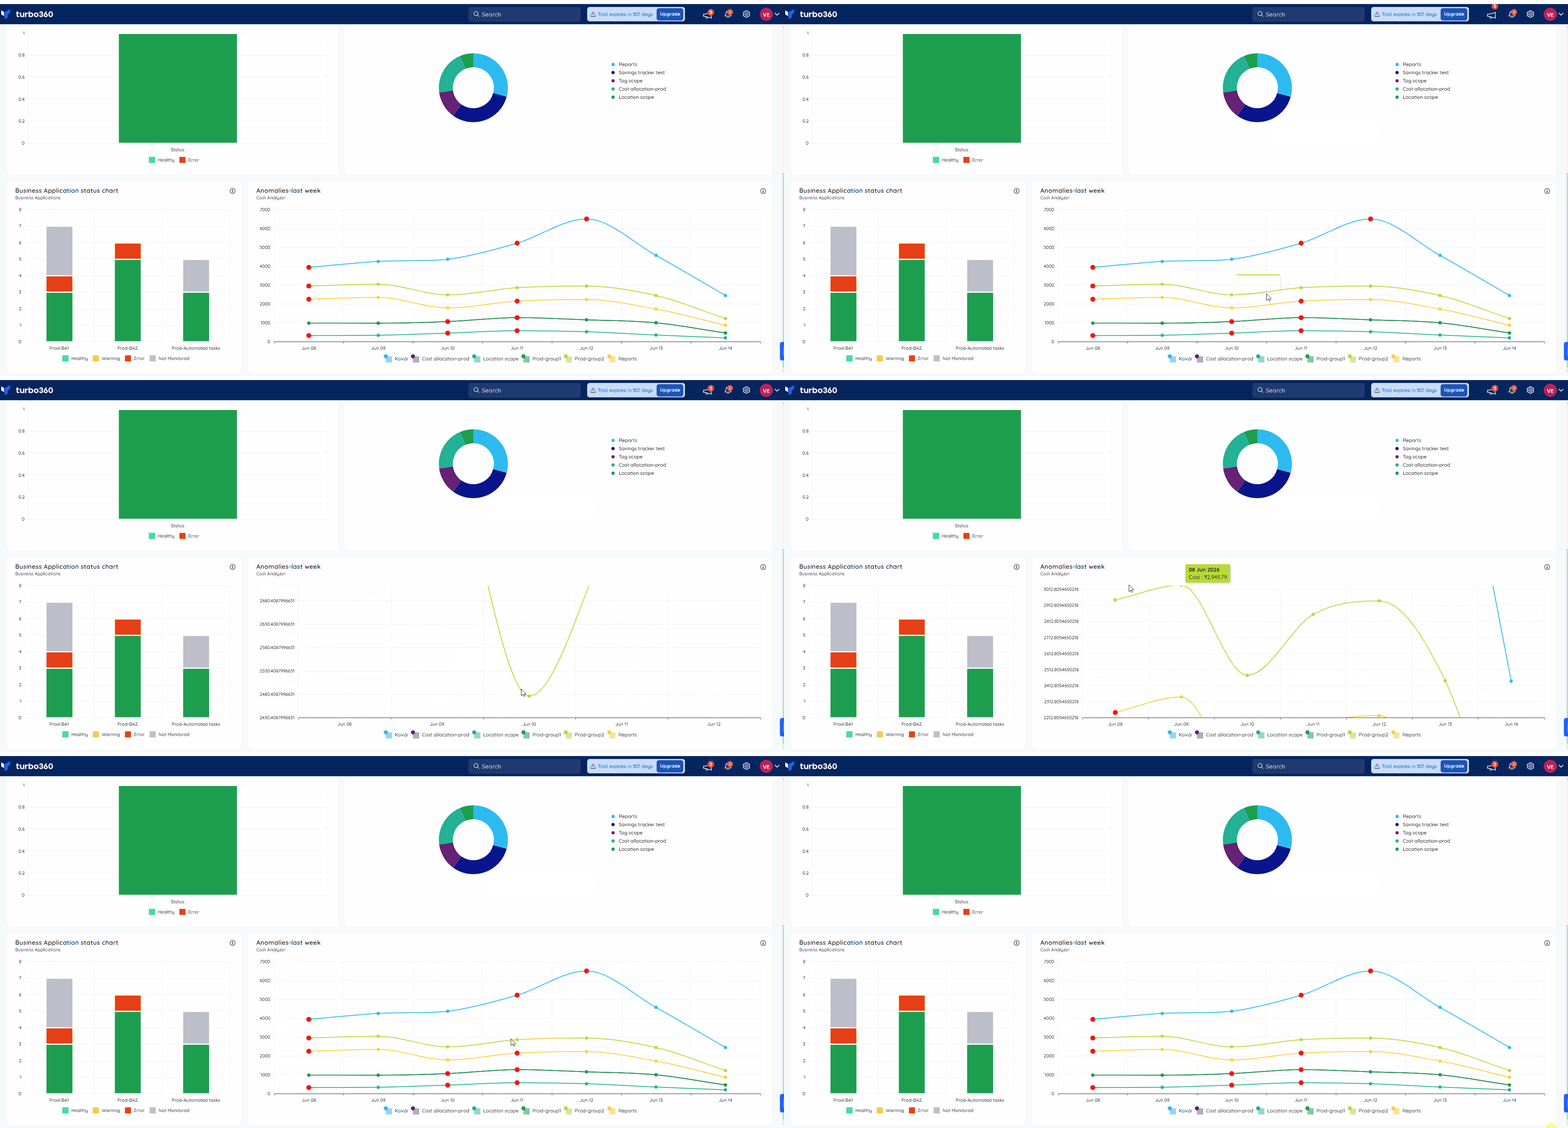
To zoom in or out on a widget:
- Scroll within a widget to zoom in or out on the data points displayed.
Configuration
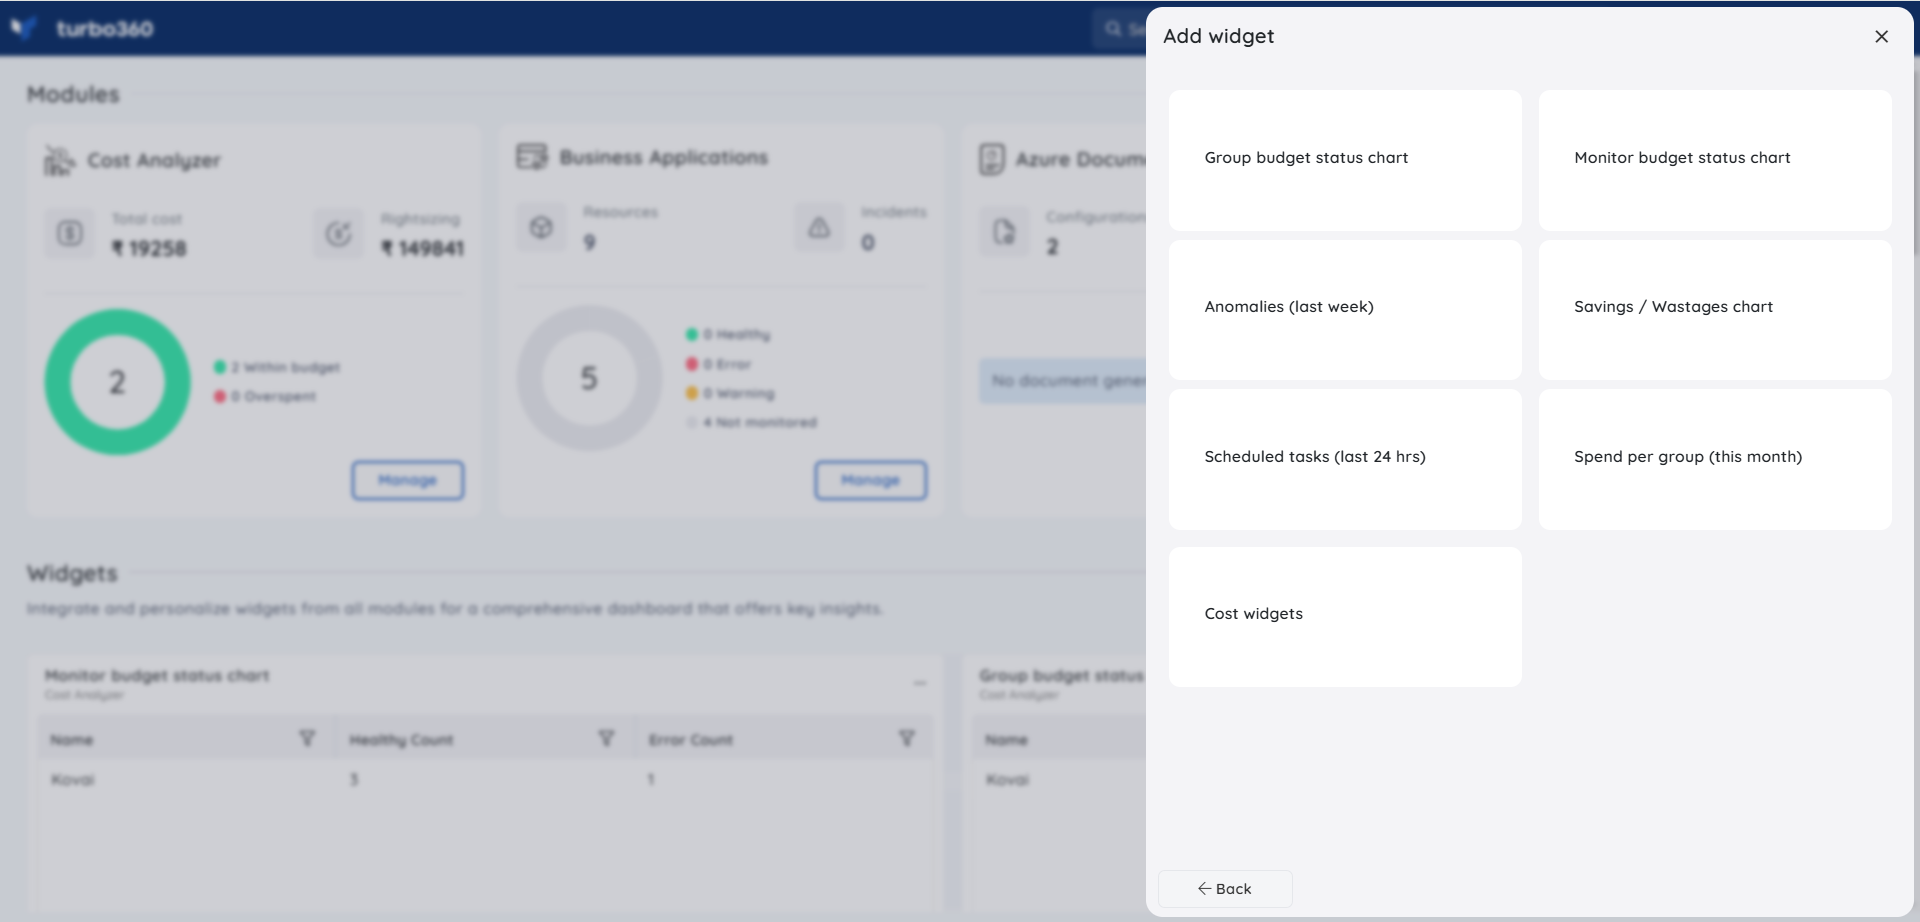
The following widget types are available per module. Each widget is configured with a data scope (group selection) and a chart format during setup.
Cost Analyzer widgets
| Widget | Description | Chart formats |
|---|---|---|
| Group budget status chart | Status of the group budget for selected cost management group(s) | Table, column |
| Monitor budget status chart | Status of the monitor budget for selected cost management group(s) | Table, column |
| Anomalies (last week) | Anomalies detected over the past week for selected cost management group(s) | Line |
| Savings/wastages chart | Detected savings or wastages for selected cost management group(s) | Table, bar, donut |
| Scheduled tasks (last 24 hrs) | Count of completed scheduled tasks in the past 24 hours for selected cost management group(s) | Table, bar |
| Spend per group (this month) | Current month spend for selected cost management group(s) | Table, bar, donut |
| Cost widgets | Cost breakdown by Resource, Resource Group, Location, or other dimensions based on selected subscriptions, metrics, and filters | Column, table, donut, line |
Note:
Cost Analyzer widgets show a currency mismatch during configuration when multiple subscriptions with different billing currencies are selected.
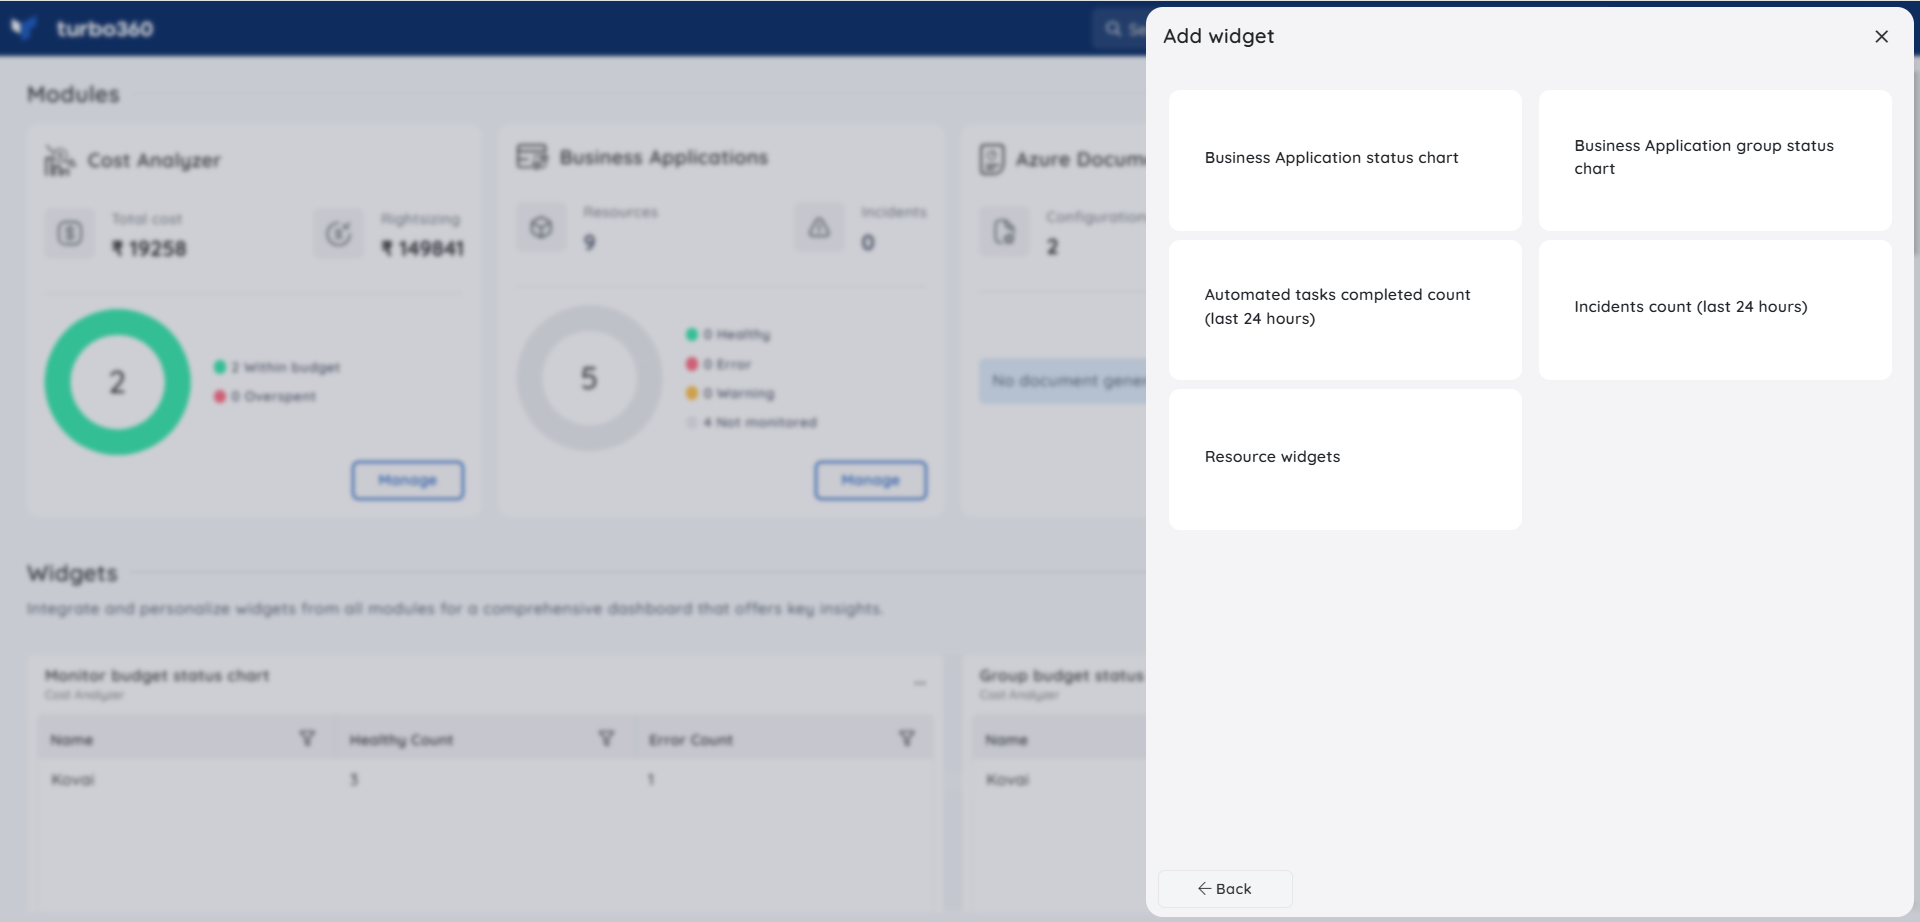
Business Applications widgets
| Widget | Description | Chart formats |
|---|---|---|
| Business Application status chart | Monitoring status of Business Applications for selected Business Application group(s) | Column, table |
| Business Application group status chart | Monitoring status of Business Application groups for selected Business Application group(s) | Column, table |
| Automated tasks completed count (last 24 hours) | Count of automated tasks completed in the past 24 hours for selected Business Application group(s) | Table, bar, donut |
| Incidents count (last 24 hours) | Incident count in the past 24 hours for selected Business Application group(s) | Table, donut |
| Resource widgets | Chart for each resource type based on time range and granularity, depending on the resource type selected during configuration | Table, bar, donut, count, area, line |
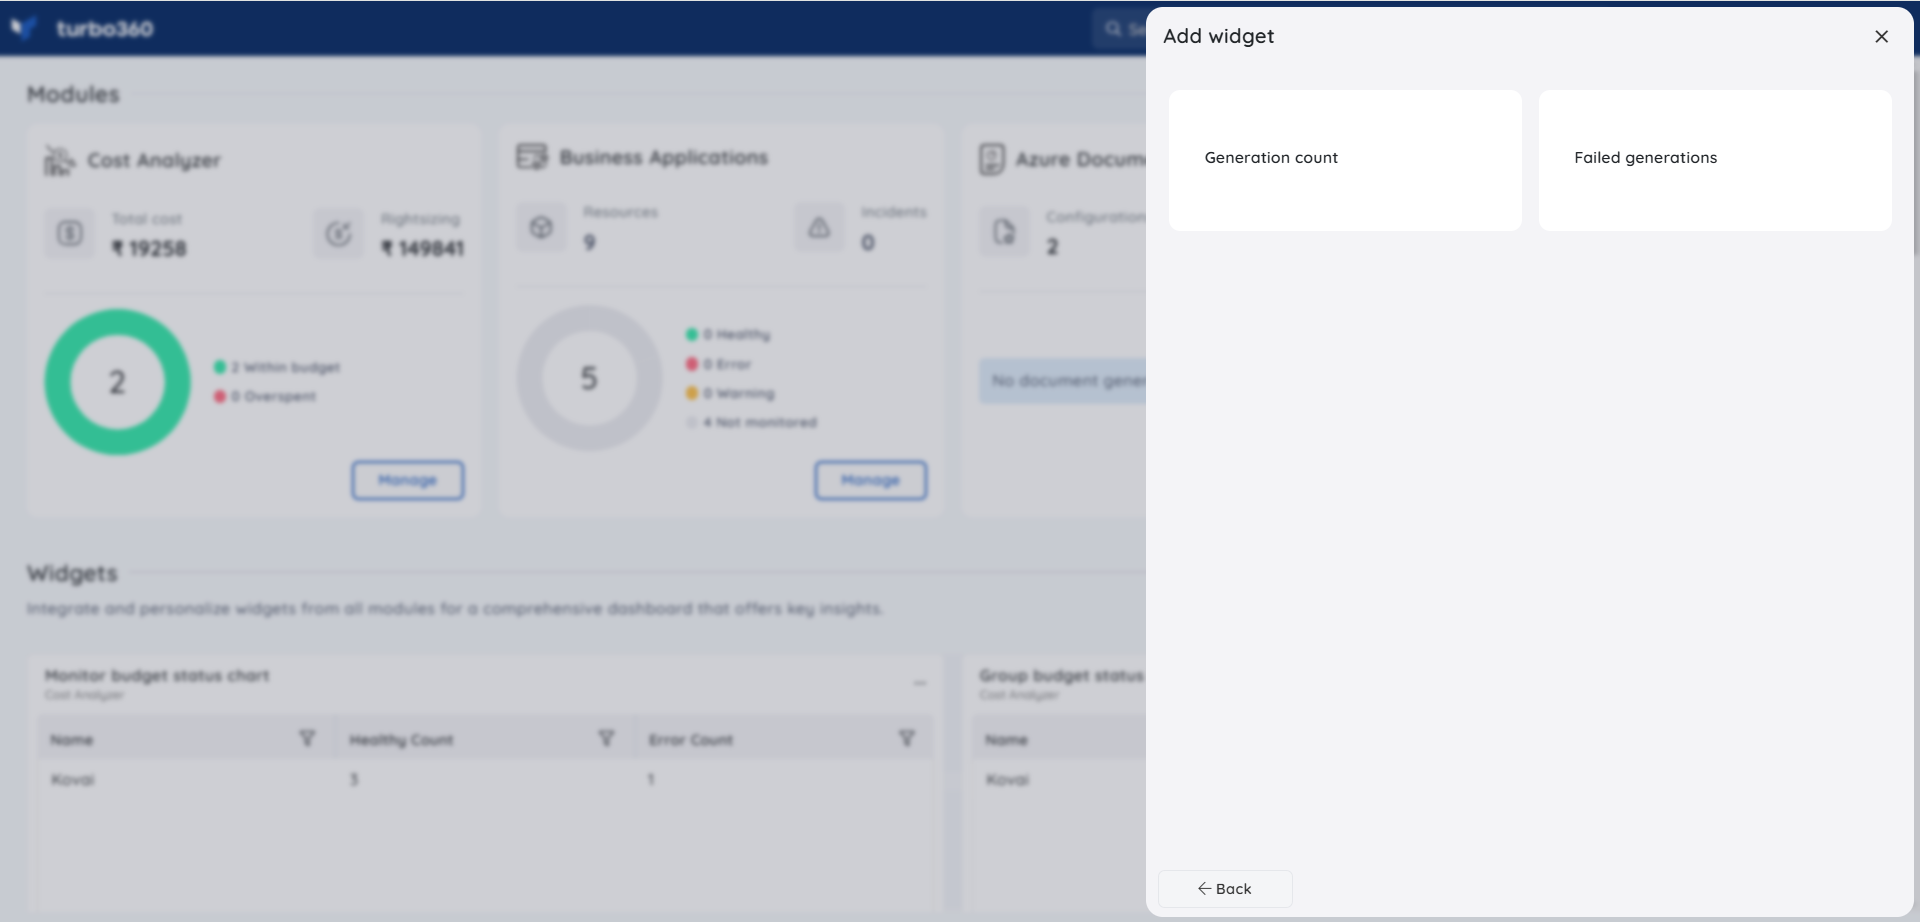
Azure Documenter widgets
| Widget | Description | Chart formats |
|---|---|---|
| Generation count | Document generation count for the past 24 hours or current month for selected document group(s) | Table, bar, donut |
| Failed generations | Count of failed document generations for the past 24 hours or current month for selected document group(s) | Table, bar, donut |
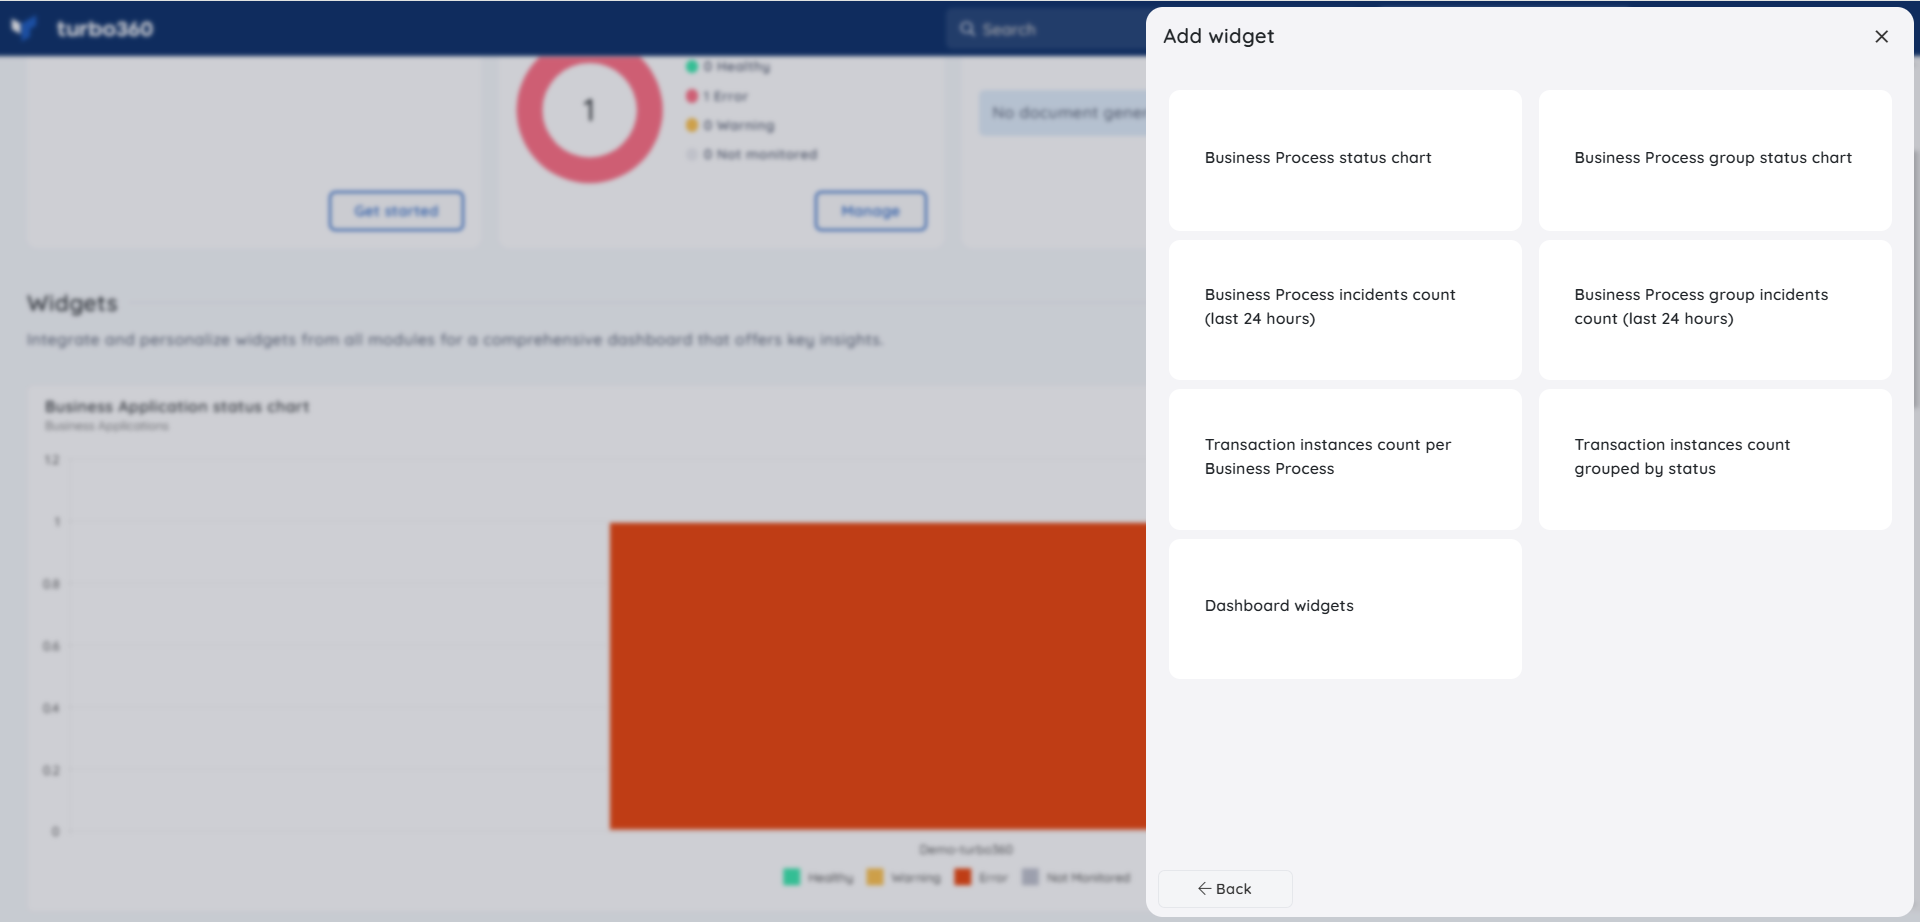
Business Activity Monitoring widgets
Each Business Activity Monitoring widget is configured with a Business Process group scope and a selection of Custom logging nodes or Data Querying nodes.
| Widget | Description | Chart formats |
|---|---|---|
| Business Process status chart | Monitoring status of Business Processes for selected Business Process group(s) | Column, table |
| Business Process group status chart | Monitoring status of Business Process groups for selected Business Process group(s) | Column, table |
| Business Process incidents count (last 24 hours) | Incident count for Business Processes over the past 24 hours for selected Business Process group(s) | Table, donut |
| Business Process group incidents count (last 24 hours) | Incident count for Business Process groups over the past 24 hours for selected Business Process group(s) | Table, donut |
| Transaction instances count per Business Process | Transaction instance count per Business Process over the past 24 hours or current month for selected Business Process group(s) | Table, bar, donut |
| Transaction instances count grouped by status | Transaction instance count grouped by status over the past 24 hours or current month for selected Business Process group(s) | Table, column |
| Assigned Transactions | Count of assigned transactions for selected Business Process group(s) | Table, bar, donut |
| Dashboard widgets | Metrics data for selected nodes, tailored to query type and report type | Line, bar, column |
Permission behavior
With specified permission on the source module:
You can view widget data, but only for the groups you have been granted access to. Widget configuration controls are not available.
With direct permission on the source module:
You have full access to all widget data for the module and can add, edit, reorder, and resize its widgets.
Note:
Specified permission access is scoped to the group data defined in the user's permission assignment. Data outside those groups is not visible, even if widgets for those groups are present on the dashboard.
Example scenario
A platform engineer manages both cost and application health for their organization. They configure the Home screen dashboard with:
- A Group budget status chart (Cost Analyzer) scoped to their primary cost management group, in column chart format
- A Business Application group status chart (Business Applications) scoped to their production Business Application group
- A Scheduled tasks (last 24 hrs) widget (Cost Analyzer) to track overnight automation runs
They drag the budget chart to the top of the layout for priority visibility, and resize the application status chart to span the full width below it. The result is a single-screen view covering their two primary monitoring responsibilities without opening either module.
Limitations
- Users with specified permissions can view widget data only for groups included in their permission assignment; data for other groups is not visible.
- Each module must be fully configured before its widgets become available in the widget selector.
- Dashboard layout and widget configuration are shared across accounts.
- Cost Analyzer widgets show a currency mismatch during configuration when multiple subscriptions with different billing currencies are selected.
Troubleshooting
Widget data is missing or incomplete
Cause: The user has specified permission on the source module, and the widget's configured groups fall outside their assigned group scope.
Fix: Verify the user's permission assignment includes the relevant groups, or request that an administrator expand the group scope.A module's widgets do not appear in the Add widgets selector
Cause: The module has not been initially configured in Turbo360.
Fix: Complete the initial setup for the module before attempting to add its widgets to the dashboard.Widget data appears stale or is not updating
Cause: The data scope selected during widget configuration (e.g. cost management group or Business Process group) may have changed, or there may be a data sync delay.
Fix: Edit the widget to verify the selected scope is still valid. If the scope is correct, wait for the next refresh cycle or reload the dashboard.Drag-and-drop reordering is not working
Cause: The widget may be in an edit state, or a browser compatibility issue may be affecting drag-and-drop behavior.
Fix: Close any open widget edit panels, then retry. If the issue persists, try a supported browser.Widget configuration changes are not saved
Cause: The save action was not completed, or a session timeout occurred during editing.
Fix: Re-open the widget using the Edit option and reapply the configuration changes, then confirm the save action.
FAQs
Can I share my dashboard layout with other users?
Dashboard layouts and widget configurations are account-wide and automatically available to all users in the Turbo360 account. While the layout is shared, the data displayed in each widget varies based on the user's permissions.Can I add widgets from multiple modules to the same dashboard?
Yes. You can add widgets from any combination of configured modules — Cost Analyzer, Business Applications, Azure Documenter, and Business Activity Monitoring — to a single dashboard view.Does the dashboard update automatically?
Yes. Widgets are designed to display real-time data and update automatically. For immediate updates, you can use the refresh option to perform a manual refresh.What happens to my widgets if I lose access to a module?
The widget remains on the dashboard even if access to the corresponding module is removed. However, the widget's data and configuration cannot be viewed or modified, and the message "You are not authorized to view this widget data" is displayed until access is restored.
Related articles
Was this article helpful?