

Hybrid connection
- 05 Aug 2026
- 5 Minutes to read
- Print
- DarkLight
- Download PDF
Hybrid connection
- Updated on 05 Aug 2026
- 5 Minutes to read
- Print
- DarkLight
- Download PDF
Article summary
Did you find this summary helpful?
Thank you for your feedback!
Overview
Azure Relay provides secure connectivity between on-premises environments and Azure-hosted services without requiring inbound firewall changes. A Hybrid connection is a relay endpoint within Azure Relay that enables bidirectional communication between your on-premises applications and cloud services. In Business Applications, Turbo360 surfaces the connection metadata and Azure Monitor metrics for each Hybrid connection directly in the resource view.
Business value
Monitoring Hybrid connections in Turbo360 brings listener status, error rates, and data transfer volumes into the same view as the rest of the application topology — helping you isolate relay failures faster without switching to the Azure portal.
How it works
When a Hybrid connection is part of a Business Application, Turbo360 displays its resource view with two top-level tabs: Overview and Monitoring.
The Overview tab shows the Essentials panel with the resource's key properties:
- Resource group — the Azure resource group the connection belongs to
- Listeners — the number of relay listeners currently registered and active
- Location — the Azure region where the resource is deployed
- Subscription — the Azure subscription associated with the resource
- Tags — any Azure tags assigned to the connection
- Created at and Updated at — timestamps for when the resource was created and last modified in Azure
- Requires client authorization — indicates whether incoming relay connections must present a client token
Within the Overview tab, the Dashboard and Metrics sub-tabs let you configure and view custom metric widgets for the resource. The Monitoring tab provides access to monitoring rules and monitoring profiles.
Permissions
| Permission | Description |
|---|---|
| Read | View the Hybrid connection resource, its Essentials panel, dashboard, and monitoring data. |
| Manage | Configure monitoring rules, create and manage dashboard widgets, and update monitoring profiles. |
Resource dashboard
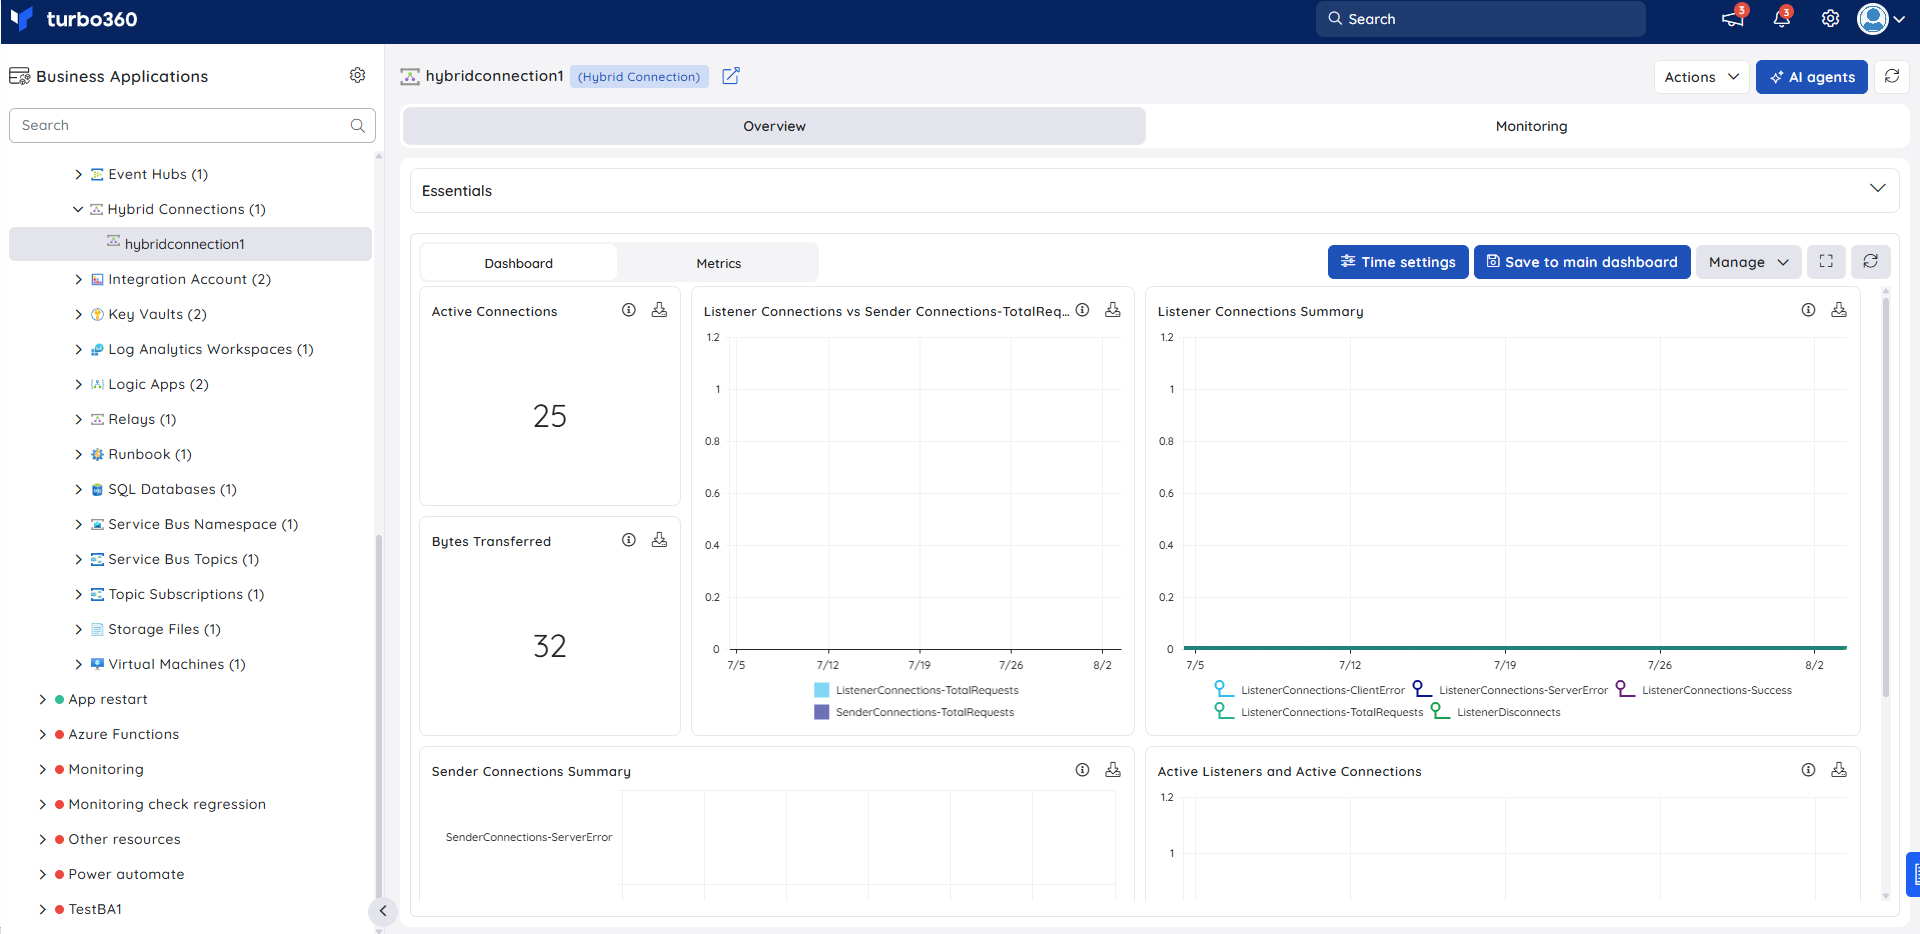
The Hybrid connection dashboard gives you real-time visibility into connection activity, data transfer volumes, and relay health — surfacing the signals you need to detect failures and traffic anomalies without querying Azure Monitor directly.
| Widget | What it shows |
|---|---|
| Active Connections | Current number of relay connections open — a sustained drop to zero indicates a relay failure. |
| Bytes Transferred | Total bytes transferred through the connection over the selected time window — use this to baseline normal traffic volume. |
| Listener Connections vs Sender Connections | Comparison of SenderConnections-TotalRequests against ListenerConnections-TotalRequests over time — useful for spotting asymmetric traffic between senders and listeners. |
| Listener Connection Summary | Time-series breakdown of ListenerConnections-ClientError, ListenerConnections-ServerError, ListenerConnections-Success, ListenerConnections-TotalRequests, and ListenerDisconnects — use this to diagnose listener-side connection failures. |
| Sender Connections Summary | Bar chart of SenderDisconnects, SenderConnections-TotalRequests, SenderConnections-Success, and SenderConnections-ServerError — useful for identifying sender-side connection issues at a glance. |
| Active Listeners and Active Connections | Time-series chart tracking ActiveConnections and ActiveListeners simultaneously — use this to confirm the relay endpoint is operational. |
Metrics
The Metrics tab surfaces connection activity, data transfer volumes, and relay health data for Hybrid connection, giving you visibility into relay performance trends over time. Use the Metrics tab to identify periods of elevated connection failures or drops in transferred bytes that may indicate relay degradation, and to confirm that traffic returns to normal after resolving on-premises Hybrid Connection Manager or upstream application issues.
You can add, remove, or reconfigure widgets to focus on the metrics most relevant to your support scenario.
Monitoring
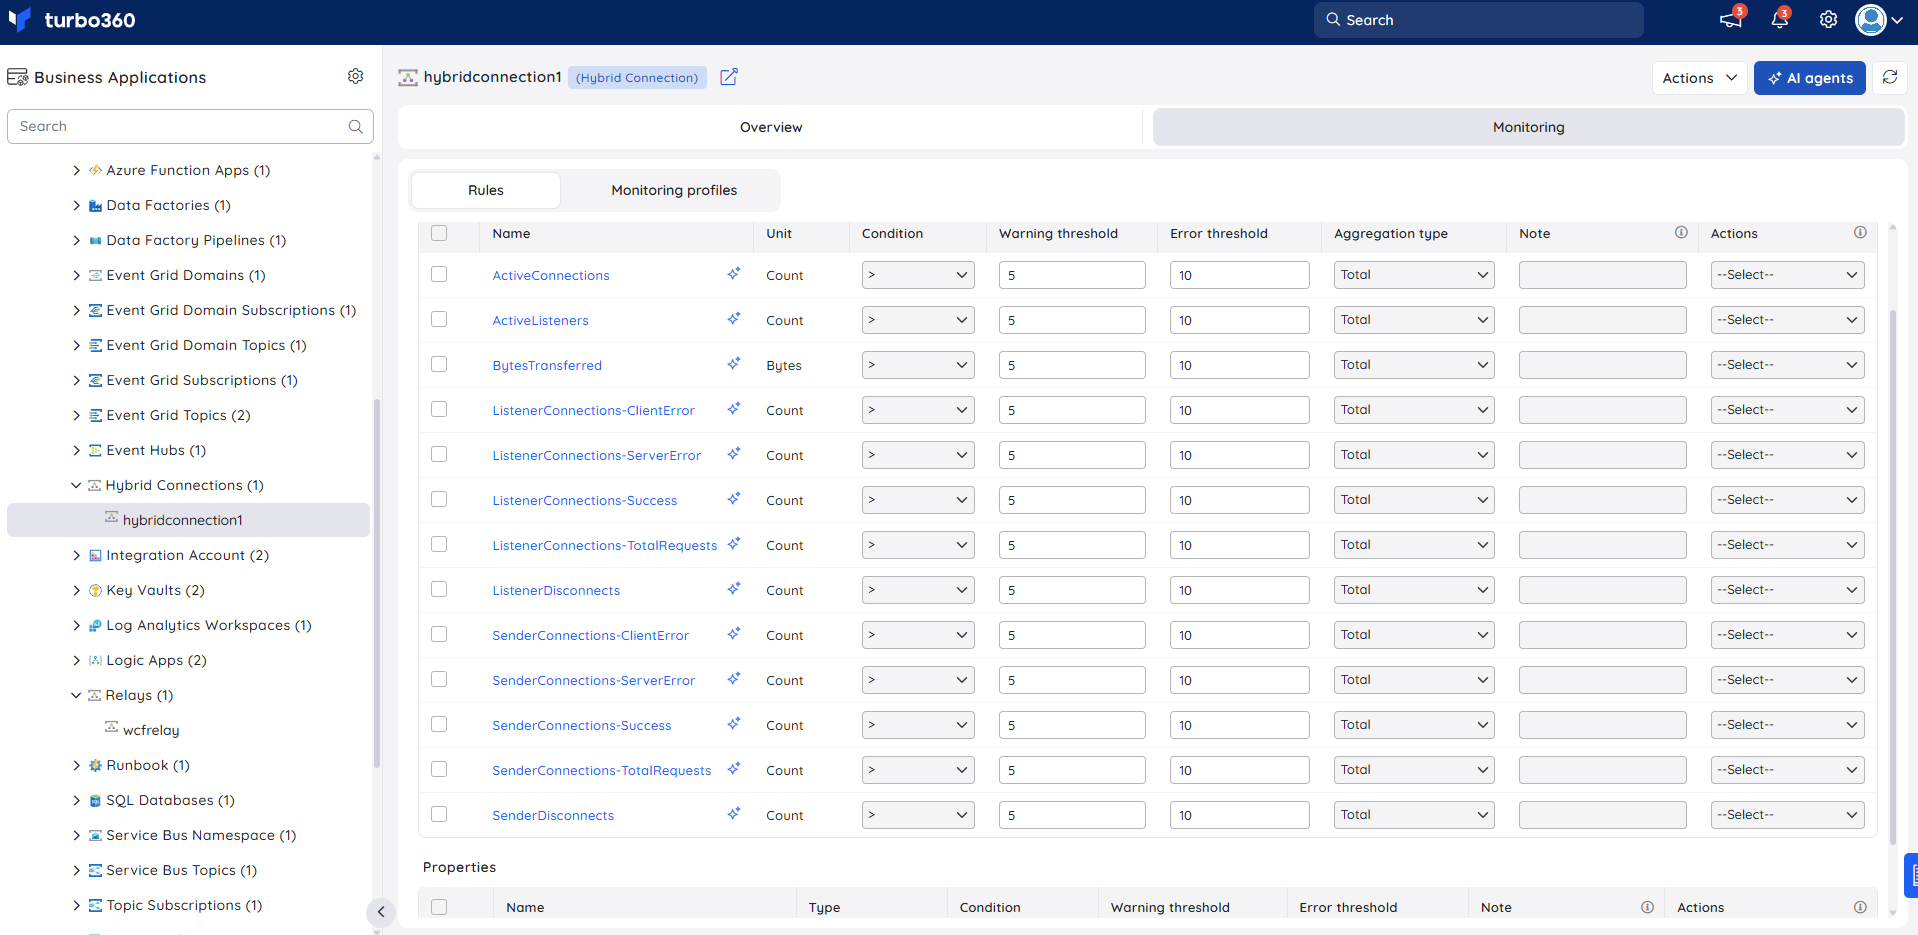
Hybrid connection supports metric and property monitoring rules, configured from the Hybrid connection resource > Monitoring.
Monitoring rules are saved per resource. The monitoring state updates after every monitoring cycle.
Metric monitoring
Tracks Azure Monitor metrics for the Hybrid connection against configured thresholds. Use this when you need to detect connection failures, listener drops, or abnormal data transfer volumes — for example, when a backend workflow stops sending data through the relay unexpectedly.
- Select the metrics you want to monitor in the Metrics table.
- Set the Condition, Warning threshold, Error threshold, and Aggregation type for each metric.
- Click Save.
The following metrics are available:
| Metric | Unit | Description |
|---|---|---|
| ActiveConnections | Count | Number of relay connections currently active. |
| ActiveListeners | Count | Number of relay listeners currently registered. |
| BytesTransferred | Bytes | Total bytes transferred through the relay connection. |
| ListenerConnections-ClientError | Count | Listener connection attempts that failed due to a client-side error. |
| ListenerConnections-ServerError | Count | Listener connection attempts that failed due to a server-side error. |
| ListenerConnections-Success | Count | Listener connection attempts that completed successfully. |
| ListenerConnections-TotalRequests | Count | Total listener connection requests received. |
| ListenerDisconnects | Count | Number of times a listener disconnected from the relay. |
| SenderConnections-ClientError | Count | Sender connection attempts that failed due to a client-side error. |
| SenderConnections-ServerError | Count | Sender connection attempts that failed due to a server-side error. |
| SenderConnections-Success | Count | Sender connection attempts that completed successfully. |
| SenderConnections-TotalRequests | Count | Total sender connection requests received. |
| SenderDisconnects | Count | Number of times a sender disconnected from the relay. |
Property monitoring
Tracks specific resource property values against configured thresholds. Use this when you need to alert on the active listener count — for example, to detect when listeners drop to zero during business hours, indicating the on-premises Hybrid Connection Manager has gone offline.
- Locate the property in the Properties table.
- Set the Condition, Warning threshold, and Error threshold values.
- Click Save.
The following property is available:
| Property | Type | Description |
|---|---|---|
| Listener Count | Property | The current number of active relay listeners registered to the connection. |
Troubleshooting
Metric values are not updating in the monitoring view
Cause: The monitoring cycle has not completed since the rule was last saved.
Fix: Wait for the next monitoring cycle to run, then refresh the resource view. If metrics still do not update, verify the Azure subscription connection is healthy under Platform Administration.Listeners count shows 0 in the Essentials panel
Cause: The on-premises Hybrid Connection Manager is not running or has lost its connection to the Azure Relay endpoint.
Fix: On the on-premises host, confirm the Hybrid Connection Manager service is running and has outbound network access to Azure Relay. Restart the service if needed and confirm the listener count updates on the next resource refresh.ListenerConnections-ClientError or SenderConnections-ClientError metrics are elevated
Cause: The on-premises client is using an invalid, expired, or revoked shared access key, or the relay endpoint URL has changed.
Fix: Verify the connection string and shared access key configured in the Hybrid Connection Manager. If the key has expired, regenerate it in the Azure portal and update the configuration on the on-premises host.BytesTransferred remains at zero despite active listeners
Cause: No traffic is flowing through the relay — the upstream service may not be sending requests, or it is targeting an incorrect relay endpoint URL.
Fix: Confirm the upstream application is running and targeting the correct endpoint. Verify that SenderConnections-Success is also non-zero to confirm the sender is establishing connections successfully.Dashboard widgets are not loading
Cause: The widget configuration references a metric that is no longer available, or the browser session has expired.
Fix: Refresh the resource view. If the issue persists, open the Manage menu on the Dashboard sub-tab, remove the affected widget, and re-add it with the correct metric configuration.
Related articles
Was this article helpful?