

Impact tracker
- 05 Aug 2026
- 6 Minutes to read
- Print
- DarkLight
- Download PDF
Impact tracker
- Updated on 05 Aug 2026
- 6 Minutes to read
- Print
- DarkLight
- Download PDF
Article summary
Did you find this summary helpful?
Thank you for your feedback!
Overview
Impact tracker captures and displays the cost impact resulting from optimization schedules. It organizes data into distinct tabs — Schedules and Resources — so you can review the outcome of every schedule and the resources associated with it.
Impact tracker focuses on the cost impact observed after a schedule is created, helping you monitor changes, evaluate performance, and measure the effectiveness of your automation initiatives.
Business value
Optimization schedules reduce costs only when resources actually stop running during the scheduled window. Impact tracker quantifies exactly how much has been saved — or added — so teams can verify ROI without manually comparing pre- and post-schedule billing data. This turns automation into a measurable outcome rather than an assumed one.
Prerequisites
At least one optimization schedule must already be configured with associated resources — Impact tracker has no data to display until a schedule has run against a resource.
Required permissions
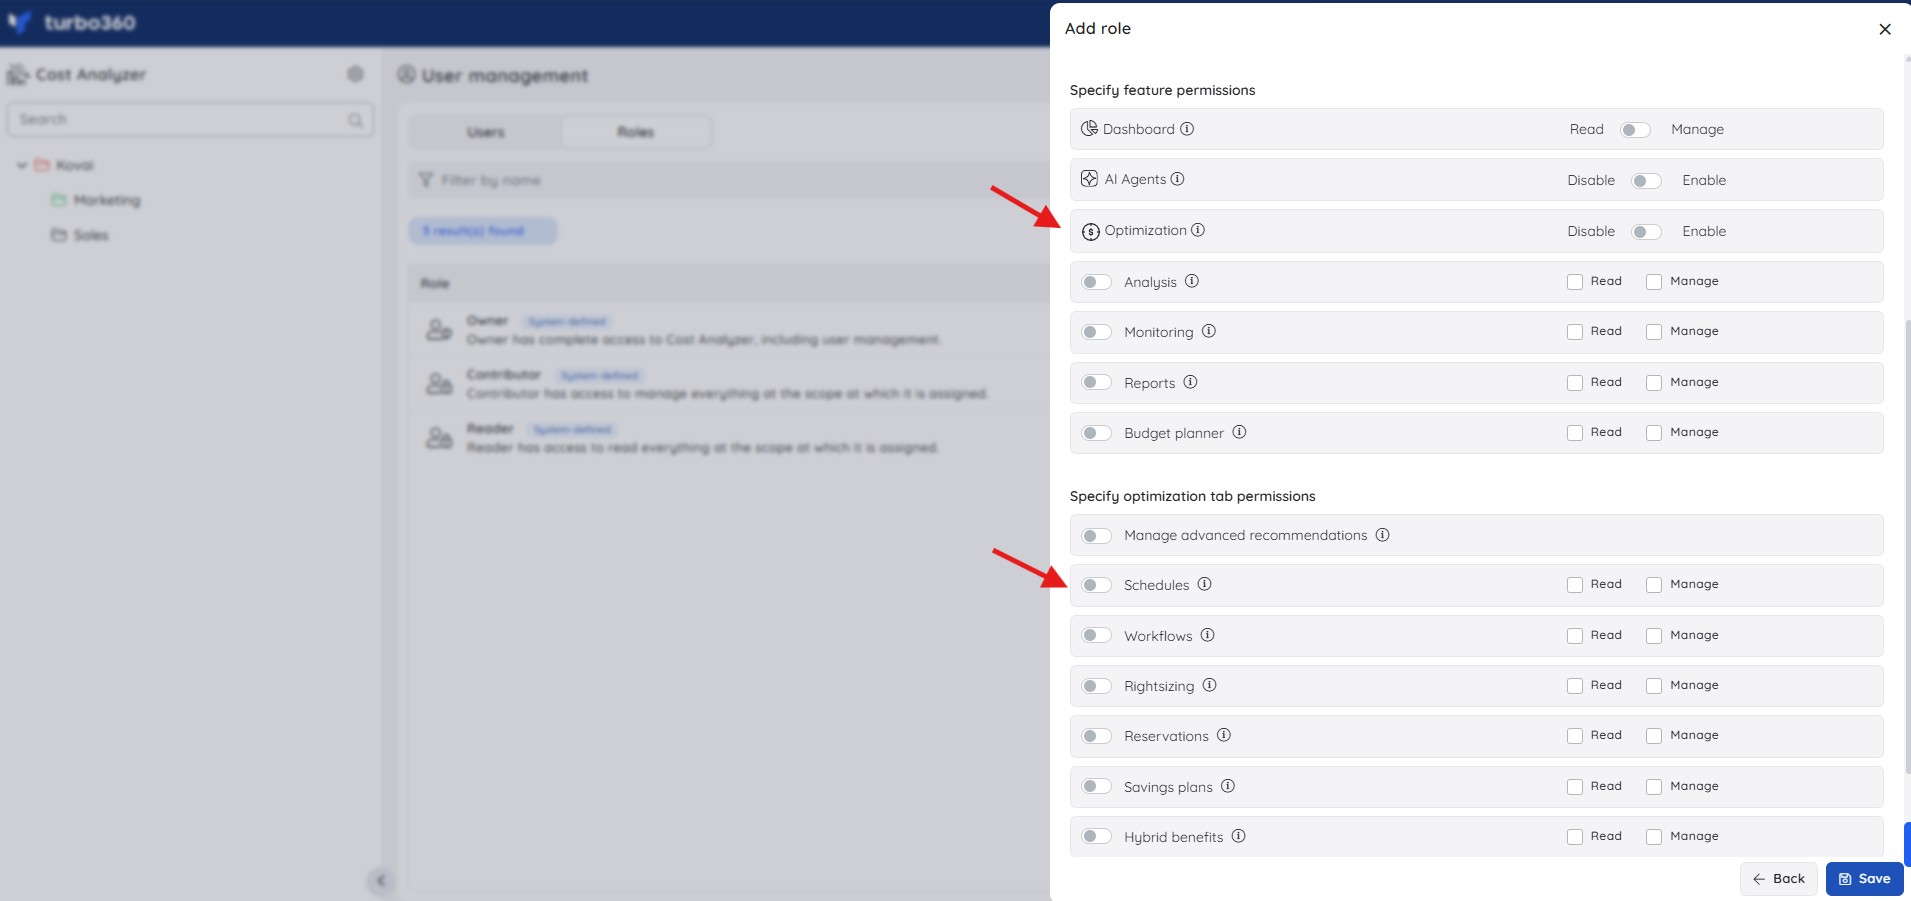
Impact tracker has no separate permission entry of its own — it's a view within Optimization > Schedules, so access is controlled by the same Schedules permission:
| Role | Permission level | Access |
|---|---|---|
| Account owner, Owner, Contributor | — | Full access to Impact tracker |
| Custom role | Optimization feature enabled + Schedules: Read | View Impact tracker |
| Custom role | Optimization feature enabled + Schedules: Manage | Full access to Impact tracker |
When assigning a custom role, enable Optimization under Specify feature permissions, then grant Read or Manage on Schedules under Specify optimization tab permissions — there's no dedicated Impact tracker toggle.
How it works
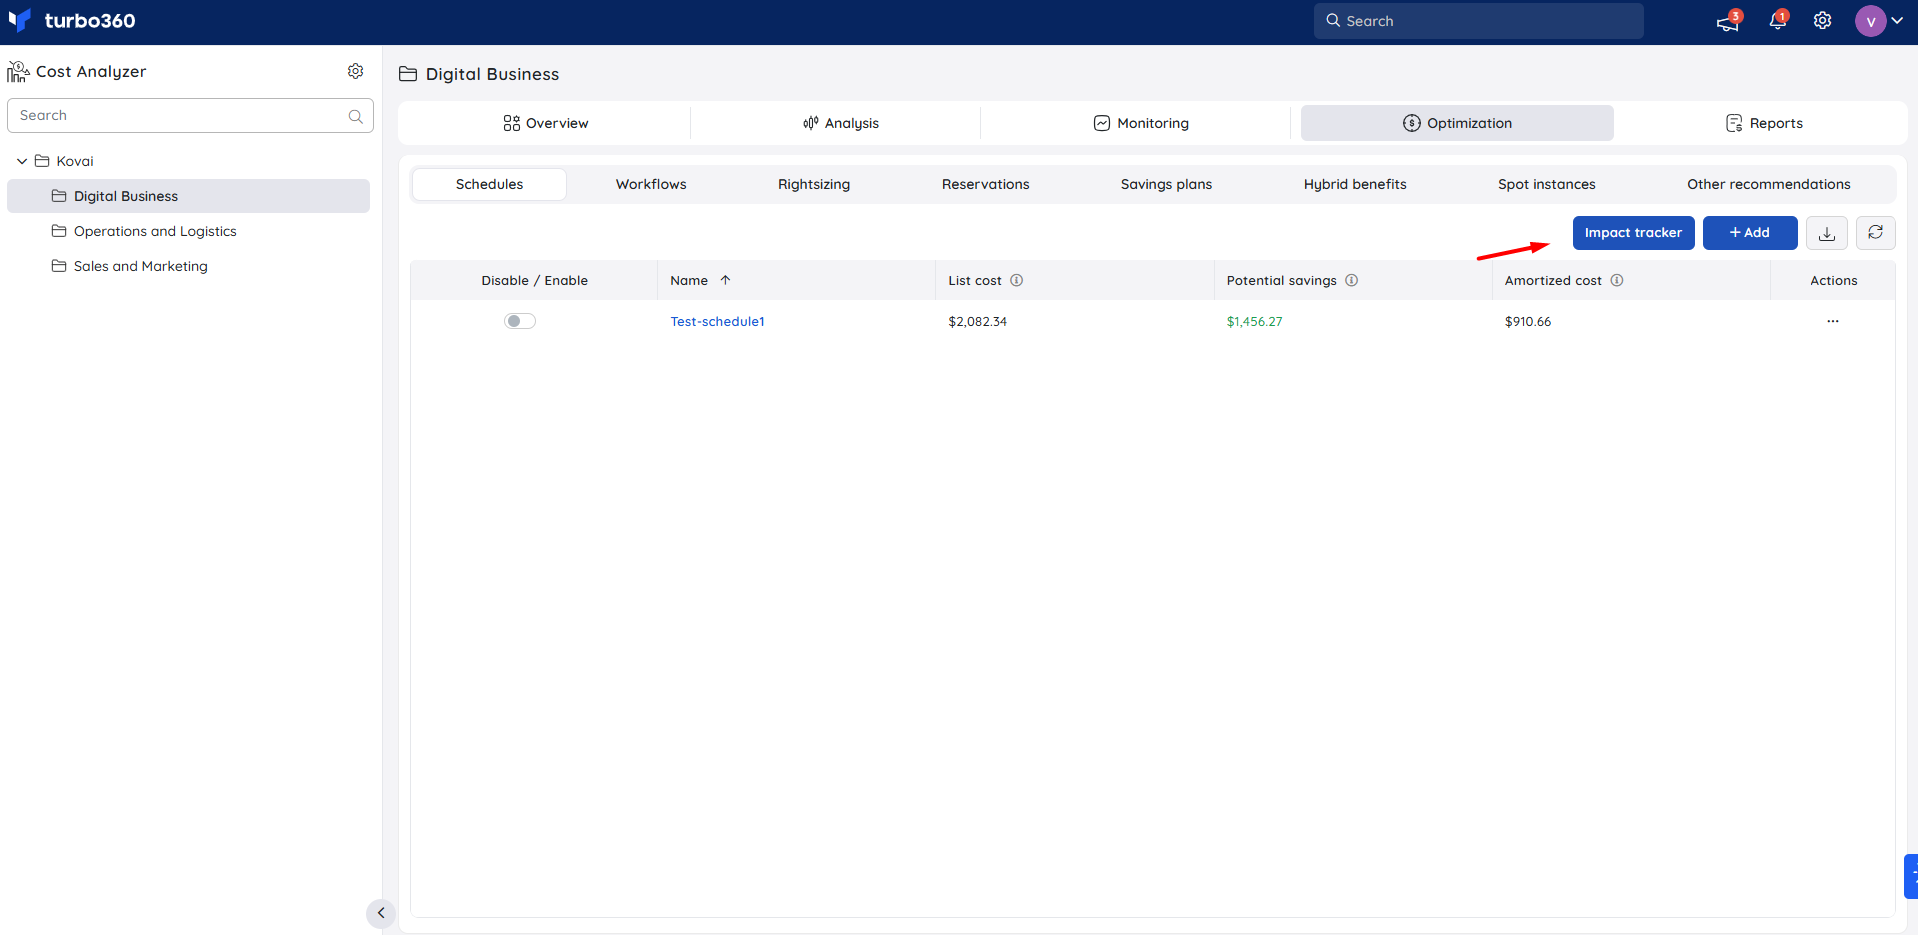
Impact tracker is accessible from the following path in a cost management group: navigate to Optimization > Schedules.
Impact insights
The summary section at the top of Impact tracker gives you an at-a-glance read on the overall effectiveness of your schedules.
- It categorizes resources based on impact (positive, negative, or no impact), displays the net impact across all schedules, and shows the total schedule count — along with a breakdown of schedules that are on track versus overspent.
- Enable Includes resources scheduled in child groups to roll up data from child cost management groups into the summary alongside the current group's resources.
.png)
Schedules tab
The Schedules tab provides a schedule-level view of cost impact — useful for identifying which schedules are delivering savings and which may need adjustment.
- Lists all schedules in the cost management group, along with the resource count per schedule and the number of days since each schedule was created.
- The impact cost shown per schedule is the sum of the impact costs for all resources associated with that schedule, as calculated in the Resources tab.
- All data can be exported as an Excel file using Download as excel.
Resources tab
The Resources tab provides a resource-level breakdown — useful for drilling into which specific resources are driving savings or contributing unexpected cost.
- Lists every resource associated with a schedule in the cost management group, including the resource name, the schedule it belongs to, and the impact cost in both the billing currency and USD.
- All data can be exported as an Excel file using Download as excel.
.png)
Impact cost calculation
Impact is calculated using the following formula:
Impact = (Baseline cost × Elapsed days) − Total amortized cost
Where:
- Baseline cost — the resource's daily cost observed during the two days prior to schedule creation. This establishes the pre-schedule spending rate.
- Elapsed days — the number of days from schedule creation to the selected evaluation date, excluding the current day.
- Total amortized cost — the actual cost incurred by the resource during that elapsed period.
Interpretation:
- Positive impact — actual cost is lower than the baseline projection, indicating the schedule is saving money.
- Negative impact — actual cost exceeds the baseline projection, indicating the resource has cost more since the schedule was created than it did before.
- No impact (NA) — the baseline cost is zero (no billing activity was recorded in the two days before schedule creation), so a meaningful comparison cannot be made.
A negative impact doesn't always mean the schedule is misconfigured. It can reflect legitimate increases in resource usage, pricing changes, or additional workloads added to the resource after the schedule was created.
Example scenario
The App Service Plan t360fnqa is associated with a schedule created on 23-03-2026.
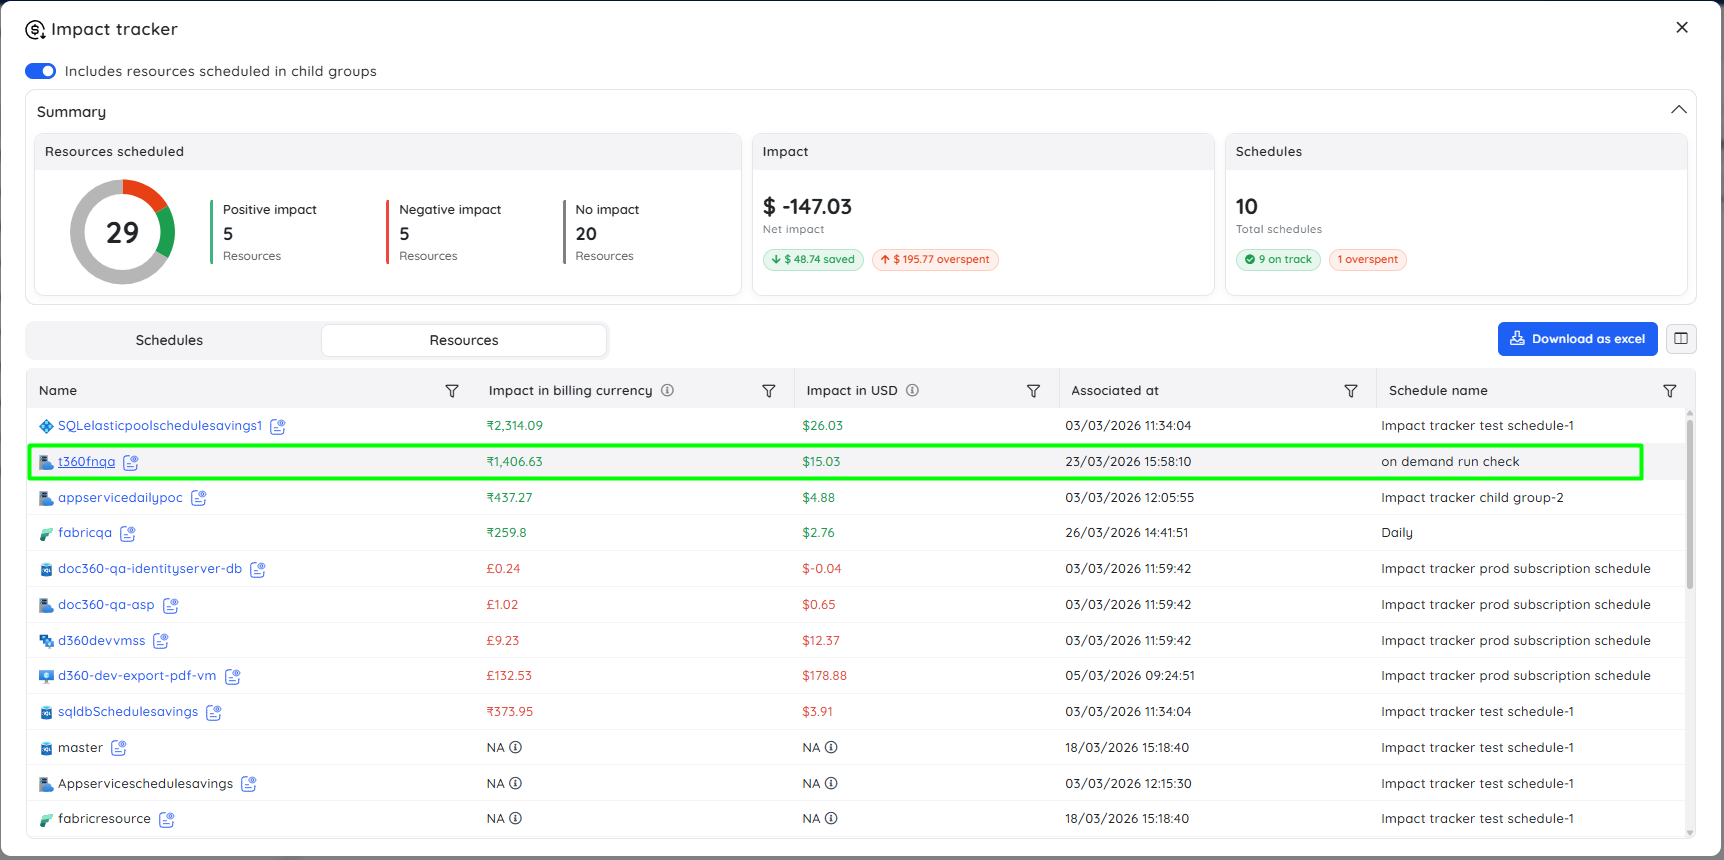
- Baseline cost (from 20-03-2026, two days prior): ₹87.85
- Impact evaluated as of: 06-04-2026
- Elapsed days (23-03-2026 to 05-04-2026) = 9 days (March) + 5 days (April) = 14 days
The elapsed day count starts from the schedule creation date (23-03-2026), not the start of March. The example in the screenshot may show a different elapsed period depending on the evaluation date selected.
- Total baseline cost: 87.85 × 36 = ₹3162.6
- Total amortized cost: ₹1756.1
- Impact = 3162.6 − 1756.1 = ₹1406.5
- Result: +₹1406.5 (cost savings)
.png)
Limitations
- Impact cost values may vary slightly due to ongoing data updates and processing.
- Impact cost is calculated in the billing currency by default. USD is shown alongside in the Resources tab for reference.
- Impact tracker only reflects resources that are actively associated with a schedule. Resources removed from a schedule stop contributing to impact data from the removal date.
Troubleshooting
A resource shows "No impact (NA)"
Cause: No cost was recorded for the resource during the two-day baseline period before schedule creation.
Fix: This is expected when baseline cost is 0. Confirm the resource had billed activity in the two days before the schedule was created if you expect a value.The impact cost value looks slightly different than expected
Cause: Impact cost values can vary slightly due to ongoing data updates and processing.
Fix: Wait for the next data processing cycle and recheck; minor fluctuation is expected behavior, not an error.The Schedules tab total doesn't match the sum of the Resources tab
Cause: The Schedules tab impact is derived directly from the total impact cost of its associated resources in the Resources tab, so a mismatch usually points to data still being processed.
Fix: Recheck after processing completes. If the discrepancy persists, cross-verify by exporting both tabs via Download as excel.Resources scheduled in child groups aren't showing
Cause: Includes resources scheduled in child groups is disabled.
Fix: Enable the toggle in the summary section to include resources scheduled within child cost management groups.Impact cost doesn't match an expected currency
Cause: Impact cost is calculated in the billing currency by default.
Fix: Check the billing currency setting. The Resources tab displays impact cost in both billing currency and USD for comparison.
FAQs
When does Impact tracker start showing data?
Data appears once a schedule has been created and at least one full day has elapsed, since elapsed days are calculated from the creation date. No data is shown on the day the schedule is created.What does a negative impact mean?
The resource has cost more since the schedule was created than the baseline rate projected. This can reflect increased usage, pricing changes, or new workloads added to the resource — not necessarily a misconfigured schedule.Can I see impact data across multiple cost management groups at once?
Not directly in a single view. To include child groups in the current group's summary, enable Includes resources scheduled in child groups in the summary section. For groups at the same level, review each group's Impact tracker separately.
Related articles
Was this article helpful?