

Kubernetes Service
- 05 Aug 2026
- 4 Minutes to read
- Print
- DarkLight
- Download PDF
Kubernetes Service
- Updated on 05 Aug 2026
- 4 Minutes to read
- Print
- DarkLight
- Download PDF
Article summary
Did you find this summary helpful?
Thank you for your feedback!
Overview
Azure Kubernetes Service (AKS) is a fully managed open-source container orchestration service offered by Azure, providing provisioning, scaling, and upgrades of resources without downtime. Kubernetes hosts your containerized applications, making them easy to deploy and manage without container orchestration expertise, as Azure takes over much of the responsibility.
Business value
Managing Kubernetes cluster state from Turbo360 gives you a single place to control and monitor AKS resources, reducing the time to detect and respond to cluster health issues without switching to the Azure portal.
How it works
- A Kubernetes cluster is a group of nodes that run containerized applications. Applications are packaged with their dependencies and some essential services when containerized, making them lighter and more adaptable than virtual machines.
- A Kubernetes Service can be one of the following types: ClusterIP (exposes a service accessible within a cluster), NodePort (exposes a service via a static port on each node's IP address), LoadBalancer (exposes a service through a cloud load balancer), or ExternalName (maps a service to a predefined externalName field via a CNAME record).
- Once a Kubernetes cluster is associated with a Business Application, its state can be monitored and controlled directly from Turbo360.
Permissions
Access to Kubernetes Service actions is controlled through RBAC when adding a role to a Business Application.
| Permission | Description |
|---|---|
| Read | View cluster details, the resource dashboard, and monitoring rules. |
| Manage | Start and stop the cluster, and configure monitoring rules. |
Operations
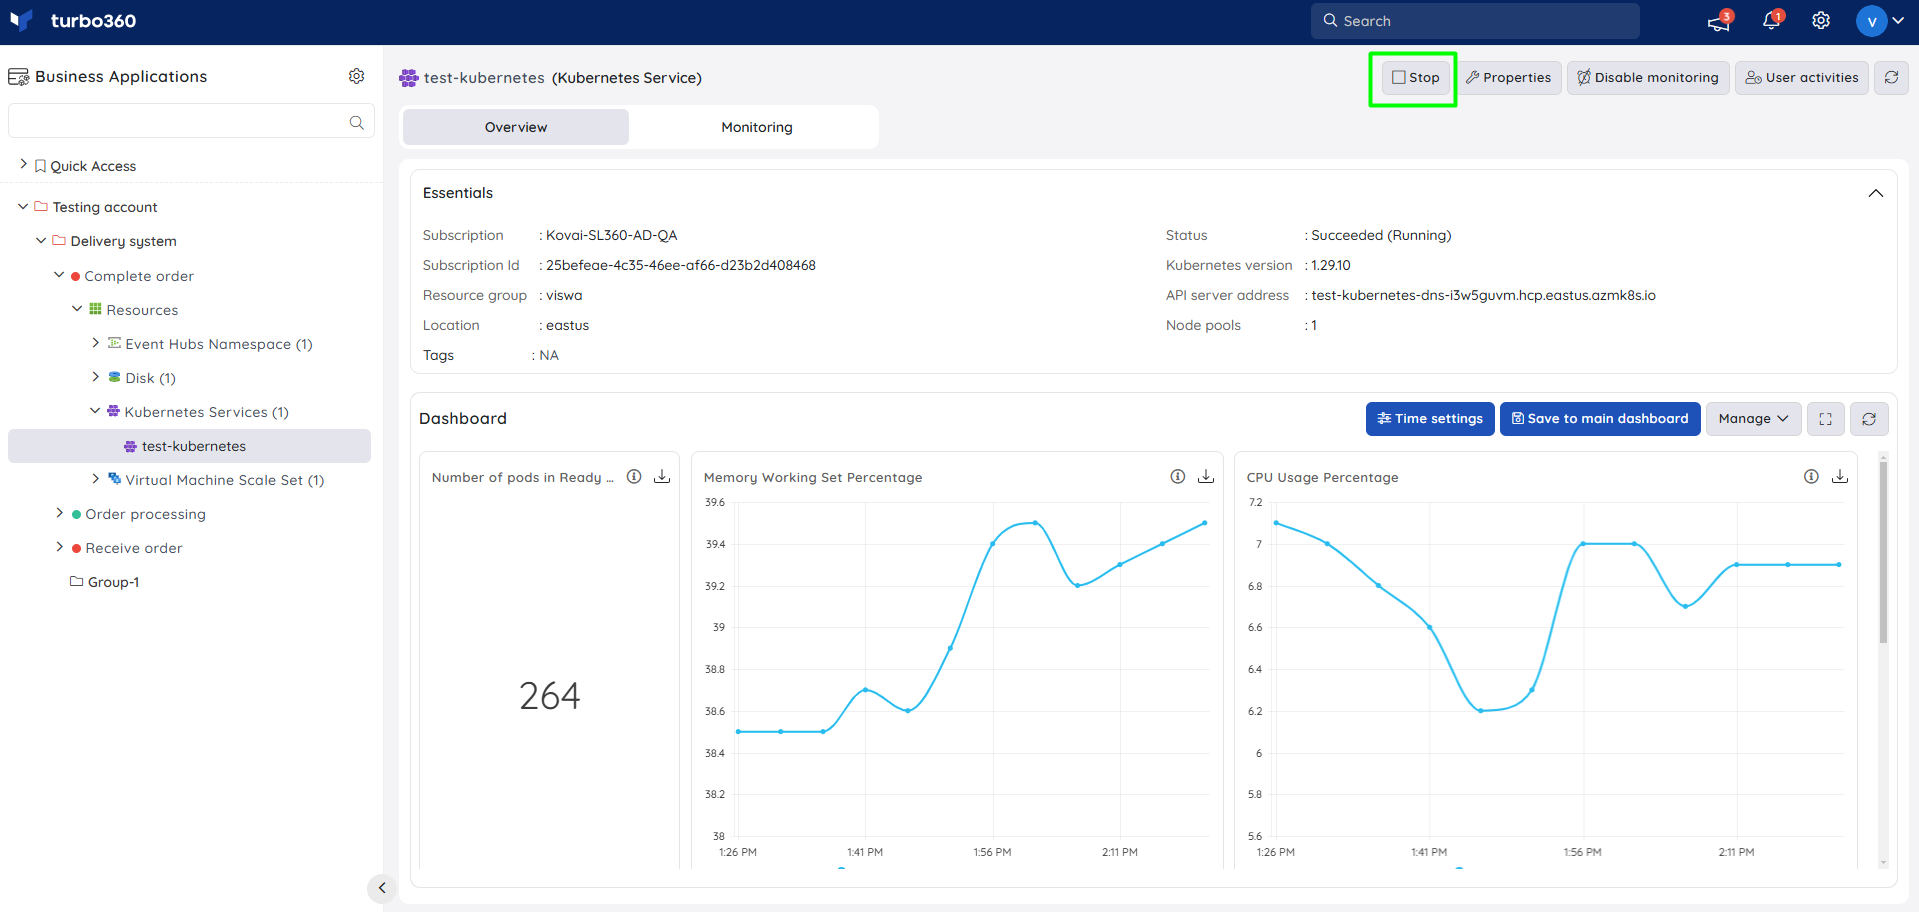
Turbo360 lets you control the lifecycle of Kubernetes clusters directly, without switching to the Azure portal — useful for incident response and scheduled maintenance.
Start and Stop
- Start — bring a stopped cluster online. Use this when workloads need the cluster available again.
- Stop — shut down a running cluster. Use this when the cluster is no longer needed, to control cost.
Bulk operations
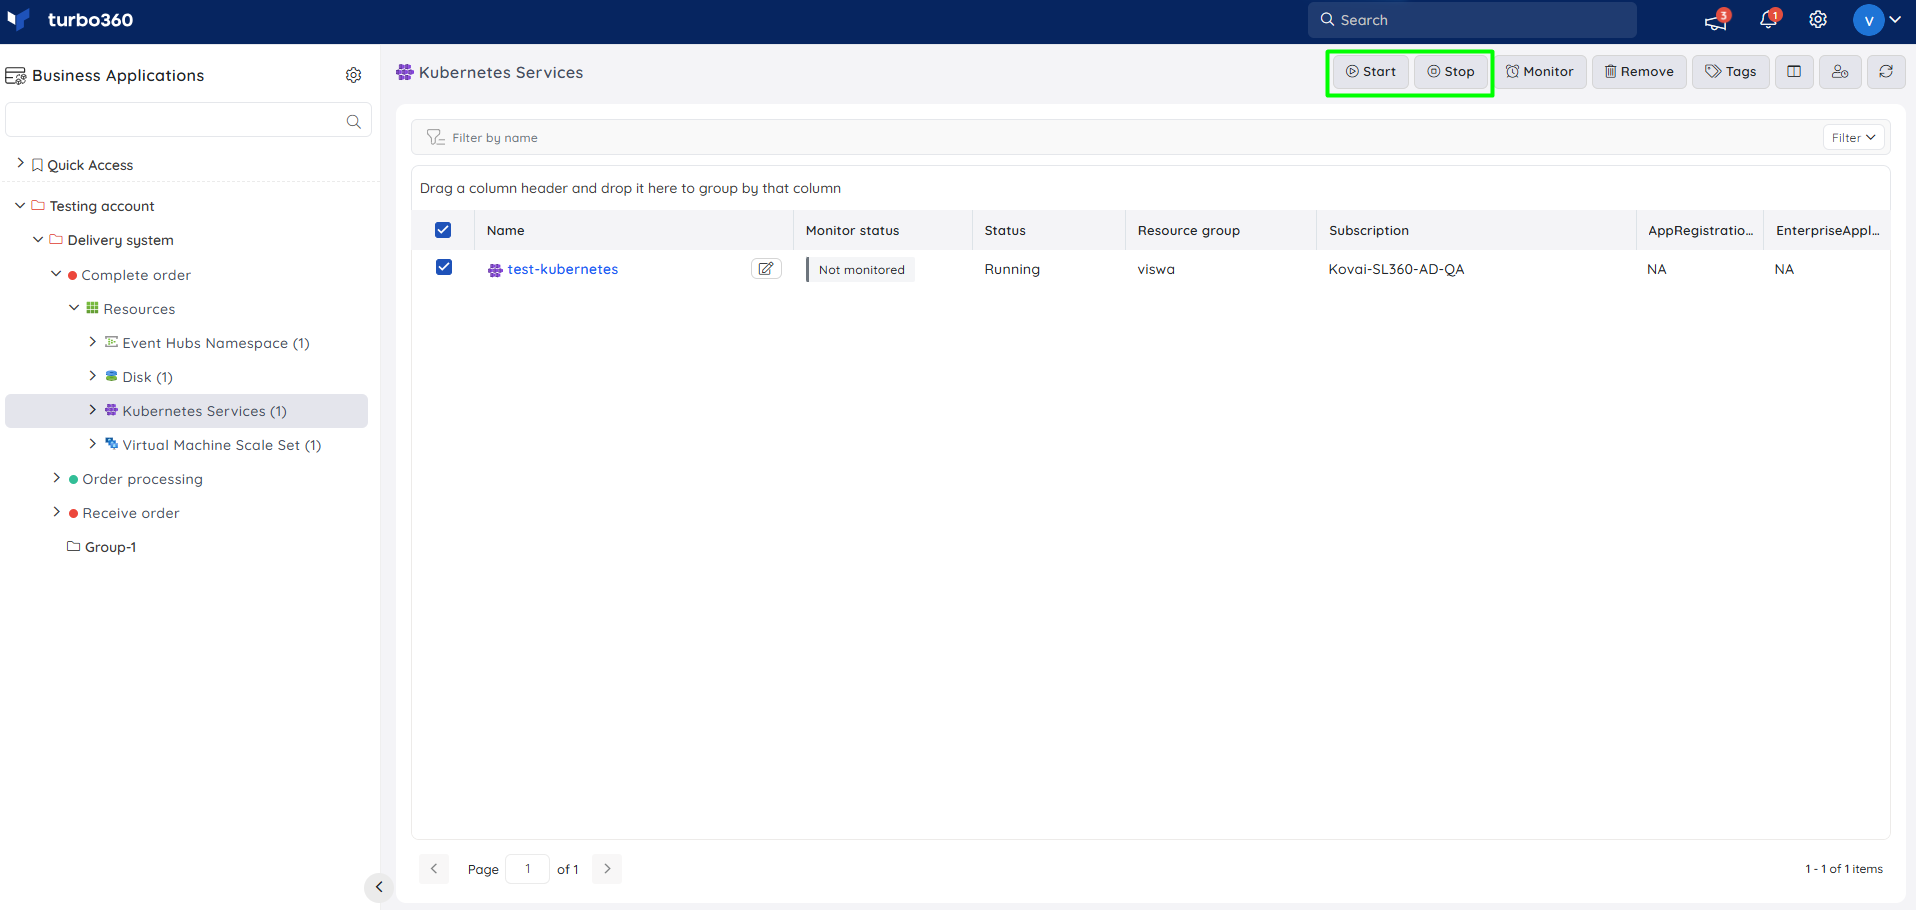
- Bulk Start/Stop — perform the Start or Stop operation on multiple clusters at once by selecting the required resources from the Kubernetes Services resource type section and using the corresponding breadcrumb option. Use this when several clusters need the same lifecycle change together, such as during scheduled maintenance, rather than one at a time.
Resource dashboard
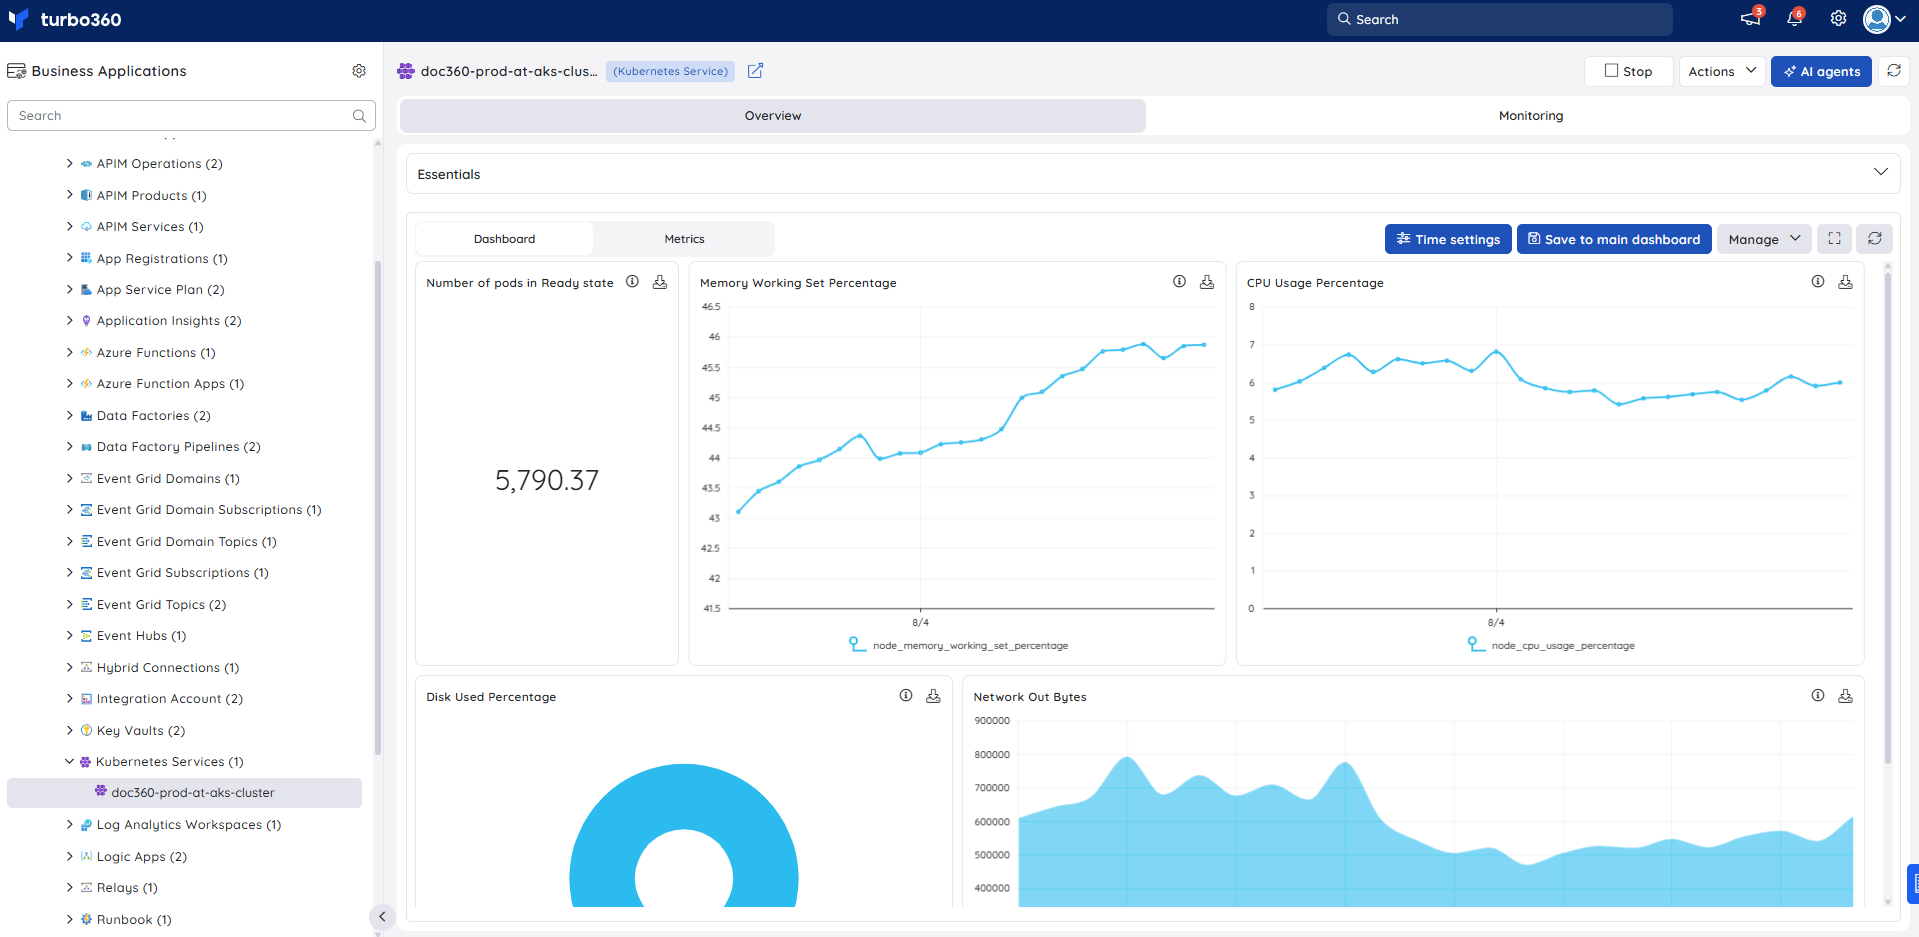
The Kubernetes Service dashboard surfaces pod, resource utilization, and network signals so you can spot cluster health issues without leaving Turbo360.
| Widget | What it shows |
|---|---|
| Number of pods in Ready state | Count of pods currently ready to serve traffic. |
| Memory Working Set Percentage | Memory utilization across the cluster. |
| CPU Usage Percentage | CPU utilization across the cluster. |
| Disk Used Percentage | Disk utilization across the cluster. |
| Network Out Bytes | Outbound network traffic volume. |
Metrics
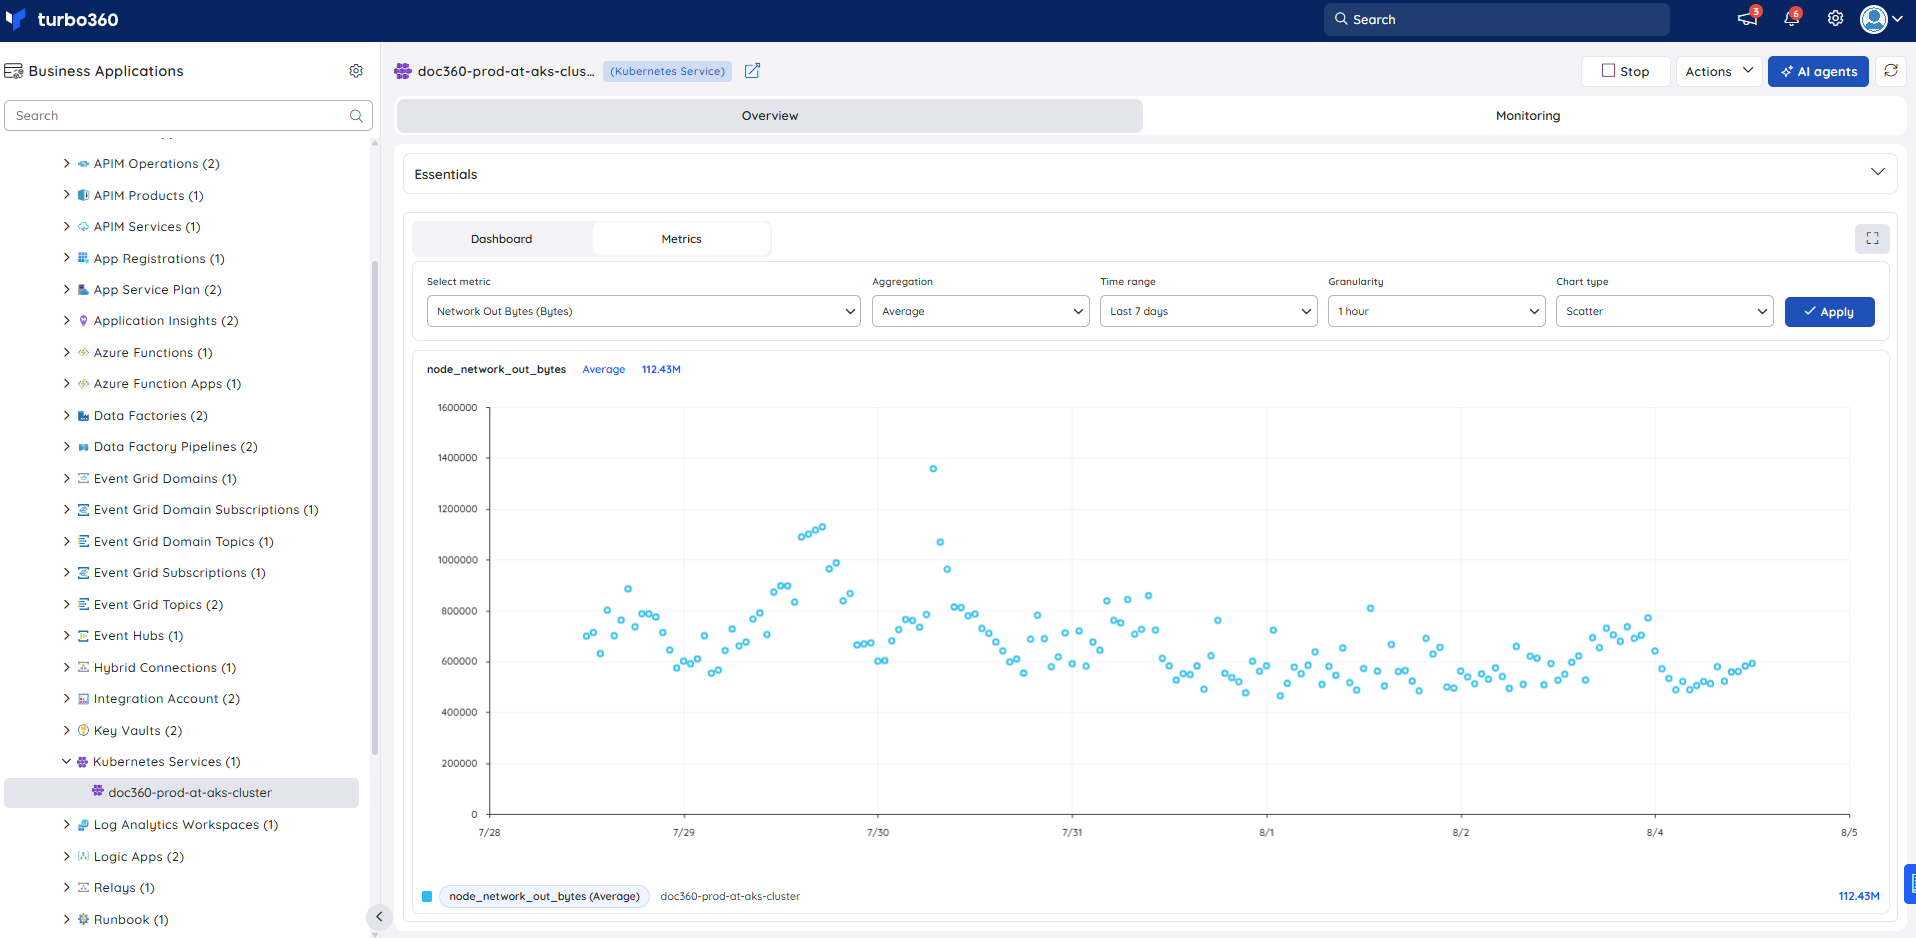
The Metrics tab surfaces CPU, memory, disk, and network utilization data for Kubernetes Service, giving you visibility into cluster resource consumption trends over time. Use the Metrics tab to identify whether sustained high CPU or memory utilization preceded a pod failure, and to confirm that resource levels normalize after a scale-out or maintenance operation.
You can add, remove, or reconfigure widgets to focus on the metrics most relevant to your support scenario.
Monitoring
Kubernetes Service supports availability status, state, and metric monitoring rules, configured under Kubernetes Service -> Monitoring.
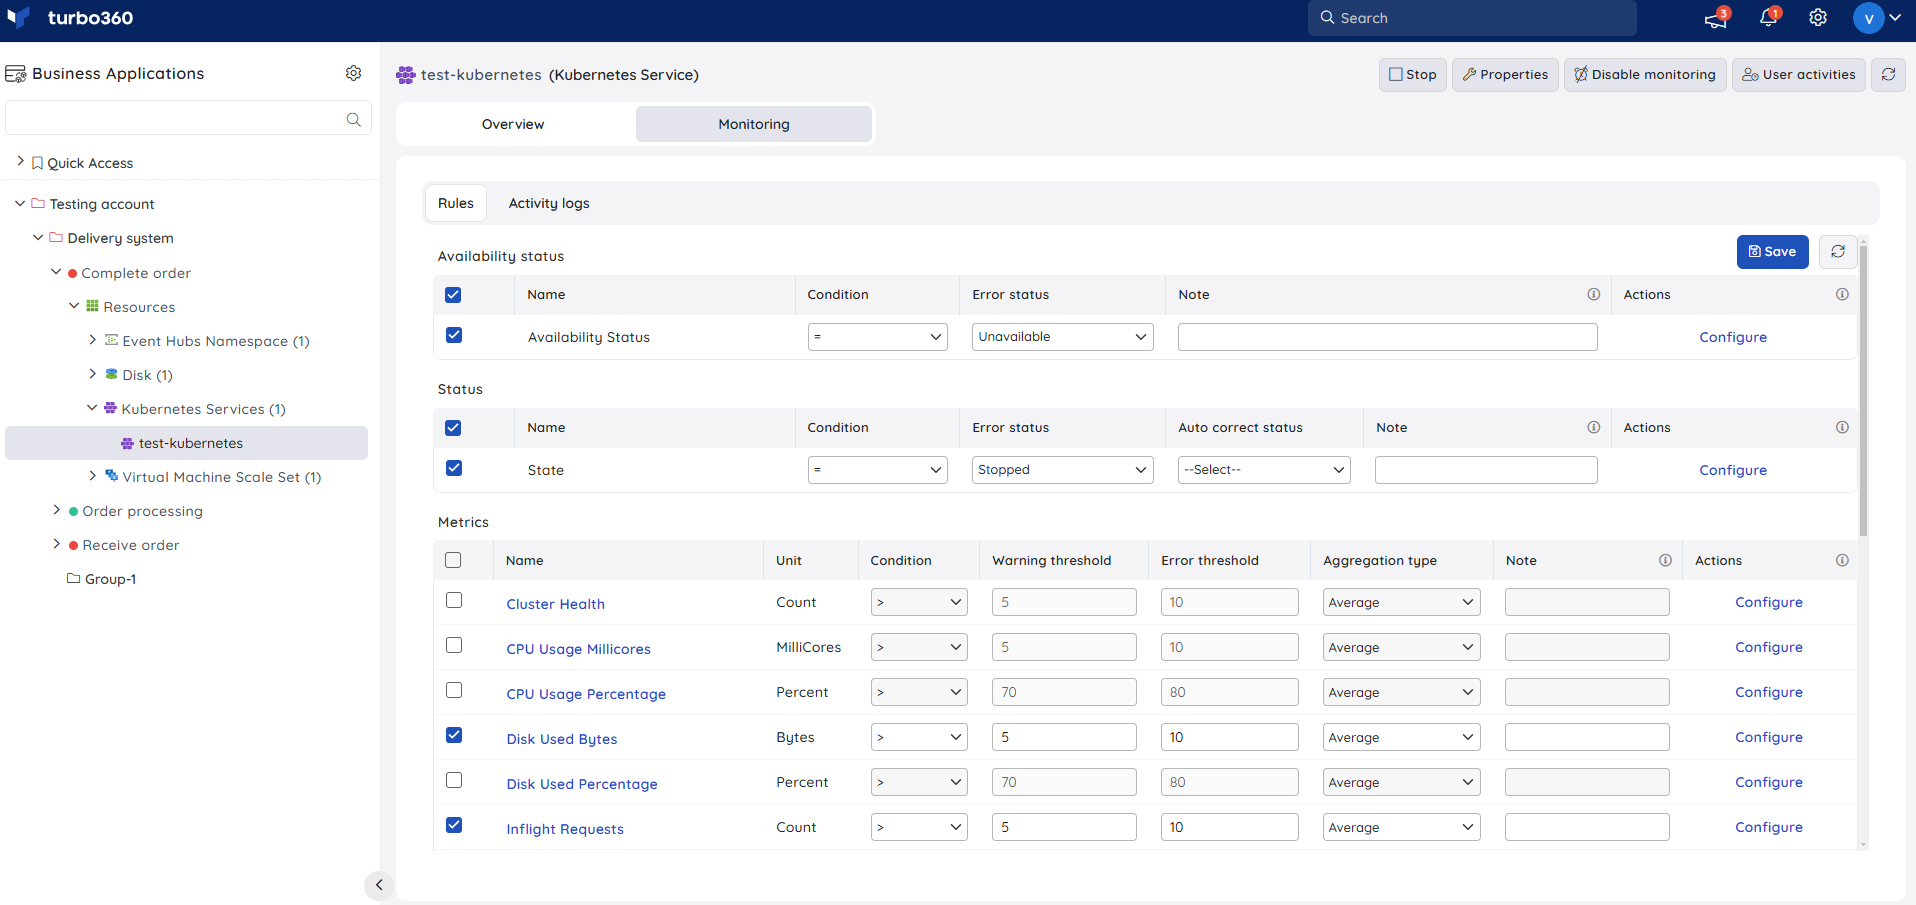
Monitoring rules are saved per resource, and the monitoring state is reflected after every monitoring cycle.
Availability status monitoring
Tracks the resource health status of the Kubernetes cluster. Use this when you need to be alerted as soon as the cluster becomes unavailable or degraded.
- Navigate to Kubernetes Service -> Monitoring.
- Configure the Availability status rule with the desired threshold.
- Click Save.
State monitoring
Tracks the operational state of the cluster. Use this when you need to be alerted if the cluster enters an unexpected state.
- Navigate to Kubernetes Service -> Monitoring.
- Select the State rule under the Status category and configure the threshold.
- Click Save.
Metric monitoring
Tracks resource metrics against a configured threshold. Use this when you need to be alerted if CPU, memory, disk, or network usage exceeds expected bounds.
- Navigate to Kubernetes Service -> Monitoring.
- Choose the required metrics and configure the threshold.
- Click Save.
The threshold values can be provided with any metric name; the rule is violated when the configured threshold value is met.
Troubleshooting
- Start or Stop operation fails
Cause: The cluster is in a transitional state, or the role lacks the Manage permission.
Fix: Wait for the current state transition to complete, or confirm the role has Manage access, then retry. - Bulk operation only applies to some clusters
Cause: One or more selected clusters were in an incompatible state for the requested operation.
Fix: Review the bulk operation result and retry the operation for the remaining clusters individually. - State monitoring rule does not trigger
Cause: The State rule threshold does not match the cluster's actual reported state values.
Fix: Review the available state values and adjust the threshold configuration. - Dashboard widgets show no data
Cause: The cluster was recently associated and has not completed its first monitoring cycle.
Fix: Wait for the next monitoring cycle, then refresh the dashboard.
Related articles
Was this article helpful?